March 1st, 2022 by Roy W. Spencer, Ph. D.

The Version 6.0 global average lower tropospheric temperature (LT) anomaly for February, 2022 was 0.00 deg. C, down a little from the January, 2022 value of +0.03 deg. C.
The linear warming trend since January, 1979 still stands at +0.13 C/decade (+0.12 C/decade over the global-averaged oceans, and +0.18 C/decade over global-averaged land).
Various regional LT departures from the 30-year (1991-2020) average for the last 14 months are:
YEAR MO GLOBE NHEM. SHEM. TROPIC USA48 ARCTIC AUST
2021 01  0.12  0.34 -0.09 -0.08  0.36  0.50 -0.52
2021 02  0.20  0.32  0.08 -0.14 -0.65  0.07 -0.27
2021 03 -0.01  0.13 -0.14 -0.29  0.59 -0.78 -0.79
2021 04 -0.05  0.05 -0.15 -0.28 -0.02  0.02  0.29
2021 05  0.08  0.14  0.03  0.06 -0.41 -0.04  0.02
2021 06 -0.01  0.31 -0.32 -0.14  1.44  0.63 -0.76
2021 07  0.20  0.33  0.07  0.13  0.58  0.43  0.80
2021 08  0.17  0.27  0.08  0.07  0.33  0.83 -0.02
2021 09  0.25  0.18  0.33  0.09  0.67  0.02  0.37
2021 10  0.37  0.46  0.27  0.33  0.84  0.63  0.06
2021 11  0.08  0.11  0.06  0.14  0.50 -0.42 -0.29
2021 12  0.21  0.27  0.15  0.03  1.63  0.01 -0.06
2022 01  0.03  0.06  0.00 -0.24 -0.13  0.68  0.09
2022 02  0.00  0.01 -0.02 -0.24 -0.05 -0.31 -0.50
The full UAH Global Temperature Report, along with the LT global gridpoint anomaly image for February, 2022 should be available within the next several days here.
The global and regional monthly anomalies for the various atmospheric layers we monitor should be available in the next few days at the following locations:
Lower Troposphere: http://vortex.nsstc.uah.edu/data/msu/v6.0/tlt/uahncdc_lt_6.0.txt
Mid-Troposphere: http://vortex.nsstc.uah.edu/data/msu/v6.0/tmt/uahncdc_mt_6.0.txt
Tropopause: http://vortex.nsstc.uah.edu/data/msu/v6.0/ttp/uahncdc_tp_6.0.txt
Lower Stratosphere: http://vortex.nsstc.uah.edu/data/msu/v6.0/tls/uahncdc_ls_6.0.txt
La Niña still further in action
Perhaps, just perhaps, it is true: the next Little Ice Age cometh.
Luckily, while we carry on with wind and solar, we’ll leave a few 100 years worth of coal in the ground for our descendants. They will thank us greatly.
That’s one way to look at it.
Perhaps if we leave them nothing they’ll be happy.
It is exceedingly common for a new generation to refute most of the beliefs and activities of the previous generation. Being happy with nothing doesn’t seem to me to be a logical result of that kind of turn about.
there has to be a balance between nothing and something, otherwise we will all be naked and unable to receive propaganda.
As long as they own nothing, they’ll be happy, isn’t it?
That’s what I was getting at.
Yeah I got it Scissor. I’d have thought that phrase would have been burned into everyone’s brains by now.
“You will think nothing, and you’ll be happy!”
Klaus Schwab’s “Walking Brain Dead”.
And if we sequester all the CO2, at some future point they just can release it all to melt the approaching glaciers !!
That would almost certainly be a useless exercise and a big wasre of energy,
Let’s play it safe and not sequester the CO2 – either we avoid a deep freeze or things get a little bit warmer – or nothing noticeable happens as a result…
Unfortunately they sequester more O2 than Carbon and it wastes loads of energy to sequester, does tat make any sense?.
Even the IPCC has stated that warming of up to 1.8C is beneficial for the planet.
Yeah, it seems like we’re doing the noble thing by not using it, but in 100+ years they’ll have fusion and / or other forms of cheap energy. The time to use the coal etc is now, when we need it.
We don’t need it. The planet has enough thorium to power the world at present consumption rates for 5,000 years. And China just started testing on a thorium molten salt reactor last fall.
https://www.nature.com/articles/d41586-021-02459-w
The first efforts to develop a MSR were associated with the Aircraft Nuclear Propulsion (ANP) program and the preceding Nuclear Energy for the Propulsion of Aircraft (NEPA) project. The United States Army Air Forces initiated Project NEPA in 1946. The project included experiments, including high temperature and engine tests collectively called the Heat Transfer Reactor Experiments: HTRE-1, HTRE-2 and HTRE-3 at the National Reactor Test Station (now Idaho National Laboratory) as well as an experimental high-temperature molten salt reactor at Oak Ridge National Laboratory – the ARE.
ARE used molten fluoride salt NaF-ZrF4-UF4 (53-41-6 mol%) as fuel, moderated by beryllium oxide (BeO). Liquid sodium was a secondary coolant. The experiment had a peak temperature of 860 °C. It produced 100 MWh over nine days in 1954.
An MSR was operated at the Critical Experiments Facility of the Oak Ridge National Laboratory in 1957.
So, over some 67+ years, this “promising” MSR technology has failed the catch the attention of all major commercial power plant manufacturers, including those that specialize in commercial scale nuclear power plants, with all the attendant capital costs, siting and licensing problems related to them.
Also, the US Navy, with every reason to be focused on the inherent safety and reliability for the compact nuclear reactors it uses on submarines and aircraft carriers, has obviously seen no reason to pursue MSR technology . . . ask yourself why.
These facts alone should tell you that even today, we are far removed from having a commercially viable MSR power plant.
“Fools rush in where angels fear to tread” — Alexander Pope, 1711
yes
regulation might play a part but the corrosion risks are terrifying
not to mention transmutation
I’m sure I also read that these programs were no use in producing weapon material by-products. Also your Nuc sub analogy (having asked myself) looks like a strawman. After all it’s horses for courses, there weren’t many steam driven planes or F1 cars.
Thorium might provide all we the power we need in 10 or 20 years. Everyone connected to the grid today needs coal, etc. now.
Idle speculation: perhaps without the supposed effect of human CO2 emissions it would be here already.
Not so idle:
— Look at the current solar minimums (historically deep solar minimum cycles repeated over years); that is, “quiet” Sun conditions
— Look at the sign change in the Milankovitch cycle of Earth’s obliquity and the current overlapping time phasing of several of Milankovitch’s cycles
— Finally, but perhaps most importantly, look at at the quasi-periodicity (about every 1500 years) of Dansgaard-Oeschger (D-O) events and the associated cooling intervals know as Heinrich events:
“Heinrich events only occur in the cold spells immediately preceding D-O warmings, leading some to suggest that D-O cycles may cause the events, or at least constrain their timing . . . The course of a D-O event sees a rapid warming, followed by a cool period lasting a few hundred years. This cold period sees an expansion of the polar front, with ice floating further south across the North Atlantic Ocean.”—source: https://en.wikipedia.org/wiki/Dansgaard%E2%80%93Oeschger_event (my underlining emphasis added). By some accounts we are long overdue for the next Heinrich event based on paleoclimatology evidence.
” Look at the sign change in the Milankovitch cycle of Earth’s obliquity and the current overlapping time phasing of several of Milankovitch’s cycles ”
Where did you get THAT from?
https://geol105.sitehost.iu.edu/images/gaia_chapter_4/milankovitch.htm
We are presently in ideal conditions wrt the Milankovitch cycles.
*
And about the future behavior of the current cycle SC25 (let alone of its successors), we hardly do know anything.
Many people predicted SC25 to keep from the start lower than SC24, but…
Earth’s current mean tilt of its spin axis with respect to the plane of the ecliptic (its obliquity) oscillates between 22.1 and 24.5 degrees. Today, Earth’s obliquity is at 23.44 degrees (just 0.14 degrees past the mid-point of the limits) and decreasing.
The “Little Ice Age” was a phenomena limited in extent to Earth’s northern hemisphere. This is mostly due to the fact that NH has much more land surface area compared to water surface area (a ratio of 0.39:0.61) compared to the SH ratio of 0.19:081. The greater amount of ocean area in the SH significantly stabilizes temperatures there compared to those in the NH, all other things being equal.
Also, a far great percentage of the world’s population lives, and has lived, in Earth’s northern hemisphere; hence, the greater impact of temperature swings there.
So, as Earth’s obliquity decreases there is actually less intense sunlight falling on the NH polar and temperate regions during their summers, leading to less ice melting/generally cooler temperatures.
It is a fact that less intense solar insolation in NH leads directly to cooler temperatures in NH.
The “sign change” in obliquity that I referred to in my above post was meant to reflect Earth’s NH shifting from the half-cycle of obliquity spent on the warm side (i.e., axis tilt angle greater than 23.3 degrees) to the upcoming half-cycle spent of the cool side (axis tilt angle less than 23.3 degrees) with “warm” vs “cool” referring to expected temperature trends only in Earth’s northern hemisphere. In hindsight, I admit that I could, and should, have used a better phrase to clarify this statement.
As to my reference to the “time phasing” of several Milankovitch cycles, just look at what you stated for your items #1, #2 and #3 in your above response.
Last point of clarification: I am NOT stating, or even implying, that Milankovitch cycles are themselves the cause of the Little Ice Age that occurred from about 1450 to 1850 AD (note: timespan varies by source). An interval of 400-500 years is far too short to correlate with the period of any given Milankovitch cycle. Instead, what I am stating is that changes in Milankovitch cycles, especially in overlapping conditions, can establish trends that are conducive to periods of cooling in Earth’s northern hemisphere (just as at other times they may be conducive to periods of warming . . . as is without doubt in the case of exiting Earth’s last glacial period and the onset of the Holocene).
Nobel Peace Prizes for Exxon Executives …….
I don’t think the snow would last that much longer if the temperatures were a few tenths of a degree warmer.
A few tenths of a degree cooler. Sorry.
Makes sense. We had the 25 years of Dansgaard-Oeschger warming. DO warming periods are cyclic. The most amount of warming during a DO warming period is on the Greenland Ice sheet.
The sun spots are disappearing, shrinking. Solar cycle 25 appears to be a failed cycle. Same as the solar cycle that preceded the Maunder minimum.
The DO warming periods were discovered when the first Greenland Ice core was analyzed. The climate scientists did not and still do not have an explanation for the D-O warming periods. For this reason, a second Greenland Ice core was taken. It confirmed that there is cyclic warming.
Greenland ice temperature, last 11,000 years determined from ice core analysis, Richard Alley’s paper. William: As this graph indicates the Greenland Ice data shows that have been 9 warming and cooling periods in the last 11,000 years.
http://www.climate4you.com/images/GISP2%20TemperatureSince10700%20BP%20with%20CO2%20from%20EPICA%20DomeC.gif
There is cyclic warming, with the same periodicity as the warming in the Northern hemisphere, in the Southern Hemisphere. There has been 242 warming events in the last 240,000 years in the Southern hemisphere.
Does the Current Global Warming Signal Reflect a Recurrent Natural Cycle.
http://wattsupwiththat.files.wordpress.com/2012/09/davis-and-taylor-wuwt-submission.pdf
“Public media in the U.S., including National Public Radio (NPR), were quick to recognize the significance of this discovery. The past natural warming events reported by Mulvaney et al. are similar in amplitude and duration to the present global warming signal, and yet the past warmings occurred before the industrial revolution and therefore were not caused by anthropogenic greenhouse gases. The present global warming cycle lies within the range of these past natural warming cycles, suggesting that the present global warming cycle may be of natural origin and not caused by human activity–as climate skeptics have been arguing for some time.”
I have a funny feeling that Brandon won’t mention Dr. Spencer’s most recent measurement of the Temperature of the Global Lower Atmosphere this evening.
That fact would be “INCONVENIENT” (to put it mildly).
+100
Any levelling or lowering of temperature will be credited to their policies, as long as we don’t blow ourselves up in the present shenanigans, which can probably also be attributed to their policies.
21st Century atmospheric CO2 concentrations went steadily up while atmospheric temperatures are essentially flat (it takes a double Super El Nino to get a wiggle). Most of the 43-year period of UAH6 measurements occurred during a rising portion of an approximate 70-year temperature cycle of ups and downs. The best the climate could do was a measly 0.13 C/decade; color me unimpressed.
and we’re presently a couple of decades below the 4 decade trend line.
Biden with the nuclear football – what could go wrong?
Biden. What could go right?
I doubt Brandon even knows what the “Temperature of the Global Lower Atmosphere” is.
Depends.
There are several, equally reliable brands, he could choose from.
I’m prsently working on a project to produce adult diapers out of that super-absorbant stuff Sham-Wow. That way, you only have to change them once a week.
That’s inspired … it certainly beats my idea of filling them with kitty litter.
Actually, no one does.
If they tell him during lunch, they have to remind him during dinner.
Brandon’s approval score in the polls is down to 35%…But, worse, that’s also his score on the Mini Mental Status Exam.
Brandon does not even know if the sun came up today!
Brandon still thinks CO2 is pollution. And he thinks Carbon is CO2.
Brandon, like an idiot, will promote climate change and the Green New Deal!
Joe is in the 1960’s and predicting the 21st century.
What does the demented one know about anomalies?
Brandon thinks an anomaly is an “African-American who is articulate and bright and clean and a nice-looking guy”.
Add cycles to the list of things officially forgotten. (Along with Russian aggression)
NOAA SST-NorthAtlantic GlobalMonthlyTempSince1979 With37monthRunningAverage.gif (880×481) (climate4you.com)
I don’t feel quite as bad about Russian aggression into Ukraine after watching Oliver Stone’s Ukraine On Fire, which was made in 2016. Basically, it’s been a tug of war there for like forever.
Bingo.
Does Oliver Stone still think the CIA killed Kennedy?
Like I said, above.
Equal 16th warmest February in the UAH data, or equal 28th coldest if you prefer.
Monckton pause now starts in October 2014, 7 years and 5 months old.
CO2 goes up and up and the world thrives while Temperature is flat 🤔
The answer to the old riddle about whether a glass is half full or half empty depends on that what was happening before it reached the half mark. If the glass was being filled, then it is half full; if the glass was being emptied, then the glass is half empty.
Because the temperature was previously increasing before the current hiatus, then probably the “Equal 16th warmest February” is the appropriate metric. It indicates that the warming is ranked well down the scale. No more “warmest evah!”
Half full or half empty value rating can be assessed with a simple question: what’s in the glass and do I have to drink it?
I’ve always assumed that the glass is twice as big as it needed to be.
The Holy Trender has weighed in.
/yawn/
Only trend mentioned here is by Dr Roy Spencer. “The linear warming trend since January, 1979 still stands at +0.13 C/decade (+0.12 C/decade over the global-averaged oceans, and +0.18 C/decade over global-averaged land).”
Waiting for one of the Gorman’s to ask Spencer why he’s predicting there will be 13°C of warming over the next 1000 years.
You are in no position to make demands.
I’m not demanding anything – just waiting. (I know they won’t becasue it’s only my trends that are considered predictions.)
So tell us [tinu] why you are such a big UAH groupie?
I’m skeptical about UAH, given it’s such an outlier. But it’s the only data set discussed here, as all other’s show more warming and hence are regarded as bogus.
Oh yeah, sure I believe this. Each and every month you show to proclaim (again) how its the hottest evah evah evah.
I know maths isn’t your strength, but surely even you can see that being the 16th warmest February out of 44, does not make it the warmest ever.
44 Februarys?
Think about this.
What conclusions do you want me to come to? I’ve said this was the 16th warmest February using UAH data which is limited to 44 Februaries. You for some reason think this means it was the warmest month ever. I think it was a pretty average February.
You have blinders on.
Are you going to explain why you think I’m saying this was the warmest EVAH month?
16 out of 44 is close enough to the midpoint that the difference isn’t relatively unimportant.
I’d say it is relatively unimportant. It doesn’t really matter if this was 14th warmest or 20th warmest.
The ranking is only ever a little bit of fun and additional context for what the anomaly means. This February was quite average by recent standards and a little above average by previous standards. The anomaly of 0.0°C means it was exactly average for the 1991-2020 base period, it’s 0.16°C warmer than the previous 1981-2010 base period.
Because you keep pointing to these little datums as if they have deep meaning.
All others are subject to much more updates and changes. See climate4you. UAH is the most reliable.
“I’m skeptical about UAH, given it’s such an outlier.”
Are you equally skeptical of the weather balloon data?
The weather balloon data says all the other data sets are the “outlier”, since the weather balloon data correlates with UAH data.
I’m skeptical about any global data set. I’m not familiar with the process of generating a global set from balloon data, but I would guess it has problems.
Do you have a specific balloon data set in mind? I keep hearing that they show the same rate of warming as UAH, but that seems to depend on which particular set you are using.
https://www.drroyspencer.com/2019/04/uah-rss-noaa-uw-which-satellite-dataset-should-we-believe/
TA said: “The weather balloon data says all the other data sets are the “outlier”, since the weather balloon data correlates with UAH data.”
UAH = +0.13 C/decade.
RSS = +0.21 C/decade
RATPAC = +0.21 C/decade
“Ratpac radiosonde data shows spurious warming when compared to the average of 7 other radiosonde and reanalysis datasets for TLT”.
This is a quote from the link that I provided above. Ratpac is an outlier along with RSS. The NOAA and UW satellite datasets are just minor variations of the RSS dataset with the same uncorrected errors.
BT said: “Ratpac is an outlier along with RSS.”
Maybe. Keep in mind that the quote is for the tropical regional only. Also the Christy et al. 2018 publication does show the breakdown in figure 17. RATPAC looks to be more consistent with UAH than RSS at least for the tropical region. It is also looks to be pretty consistent with the other datasets including reanalysis so I’m not sure what the exact details of that quote from Christy is in reference to. Anyway, I think this lends some credence to the hypothesis that the differences between UAH and RSS are probably outside of the tropical region.
If you read the link, you will see that the quote is for global TLT.
Here is what Christy said:
Also, Christy et al. 2018 considered only the 20S to 20N area for the comparison.
You have misread the link. The quote comes from the plot in the update. This clearly shows that the comparison is made over global TLT. You have confused the main post with the update.
Yep. You are absolutely correct. The graph even says “Global TLT”. I’m not sure how I missed that.
What is wrong with it that makes it an outlier?
Let’s see, what outliers proved true.
Theory of relativity.
Gravity.
The earth is round.
Electromagnetic waves thru a vacuum.
Heliocentrism.
Need I go on?
Being an outlier is not an automatic conclusion of being wrong!
I didn’t say it was necessarily wrong, just that I was skeptical. I’m skeptical about all data sets, I think that’s the correct way to approach all data, especially anything as complicated as attempt to measure global temperature change.
I’m more skeptical about UAH because it shows more a difference than other sets, although I don;t think it’s that big a difference. Either UAH is underestimating the rate of warming, or all other sets are overestimating it. Not impossible, just slightly less likely. I’m also skeptical of satellite data in general because of the marked differences between different versions and the sparsity and remoteness of the instruments.
“I’m also skeptical of satellite data in general because of the marked differences between different versions and the sparsity and remoteness of the instruments.” — Bellman
Ummm, Bellman, can you list any instrument platform other than satellites that provides nearly-continuous temperature monitoring of 100% of Earth’s surface area between the latitudes of -60S to +60N?
And, yes, I am aware that the microwave radiometer instruments on the NOAA/NASA weather satellites used to obtain the UAH temperatures data sets are not useable for deriving temperatures when there is snow or ice covering the ground . . . one of the reasons the coverage does not include the polar regions, but also not being a source of significant error-correction when there are summer seasons in either the northern hemisphere or the southern hemisphere.
Yes, satellites enable a more consistent global coverage, and in that respect they are better than surface or balloon data. But the issues are how you derive a lower troposphere global estimate from that. Obvious point is that RSS has the same data, and the same coverage, yet gives a different trend. And previous versions of RSS and UAH gave different results despite using the same data.
Maybe you should have a word with Carlo, Monte, who’s accusing me of being a groupie for UAH and thinks the data is completely meaningless. I don’t agree with that, I’m skeptical about any data set or method being perfect, but at the same time they all show a consistent pattern.
This should tell you something…
And no, I never implied (or think) that “the data is completely meaningless”, quit lying.
Yes, it tells me I’m right to be skeptical of satellite data.
You said the uncertainty of monthly UAH data was more than ±3°C. Given that that’s more than twice the entire range of all UAH monthly data, I’m not sure what meaning you could attach to it.
Yeah, sure yer “skeptical”—when I posted my analysis of the UAH data, you bent over backward to discredit my work (at which you failed completely, BTW).
I disagreed with your “analysis” claiming the uncertainty of the monthly UAH data was at least ±3.0°C. That doesn’t mean I accept UAH as the best data.
It’s weird. I’m currently being attacked both for believing too much in UAH data and not believing in it enough.
Re-displaying your ignorance of real-world metrology.
And stop whining.
CM said: “Yeah, sure yer “skeptical”—when I posted my analysis of the UAH data, you bent over backward to discredit my work”
Your analysis claimed the uncertainty on UAH was 3.6 by taking the 4th root of the variance of the gridded data. This can easily be discredited via unit analysis. Remember the variance has units of K^2 so the 4th root of that is K^(1/2). I don’t know what a K^(1/2) is or means..
BTW…I’m not challenging your type A evaluation method here. If you had followed the procedure documented in your own source you would have taken the square root of the variance and divided it by the number of grid cells in the mesh. When you do that you get 0.13 C which interestingly is consistent with the type B method Christy et al. 2003 published of 0.10 C.
Just give it up, you aren’t fooling anyone, except yourself.
Only a complete idiot would use an existing trend to predict the future. Then again, there’s you.
Exactly my point.
Yet you say nothing when the IPCC predicts future calamity based on using trends.
Yes I checked all 4 of the recent threads. Crickets from you.
Your selective silence spouting disdain for those who reference trends is noted.
Do they? I thought they used more sophisticated climate models to project future warming, not simple linear trends.
“sophisticated”? hahahahaha
More sophisticated than projecting a linear trend a century into the future.
He, he, he: That is exactly what the CliSciFi models do.
And what makes you think they don’t end up with linear trends. Dr. Frank proved that they do regardless of the additional uncertainty conclusions.
That’s a category error. I said the models don;t predict the future by extrapolating the current trend 100 years forward. That doesn’t mean the models never end up as linear.
Your “sophisticated climate models” have been shown to be nothing much more than black boxes that take in CO2 concentrations and spit out a linear temperature trend. Get real.
DF said: “Your “sophisticated climate models” have been shown to be nothing much more than black boxes that take in CO2 concentrations and spit out a linear temperature trend.”
The Willet et al. 2019 model does not take either CO2 or T as an input but is still able to output them with reasonably good skill. It even explains the transition from 40k to 100k year glacial cycles.
Who cares?
Yep.
I care. I know people who are curious about the factors that modulate both CO2 and T on various timescales ranging from tens to millions of years care as well.
I don’t care.
If CO2 is not an input then in must be parameterized in order for the program to have any knowledge of it. Even Nick Stokes admitted that gas concentrations were input in order to start the model. Wanna bet that CO2 isn’t one of those gases? Also, if some parameter doesn’t drive the CO2 increase what does? Temperature maybe?
I had originally accepted your assertion but I did question how CO2 was handled, especially from a “0” start.
I did go through the study and guess what. It is built on models and it did manually modify CO2 concentrations in many ways. From the study:
Did you read the study at all?
Yes. I read the study. I paid particular attention to the prescribed volcanic and orbit forcing section before posting to make sure my understanding that CO2 was not given as an input was correct. I stand by statement. That is neither the actual CO2 nor T is given as an input. In fact, that very quote is one of the reasons I knew actual CO2 was not given as input to the model. That quote is saying that CO2 is internally modulated within the model via a prescribed level of volcanic activity. It is the same for the orbital forcing as well. You can see how volcanic emissions (in TmolC/yr) were prescribed in figure 1d. And you can actually see how well the model replicates the CO2 data in figure 2d. Notice that although there is reasonable skill over the whole period there are still substantial differences especially for periods older than 1 million years ago. Within 1 million years the red line tracks the black line pretty well. The 40k to 100k transition highlighted in the rectangle is a consequence of the evolution of the model.
What about “control the mean CO2 concentration in the model” is hard to understand?
Plus you didn’t answer my assertion:
Even a “modulated” CO2 level had to originate from somewhere. A computer program has no knowledge other than what is fed to it. The program did not all on its own, with no outside interference, say, “we need some CO2 to modulate”.
That’s right. The volcanic outgassing of CO2 is used to control the CO2 concentration. So is the regolith removal. The concentration is not used as in input to the model. Notice that the R3V2 scenario provides the best match to the actual CO2 data in addition to explaining the T and 18O data as well. That is what is novel about the model. It provides a good match to both CO2 and T without requiring either being used as inputs and spans 3 million years of Earth’s history. It means the modelers understanding of the carbon cycle and the way CO2 modulates T and T modulates CO2 was sufficient to explain the glacial cycles and the mid-Pleistocene transition given the prescription that volcanic emissions and regolith removal followed R3V2. The other scenarios provide lesser skill, but all required a decline in volcanic emission and regolith removal to provide that skill.
BTW…if you know of an alternative model that provides the same level of skill in matching CO2, T, and 18O data without using them as inputs I would obviously be interested in reviewing it.
You are beating around the bush. If there wasn’t a starting level of CO2, how did the program know to even include it.
Maybe you can convince yourself that the initial value of CO2 came out of nowhere. Otherwise, show where the initial concentration came from.
JG said: “If there wasn’t a starting level of CO2, how did the program know to even include it.”
There is a starting level of CO2. The terms initialization or analysis often used to describe a model’s starting conditions.
JG said: “Maybe you can convince yourself that the initial value of CO2 came out of nowhere. Otherwise, show where the initial concentration came from.”
Based on this comment I think there is some confusion or misunderstanding about what is being modeled in Willet et al. 2018. Willet et al. are not modeling the initial conditions. They are modeling how those initial conditions evolve through time. When I say CO2 and T are not inputs for their model I mean literally that. They are not inputs into the algorithm, equations, heuristics that evolve the initial conditions through time. That does not mean that the actual initial CO2 concentration, temperatures, and hundreds of other parameters are not provided as initial conditions to the model. This allows the model to make predictions based on any arbitrary set of initial conditions. An intuitive example would be (d/dt)v=F/m. Given the force and mass you can predict how the velocity of an object evolves with time. You have to initialize the model with F, m, and v prior to its use, but the model itself does not need any information regarding v to be able to output it as a prediction.
Exactly what do you think I said?
Me:
You:
Doonman said: “Yet you say nothing when the IPCC predicts future calamity based on using trends.”
Would you mind a link where the IPCC is predicting “future calamity”? I want to see what “future calamity” actually means.
I ask because it seems like there is a wide range of definitions in use on the WUWT blog regarding words like calamity, catastrophic, doomsday, etc. For example, a week or two ago asked people to define CAGW and I got answers ranging from the theory that predicts 3 C of warming to all human life will be extinguished in 50 years and even all human life will be extinguished by next week (I’m not kidding about that either).
So you don’t like WUWT—then why do you waste your time with it?
I like WUWT. I learn a lot through my participation. That doesn’t change the fact that there does not seem to be broad agreement on many words and phrases commonly used by commenters here. It’s hard to have conversations when each person has their own definition of CAGW, catastrophic, calamity, etc. And it is especially hard when they are resistant to define it at all.
Google broken for you again?
https://www.ipcc.ch/2022/02/28/pr-wgii-ar6/
“This report is a dire warning about the consequences of inaction,” said Hoesung Lee, Chair of the IPCC.
https://www.ipcc.ch/site/assets/uploads/2018/02/WGIIAR5-TS_FINAL.pdf
Technical details: (A, top panel) Map of observed annual mean temperature change from 1901–2012, derived from a linear trend.
I searched the link for “calamity” and found nothing. I went ahead and searched for “catastrophic” and found 2 hits. One was concerning “catastrophe bonds” which is just a standard financial instrument. The other was used in the context of “catastrophic changes” that might effect economic losses. The IPCC estimated that economic losses from 2 C of warming would be between 0.2 and 2.0% of income. It is important to note that the IPCC did not consider this catastrophic. So my question then is are defining a “calamity” as either 2 C of warming or 0.2-2.0% of economic losses?
If this temperature rise is not catastrophic, then why is spending tens of trillions of dollars to move away from an entirely satisfactory electric grid?
Does the word “existential” ring a bell? That word has been used to describe the effects of CO2 fueled temperature rise on the inhabitants of earth.
To me, that means the warming will be catastrophic.
Defense Secretary Calls Climate Change an Existential Threat > U.S. Department of Defense > Defense Department News
Climate Change, Health and Existential Risks to Civilization: A Comprehensive Review (1989–2013) (nih.gov)
Need I go on?
I see that you are eager at demonstrating your inability to think clearly yet again.
Saying that there has been a linear trend from 1979 till today is not saying anything at all about what is going to happen tomorrow, or the next year, much less the next 1000 years.
If you weren’t so determined to sell a disproven ideology you might be able to figure out such a simple thing for yourself.
And the point flies over your head again. It was, I think, Jim Gorman who suggested that as I’d mentioned a trend, I must be predicting what the temperature would be in 1000 years time.
This is what a linear trend does. It continually grows. It is up to you to show a limit to that growth. That means simple linear trends are not the whole story and other factors enter into the equation. Models usually can help with this, but if their output turns into linear outputs, which climate models do, they are not useful.
As I said before, you need to determine when your trend ceases to be useful in forecasting if you want people to believe your work. Otherwise, one can only assume that the growth goes on forever. Since temps can’t continually grow, when do they cease growing? Today, as UAH show? A year from now? A decade from now? In a century?
Even Fred250 understood you shouldn’t extend a trend line too far beyond the range of the data. Of course you could argue that as an equation it could be applied to any point in time, both in the past or future. But that doesn’t make it a forecast. Do you think I’m saying that the temperature was 27°C colder in 1AD?
Why do you not ask Dr Spencer why he’s projecting the trend of 0.13°C / decade into the far future? Why do you only have a problem when I quote a trend?
Because he only states what the trend is up to the latest data point and makes no representation that it will continue into the future. If you stop your trend and do the same I wont question it.
Spencer says:
“The linear warming trend since January, 1979 still stands at +0.13 C/decade (+0.12 C/decade over the global-averaged oceans, and +0.18 C/decade over global-averaged land).”
where is the statement that this is only up to the end of the data?
I said:
“Here’s UAH data over the same period, for land, north of 20°.
Trend is 0.28°C / decade.”
The “same period” is referring to the article, using February only data, from 1988 to 2022. My graph shows the trend line stopping at 2022. Where do I “make representations that it will continue into the future“?
Still waiting for the hockey stick 😉
You’re being disingenuous , Bellend. You know that the effect of CO2 on temperature is LOGARITHMIC. That means it will flatten out. Add that to the Milankovitch cycle effects and it will undoubtedly turn back down. No credible scientist is predicting that the trend will continue.
Again, in case it wasn’t clear, I’m being sarcastic, not disingenuous.
I’ve spent the last few sessions being attacked by people insisting that any mention of a trend was an implicit prediction that said trend would continue well into the future.
See here for example. In response to me pointing to a trend of 0.28°C / decade, Jim Gorman says:
And when I protest that I’m not making a prediction, just stating what’s happened in the past he says
Then in another article Carlo, Monte sez:
And Tim Gorman opines:
You certainly didn’t pay any attention to what I wrote,
As 99% of what you write is just context free taunts, I find it saves time to pay as little attention as possible to your comments. What is your specific beef this time? What did you want me to pay attention to?
More whining.
Says someone demanding I pay attention to everything he says.
Another fail, I never wrote anything of the sort.
It was YOU who dug up an old paragraph and paraded it about (interesting that you still remember it while I did not), and in the process demonstrated that you had not comprehended its meaning.
If you don’t want it considered an ever growing forecast, then you also need to show when it ceases to grow. Being an alarmist and insisting the temps by 2100 will kill us is part and parcel of this. Maybe you should at least become a warmist and insist that temps won’t rise as much as the models say.
However that would also make you a sceptic on how the GAT is growing also.
Why? I’m not a climate scientist. How much it will warm depends on a lot of factors, including how much CO2 will increase. Yet again, are you going to ask Dr Spencer when he predicts the warming will end? Are you going to ask Monckton when he thinks the pause will end?
Yet you have every published climastrology reference ready to go.
As for CMoB, perhaps you should read what he writes—with comprehension (I know its hard, but go for it!).
“Stop whining”. I don’t need every “climastrology” publication to make you look like a fool, you are quite capable of doing it yourself.
As for Lord Monckton, I’ve read far more of his nonsense to know the sort of person he is. Have you figured out what his “proof” of the Goldbach Conjecture means yet?
This hurts. Deeply.
You’ve proven, once again, why you’re a Bellend. The global temperature trend has sometimes continued fairly steadily over a period of a few decades, rarely longer than that. Never over a period of a 1000 years.
Protest as you might, but you know this and you are not only being disingenuous but you are choosing to be disingenuous, Bellend.
You’re calling me a bellend because I agree with you?
No, Bellend, because you post stuff that you know isn’t true.
Does anyone here really think they can predict the future of temperature using linear trends? It sure appears you that you do.
Here is something better for you to do. Determine what causes constantly rising CO2 to not cause constantly rising temperature. What trends can you find that would reduce or eliminate the effect of rising CO2.
“Does anyone here really think they can predict the future of temperature using linear trends? It sure appears you that you do.”
I don’t and I’ve repeatedly told you I don’t.
Your claim is that is anyone mentions a past trend they are making a prediction about the future. I’m asking do you think that applies to Dr Spencer saying the trend over the last 44 years is 0.13°C / decade?
Yet you post your T versus t charts again and again, as well as T versus CO2.
Just as Dr Roy Spencer does, just as Monckton does, just as all those cherry-picked NTZ articles claiming no warming in whatever country works that month.
I’ll keep explaining until you finally get it. If I post a chart showing what has happened in the past, it’s because I want to show what’s happened in the past. I mainly do this to counter misleading claims about what has happened in the past. If I compare temperatures with CO2 it’s to counter the claim that there is no correlation between temperatures and CO2. If I wanted to use the graphs to forecast the future I’d show the trend projected into the future.
Your agenda is exposed.
HTH
And you call me “bad at maths.”
Bellman, where is your comparison of the 21st Century CO2 trend to the 21st Century temperature trend? Would that graphic “… counter the claim that there is no correlation between temperatures and CO2.” you so ardently desire? Based on such a graph, could you assert that CO2 and temperatures are correlated?
Here for example, annual CO2 levels using a log scale correlated with annual UAH anomaly. Statistically significant correlation, but usual caveat that correlation does not imply causation.
Linear regression is 1.9°C per doubling of CO2.
Sources:
https://www.nsstc.uah.edu/data/msu/v6.0/tlt/uahncdc_lt_6.0.txt
https://www.esrl.noaa.gov/gmd/webdata/ccgg/trends/co2/co2_mm_mlo.txt
And as you asked specifically about the 21st century for some reason, here is just that half of the data.
Thanks for the info, Bellman. It shows that for the first 14 years of the 21st Century, there can be no possible correlation between CO2 and temperatures.
Yes, I’m sure if you look hard enough you can find periods where there’s a negative correlation, because other factors are causing temperature changes. That’s why it’s better to take the longer view.
I agree that a longer view is required for honest analyses. By ignoring the early 20th Century warming with no assist from CO2, I assert that CliSciFi is dishonest.
Thanks for the info, Bellman.
Bellman said: “Linear regression is 1.9°C per doubling of CO2.”
One thing I learned recently is that a linear regression can underestimate/overestimate trends when the x-axis has significant variance. This isn’t a problem when the x-axis is time since the linear regression of time itself is perfectly correlated. That’s not going to be the case with CO2. The standard technique for dealing with this is a Deming Regression. Based on the fact that Excel’s LINEST shows 1.9 C/log-2(CO2) and 0.25 log-2(CO2)/C of which the reciprocal is 4.0 C/log-2(CO2) leads me to believe that a Deming regression would result in a trend higher than 1.9 C/log-2(CO2). You can kind of see this visually in your chart by eye-balling the line through the 2nd to lowest and 2nd to highest dots on either end of the plot. Willis Eschenbach had a really good demonstration of this in a recent post.
Yes, I wondered about that, but I figured there’s very little variability in the annual CO2 data. In fact the main worry I have about the correlation, is that CO2 is virtually identical to time over the UAH time period. Anything increasing at a near linear rate will be correlated to CO2, which is why I stressed it not proving causation.
As I said, my main concern is to correct the claim that there’s no correlation between CO2 and temperature.
OK, I tried this in R, both using a Deming function and using PCA (both rather outside my experience) and I get a relationship of 2.98°C per doubling of CO2. I find this surprising and I’m not sure how much credence to give it.
Here’s my graph showing the difference, with the blue line being the standard OLS trend, and the red one being the orthogonal line using PCA.
It is interesting that the average of a linear regression with log-2(CO2) on the x-axis and then T on the x-axis provided a good approximation of the Deming regression. I wonder if that is true in general.
Anyway, according to the NOAA AGGI metric CO2 accounts for about 70% of the positive radiative force. And given that this kind of analysis would only apply to the transient climate response we might expect the equilibrium to be conservatively 1.2x higher. So 3 C per 2xCO2 * 1.2 * 0.7 = 2.5 C per 2xCO2.
It looks like the observation is consistent at least with the low end of the expected CO2 warming effect. And if using RSS instead of UAH it would be 3.6 * 1.2 * 0.7 = 3.0 C per 2xCO2 which is pretty close to the mid point of the expectation.
If one can’t prove causation, Bellman, why point out correlation? I believe it is simply an attempt to influence another person.
Both of these two persons refuse to recognize that temperature and Mauna Loa are time series functions—and that you can plot any two random monotonic time series against each other and get a “correlation”.
I refuse to recognize it apart from when I’ve pointed it out. As I keep saying, the point of showing the correlation is to refute the claim that there is no correlation.
But you cannot have it both ways. You cannot keep going on about how all the Monckton pauses show temperature is not increasing monotonically, and that it proves CO2 is is not causing the temperature rise, then say the only reason CO2 and temperatures are correlated is because temperatures are monotonically rising.
You still refuse to consider that you are in the domain of time series, yet I’m the one who is “bad at maths”.
I keep considering it. The fact that with have two time series neatly correlated with time, means that any correlation between the two might be spurious. As I keep saying the correlation is not proving that CO2 caused the temperature rise. On the other hand it is consistent with the hypothesis that rising CO2 will rise temperatures. What it also shows is that these so called pauses are not falsifying the hypothesis.
You can get a better idea of the fit if you look at a longer time frame, where neither CO2 nor temperatures were increasing linearly. Here’s NOAA temperature compared with CO2, with an OLS trend of 2.3°C per doubling of CO2.
Sources:
https://www.ncdc.noaa.gov/cag/global/time-series/globe/land_ocean/ann/1/1880-2022
https://www.esrl.noaa.gov/gmd/webdata/ccgg/trends/co2/co2_mm_mlo.txt
https://www.ncei.noaa.gov/pub/data/paleo/icecore/antarctica/law/law2006.txt
You never prove causation from statistics – hence the statement that correlation does not imply causation.
And what should we infer from these miniscule trends relative to “The Pack” of climate models?
It’s often nice to see both pauses together. Here’s a view not intended to show the pauses but intended to separate trends based on a PDO phase change.
https://woodfortrees.org/plot/uah6/from:1997/to/plot/uah6/from:1997/to:2014/trend/plot/uah6/from:2015/to/trend
Now what in the world could a step function like that? Maybe this?
A big drop in cloud’ refection of solar energy at the precise timing the PDO changed to its warm phase. Some might find that informative yet all the trolls will ignore it.
Of course, if it really was increased solar energy warming the Earth, then what happened all the claimed greenhouse gas forcing over the last 25 years?
How do you get over 7 years of pause?
If it is monthly observations of anomaly, isn’t the area under the curve the warming?
It is my understanding that Monckton starts with the most recent month and iterates backwards one month at a time until he finds a period where the linear regression trend (LINEST in Excel) says <= 0.
He doesn’t. If he did that he’s stop as soon as he found a negative trend. What he does is look back until he’s found the earliest <= 0 trend.
I think what confuses people with the “he works backward” claim, is that they assume he stops as soon as he finds the first positive trend. But in reality he then continues in case it returns to the negative.
For example the trend since April 2018 was negative, from March 2018 it was positive. I think people here think that means his pause should start in April 2018. But he carries on, finds the trend from October 2017 was negative, and carries on until he gets to September 2014 which is positive. This sets the start of the pause as October 2014, the earliest start date for a negative trend, but to know this for certain you would have to keep going back to ensure there isn’t an earlier negative start date.
Here is why you whine so much about CMoB’s posts: he exposes how your claims that CO2 causes these “trends” are bogus. So much so that you (and bzx) have to go on and on and on and on about whether it is < 0 or <= 0 or whatever.
Oh…I see what you’re saying. Thanks!
When will they join?
When will what join?
I’ve seen people eager to belief that anytime now, the new Monckton pause will merge with the old one, and we will have one glorious pause stretching back to just before the 1998 spike. And I keep having to tell them that short of a major catastrophe it just isn’t going to happen – at least not any time in the foreseeable future.
And you know this … how exactly?
I don’t know it exactly. I just don’t see any plausible scenario for it to happen given the current data.
For example, let’s say the temperature remained as it is indefinitely at 0°C. After 5 years the Monckton pause starts in 2009, and the trend since the start of the previous Monckton pause is around 0.4°C / decade. It would need to continue for 16 years at 0°C before the pause reached 1997.
So what if it dropped back to 1981-2010 levels, around -0.15°C. Then it would take 5 years to get the start back to 1997.
If you want the joining to happen in the near future, say within the next two years, temperatures would need to be around -0.5°C for that entire period. This would be colder than any similar period in the UAH history.
So you ARE making predictions.
No.
I will make the prediction that you are incapable of learning and will keep failing to understand the difference between making a prediction and exploring a scenario.
Well, Bellman, the earlier pause was about 2 decades; what’s to say this one won’t continue for another 16 years from its present level? Never say never.
So you are forecasting more growth in temperatures. When will that cease?
I suspect there will be more warming, that doesn’t mean I’m forecasting it on the assumption that the current trend will continue indefinitely. And in the comment you’re referencing I’m explicitly assuming temperatures will drop and remain could for years.
I am expecting the 2020’s temperature to be higher than 2010’s. The warming will cease when then planetary energy imbalance drops to zero or goes negative.
“I am expecting the 2020’s temperature to be higher than 2010’s.”
The temperatures seem to be going in the opposite direction. They are cooling.
You could have said the same thing in 2012. Temperatures were plummeting after the very warm 2010.
Average anomaly from 2010 – February 2012 was 0.01°C. From 2020 – February 2022 it’s 0.23°C.
Dean Wormer comes to mind . . .
Todays average global temperature is about the same as the beginning of the satellite record. For example, 1980 has about the same temperature when plotted with the 1990 to 2020 average. That’s 42 years of data.
Plenty of other indicators of global climate, such as global rainfall show the same, no significant change. Other indicators, such as polar bear numbers, show the same.
Good quality surface stations such as the south pole station, shows no change since records began in 1958.
Actual sea level records show no change in trends for a century.
1880s photos of sea shore monuments, shipping piers, etc. show no significant increase compared to photos taken today.
Agriculture planting season and harvest times in temperate regions show no significant climate change since records began.
The average anomaly in 1980 was -0.18°C. The average anomaly over the last 12 months was +0.11°C. The warmest month by anomaly in 1980 was -0.05°C, this is the same as the coldest month in the last 7 years.
Check it out, bellcurveman can look up numbers from a table.
Which is more than many here can do.
Evidence?
The post I was responding to for one.
So UAH is The Final Word for such observations?
Well I assumed that was what bwegher was referring to, given that this is an article about UAH, and he talked about the start of the satellite era. If you prefer we could look at RSS or any of the surface data sets.
Poor Bellman, he’s reduced to schoolyard taunts. At least he knows his limits.
I responded to a taunt in kind. I’m sorry.
You really don’t know what a trend is, do you?
Where did I mention a trend? I responded to a claim that today’s temperature is the same as 1980. I pointed out the figures don’t suggest this is true. I made no mention of what happened in between.
So 42 years ago global guesstimated temperature was ‘anomaly +0.1’ degrees ( +/- at least 0.2 degrees) and now it’s ‘anomaly +0.2’ degrees( +/- at least 0.2 degrees). In other words, “stuff all change”.
Sorry got the dates back the front. So, it was -0.2 degrees (+/- 0.2) 41 yrs ago vs 0.1 degrees (+/- 0.2 degrees) in 2021 – so still “stuff all” difference. Why is it climate scientists don’t believe in measurement error?
Because they are totally ignorant about the subject (c.f. bellman), and because it invalidates their claims of CO2-driven atmospheric heating.
One specific year, one of the warmest at the time had an anomaly of -0.2°C, compared to one month, an unusually cold one, of 0.0°C. I make no claims about the uncertainties of these figures, I just don’t see the evidence that temperatures are now the same as they were 40 years ago. You cannot look at just the warmest peak 40 years ago and the coldest point today.
Really?
Learn what the word means—oh wait, people have tried to help you out, all in vain.
What word?
Exactly, it is completely outside of your reference frame.
You quoted a lot of words and then told me to learn what the word meant. How do I do that if I don;t know what specific word you want me to learn?
NEE!
Of course scientists believe in measurement error. All the reputable data sets have calculated uncertainty, it’s just the measurement error is less important than all the other sources of uncertainty.
Some here seem to believe that if they can cast sufficient doubt as to the uncertainty of the figures, they can can claim that therefore we cannot be sure if any warming has taking place. I think that is dubious given the multiple sources of evidence for warming – satellites, surface temperatures and weather balloons, for example. It’s a huge coincidence to assume that all of the measurement errors in all of these sources conspired to produce simultaneous warming trends.
Moreover, uncertainty is not the argument they like to think. Not knowing how fast the planet is warming isn’t an argument for inaction.
You should just quit now, while you’re behind. It’s not working for you.
” For example, 1980 has about the same temperature when plotted with the 1990 to 2020 average. That’s 42 years of data. ”
Sorry, but… this is wrong.
You can’t simply draw a line on a graph and say, if the line is flat: no change.
*
” Actual sea level records show no change in trends for a century. ”
UAH’s trend for Dec 1978 – Feb 2022 is very low compared to other observations; but it is currently swinging between 0.13 and 0.14 C per decade.
Means 1.3 C / century.
And the quadratic factor inside of the time series shows an even higher trend, leading to an increase of 1.9 C / century.
Nothing to get scared about; but to ignore it is incompetent.
*
” Good quality surface stations such as the south pole station, shows no change since records began in 1958. ”
Now, you switch to utter nonsense.
How can you compare the Globe with a station located within the continent showing not only the lowest temperatures, but also the lowest trend increases on Earth?
”” Good quality surface stations such as the south pole station, shows no change since records began in 1958. ”
”Now, you switch to utter nonsense.”
The GAT (lower trop) is TODAY (Feb 2022) what it was in 1958. 64 years. More than 2 so-called ”climate data points”. As of today, no net global warming for that period, therefore no climate change for that period. Only weather changes now and then. Yes that’s right, you are afraid of the weather.
But I thought the poles were supposed to be warming fastest?
“Means 1.3 C / century.”
Assuming temperatures continue this trend for 100 years.
Do you think this trend will continue for the next 100 years?
No. Go back and look at the temperature reconstructions for the past 1000 years. They go up for a while and come back down for a while. Why are we now in a different regime? If you think CO2 is it, you really need to go look at spectrum absorption in the atmosphere of CO2 as it goes up. It becomes less and less of a factor. It’s the Sun that effects how warm it is here on Earth, and the Sun cycles through phases over time which in a lot of cases are close to or exceed human lifetimes. 50 years is nothing.
I think you have me confused with an alarmist, rb.
I was asking Bindidon if he thought the current trend would go for 100 years. I wasn’t claiming I believed it would. I don’t.
Is CO2 not well mixed? Does CO2 not cause warming from back radiation? Is Polar Amplification not true as GHG theory says? Are the poles not supposed to show the most warming? Be careful about what you criticize.
Fair point, but Antarctica is almost completely free of UHI, and aren’t the poles supposed to be warming faster than the rest of the globe, making the changes more obvious? Certainly every melting snowflake in the North garners headlines.
Know it is off topic, just read a report that the felicity ace sank while being towed. Hope another thread is started.
Putin is aiming to encircle Kiev to destroy it by bombarding it with rockets district by district. A city of four million people will be turned into rubble for no reason. The number of casualties will be enormous and the failure of Western world policy will be enormous.
You are off topic, but this time I exceptionally agree to what you write. 101 %!
Putin has to get his convoy moving before he can surround Kiev. He appears to be having a difficult time doing so.
Putin is sending a message to the next country he invades. Surrender, or be destroyed.
Or maybe not. Now what was the CIA and Obama doing in Ukraine 😉
I would love to know what Obama and Biden did in Ukraine. Perhaps a Republican-controlled Congress will look into it.
Nothing Obama and Biden did justifies Putin’s attack on the innocent people of Ukraine. Pretending Ukraine is a physical threat to Russia, as Putin does, is absurd.
Tom I don’t pretend to know the ins and outs of Ukraine and Russia history, but I do know that the globalist are against Putin which gives me pause to everything is bad about Russia. America is extremely good at propaganda.
It’s fairly certain Obama and Biden don’t want the public to find out, which is why there wasn’t any real effort to negotiate a peaceful settlement, e.g., an independent and neutral (no NATO) Ukraine.
I had assumed that Georgia (2008) would be the model, now it looks more like Grozny (1999/2000). A reminder that most of the world is still nasty, are we in the West that far behind?
Wow. It is like, dude, when you apply actual, real world, data they are lying.
This 0.0 C anomaly is nothing to wonder about.
1) We are still in La Niña mode, what means that the LT temperatures are influenced by the ENSO level some 5 months ago.
2) This anomaly is a departure from the 30 Februaries of 1991-2020.
If UAH still was using 1981-2010 as reference period, the anomaly would be 0.16 C.
And if they still were using 1979-1998 like still does RSS, the anomaly would be 0.27 C.
Are those numbers from some calculations you did or are you just using the grossly modified version of RSS?
la nina, meaning cold? and the graph changes based on reference line? yeah didn’t think so either.
When will it warm up?
I am waiting. The snow is still piled up here.
Does that sound like a cycle to you? Up and down. Maybe not unceasing growth.
It looks like very nearly 34 years without any warming to me. Perhaps that is because I have not been drinking my Kool-Aid.
I’m not a scientist, but is it just me or does the trend line look close to flat since about 1996?
Yep. And if realistic error bars were displayed on the graph it is even more apparent.
nuts. i just came to find out how long the new pause is.
Historical Ice Animation: NOAA Great Lakes Environmental Research Laboratory – Ann Arbor, MI, USA
not sure why they are slow to add 2021 data. oh, because it came in at 46%. and we just hit 63% for 2022. we’re all toast i tell ya.
when Superior starts freezing over, it’s been a cold winter there.
Anyone know of any recent surveys of the high quality land temperature measurements that are outside of urban heat island effects? I remember years ago when Anthony Watts was doing the survey there were some charts on those that showed most flat and many declining.
How does that line up with this showing such an increase in the last 10 years on average for the satellites? I would like to see this increase in some rural high quality siting measurements.
The best reference temperature is not on land. Tropical ocean surface temperatures only have small variation so these are a good reference for checking satellite measurements.
This link has the correlation;ation between UAH and ERSST from NOAA for the Nino34 region:
http://climexp.knmi.nl/data/itlt_60_-170–120E_-5-5N_ncorr20112.png
The UAH gives best correlation with 2 month lag. Regression coefficient ranges from 0.4 in July to 0.9 in January.
The UAH measurement has a slight upward trend, which could be a CO2 signature because the measurement is taken from emissions near freezing temperature in the troposphere. The NINO34 region has a slight downward trend over the past 40 years.
Thanks!
After 40 years of Global Warming, the temperature is the same it was back in 1982.
This gives the green light for Germans to go full coal without fear of catastrophic warming.
Imagine how cold the Earth would be if China was not doing such a good job of restoring the CO2 levels to those more consistent with abundant life.
CO2 levels necessary for abundant carbon-based life on a green planet. The fraction of a fraction anthropogenic input helps, a little.
RickWill said: “After 40 years of Global Warming, the temperature is the same it was back in 1982.”
The 1982 annual average anomaly was -0.42 C.
The last 12 months ending 2022/02 is +0.11 C.
The 2022/02 is anomaly is 0.00 C.
Yes, that statement is clearly incorrect. RickWill should have stated: “After 40 years of global warming, the slope of increasing global temperature is the same as it was back in 1982.”
The key point being that despite a very large increase in mankind’s CO2 emissions over the interval of 1982 thru 2021, such emissions have had apparently zero effect on the rate of global warming.
Drawing an inference from this key point is not at all difficult . . .
I think you mistake anomalies for temperatures, they are not. At best, disregarding their accuracy, they are growth rates. What your statement says is that the growth rate has diminished. It has done so in the face of ever increasing CO2 in the atmosphere. This should give one pause about CO2 being a control knob.
I fully expect to start seeing alarmists claiming that reduced CO2 emissions from humans has limited temp growth. However, they will be hung on their own petard by the current “accurate” measurements of CO2.
Wow. I don’t recall seeing a 0.00 before. What do you guys think? Is a 6 year declining trend good enough to disprove the greenhouse gas warming trend? Or is it not enough? Either way all of the data sets agree on the declining trend including the surface temperature sets.
Separate question: I was reading a few comments down below about people disagreeing on the general trend (Bellman) and I wanted to ask about a 1.9 C increase. Is this increase a noticeable trend. In otherwords, take a city with an average winter temperature of 33.3 degrees, what would this change to? Would it be a radical change?
Thanks,
Walter
La Niña will survive until November, and then it will strengthen. Third winter in a row in the northern hemisphere.
Temperature in Australia will remain below average.
Good question. Can you go outside and tell the temperature (without looking) within 1.9C? Can most people? My guess is that not many people could. Then you need to ask yourself is it high daytime temps or higher nighttime temps raising the average? You might be surprised.
Is there any wind blowing?
What’s the RH?
“Wow. I don’t recall seeing a 0.00 before. What do you guys think? Is a 6 year declining trend good enough to disprove the greenhouse gas warming trend?”
Not quite, but it’s headed that way. About another decade of cooling ought to have the alarmists on their heels.
Due to a very slow but nonetheless increase in solar wind strength, easterly winds along the equatorial Pacific will persist.
https://www.longpaddock.qld.gov.au/soi/
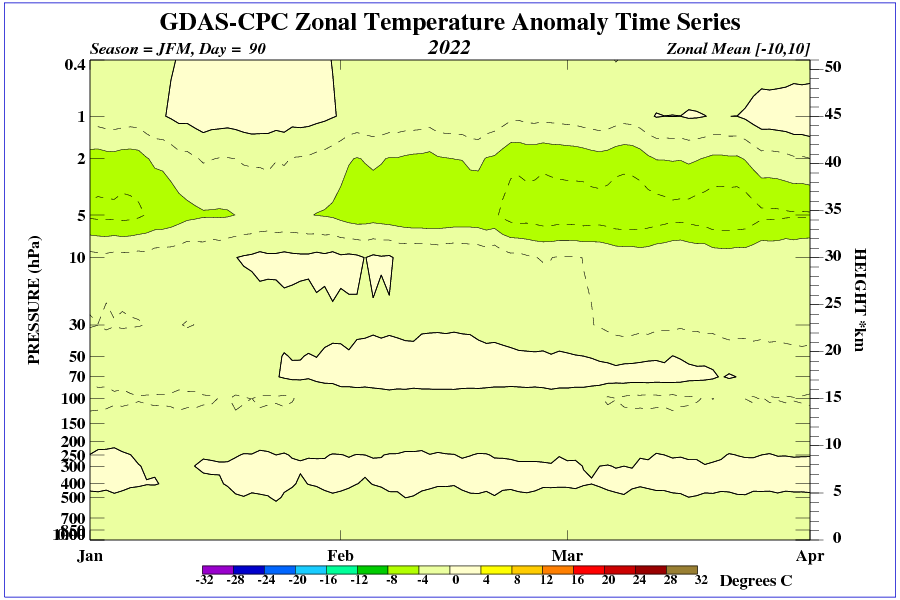
We’re waiting for spring in the northern hemisphere and here’s a sudden SSW in the central stratosphere with record low temperatures in the tropopause.
Increased sea ice extent in the Northern Hemisphere in February.
Does the tropopause circulation foretell the end of winter in North America?
The end of February foretells the end of winter.
You can see better in this animation. See that the low is moving toward the Bering Strait. This will cause air masses to slide in from north to south in North America.
http://tropic.ssec.wisc.edu/real-time/mtpw2/product.php?color_type=tpw_nrl_colors&prod=alaska×pan=24hrs&anim=html5
Does the circulation over Europe portend spring? Not so fast.
https://i.ibb.co/vkBPDQ9/hgt300-1.webp
Continued low levels of UV radiation in the 25th solar cycle.
meaningless multiply adjusted figures, out of step with comparable measurements
Wrong.
Seeing as how the UAH satellite data and the Weather Balloon data correlate closely, one would have to say UAH is the most accurate of all the data sets.
I see griff has given up trying to make sense.
Speak for yourself !
For “lower troposphere satellite (MSU) measurements” the only “comparable” dataset to UAH (V6) is RSS (V4).
You can see for yourself below exactly how “out of step” they are …
RSS: Cool the past, warm the present.
That’s Michael Mann’s and Phil Jones’ mantra.
Right on! The (manipulated) data is there for all to see.
griff,
Did you forget? The dosage was to be two Prozac daily, but only one-half a tablet of Benzedrine.
Australia rainfall forecast.
http://www.bom.gov.au/fwo/IDYPME04/20220302_20220309/pme1to8.png