Reposted from NOT A LOT OF PEOPLE KNOW THAT
By Paul Homewood
Is climate change making winter floods getting worse in England?
This is a question that is often posed. There are many reasons why river levels may be reaching higher levels than in the past, including the concreting over of upstream drainage areas and flood defences which often simply transfer the problem downstream.
But is rainfall now more extreme? There is no evidence of this in monthly or daily totals. But often the key factor in fluvial flooding is the accumulation of rain over a period of time, rather than one big storm.
The European Climate Assessment & Dataset (ECA&D) provides some good tools for analysing rainfall data, in particular the Highest 5-Day Rainfall total for each year.
I have used this to analyse rainfall during the winter-half year, October to March, for most of the long running stations in England.


https://www.ecad.eu/indicesextremes/customquerytimeseriesplots.php
Trends are either flat or even decreasing.
Good analysis and posting by Paul Homewood. However, his data appears to be un-tortured, and we need to wait for the “adjustments” to appear. Or maybe no CAGW fanatic will see it? griff? I’m sure the chart on the lead-in will cause him/her/it to look away.
It is his usual misrepresentation and cherry picking. A blind man should be able to see that the UK is wetter and there are more floods.
Clunk!
I spy with my little eye
…. a mental disorder beginning with A
Poor ickle gwiffy. Are we the only people who will talk to you?
Well, Griff, the data say the “more floods” aren’t caused by increased precipitation. What is causing “more floods?” Can you quantify “more floods?” How much “more?”
Climate is doing what it has always done.
But some people who call themselves “progressives” want everything they can’t control to stay the same. They call themselves “left” and always want to be “right”, no wonder they are confused.
Yet people build everything they can think of in the way of the water and then proceed to not maintain the drainage.
Most lawyers even (or is that being too kind to that profession) will be able to tell you what happens when you block the drain and empty 10 x 5 gallon buckets of water in a 2 gallon capacity kitchen sink.
Unless there has been an increase of blind people drowning in England, then I doubt they have noticed.
A Blind Melon can see that there’s been No Rain in N. California so far this year.
https://www.youtube.com/watch?v=Q-ksvuBiy9k
If you need a 30 second music fix, listen from about 1:35 on. Have volume turned up to 11.
Thanks to Toyota for reminding me. This Super Bowl ad had more music in it than the entire half-time show.
https://www.youtube.com/watch?v=osAtAgxOMag
Michael Jackson would have been less boring and he’s dead.
A cardboard cutout of “Michael Jackson would have been less boring and he’s dead.”
if a pickpocket meets a saint he only sees his pockets
You’re talking weapons grade rubbish Griff
Rainfall UK annual
Yeah, but according to the grifter that rain is wetter.
So, CO2 increase causes draughts and we have always been at war with Oceana.
Beside the total rainfall volume, there is also set of data from Radcliffe observatory which shows monthly number of hours it rained. You might think it is irrelevant, you may be right, but shows some interesting information.
Low pass filter shows that every 40 years there is a burst of rise in the rainfall hours, but this is regularly punctured by another strong periodicity of about 7.5 years.
Where the ‘40 years’ comes from I have no idea but it looks it has nothing to do with the AMO.
‘7.5 years’ apparently is related to the lunar tides and is one of the prominent components in the variability of the earth’s magnetic field generated in the planets liquid outer core.
If it’s lunar, does that make Stonehenge a rain gauge? But I thought the metonic cycle was 19 years, 7.5 years doesn’t seem to fit .
How does ~40 or ~7.5 years relate to Stonehenge?
for 7.5 years see
https://youtu.be/1SOSmHPTods?t=1407
start at 23’20”
Stonehenge as Rainy Years Calendar
(as in blue spectrum line : my comment below)
thank you. That place seems to have more meaning every year. It also the culture that built must have been around for far longer than we know. To calculate all the information it shows means they had to study the weather and the sky for quite a long time.
The moon however does not rise and set over 360 degrees, so i think your graphic needs a little work =)
It might be direct result in small changes in the Earth’s magnetic field (see links), which may or may not be caused by moon alone if at all.
see also
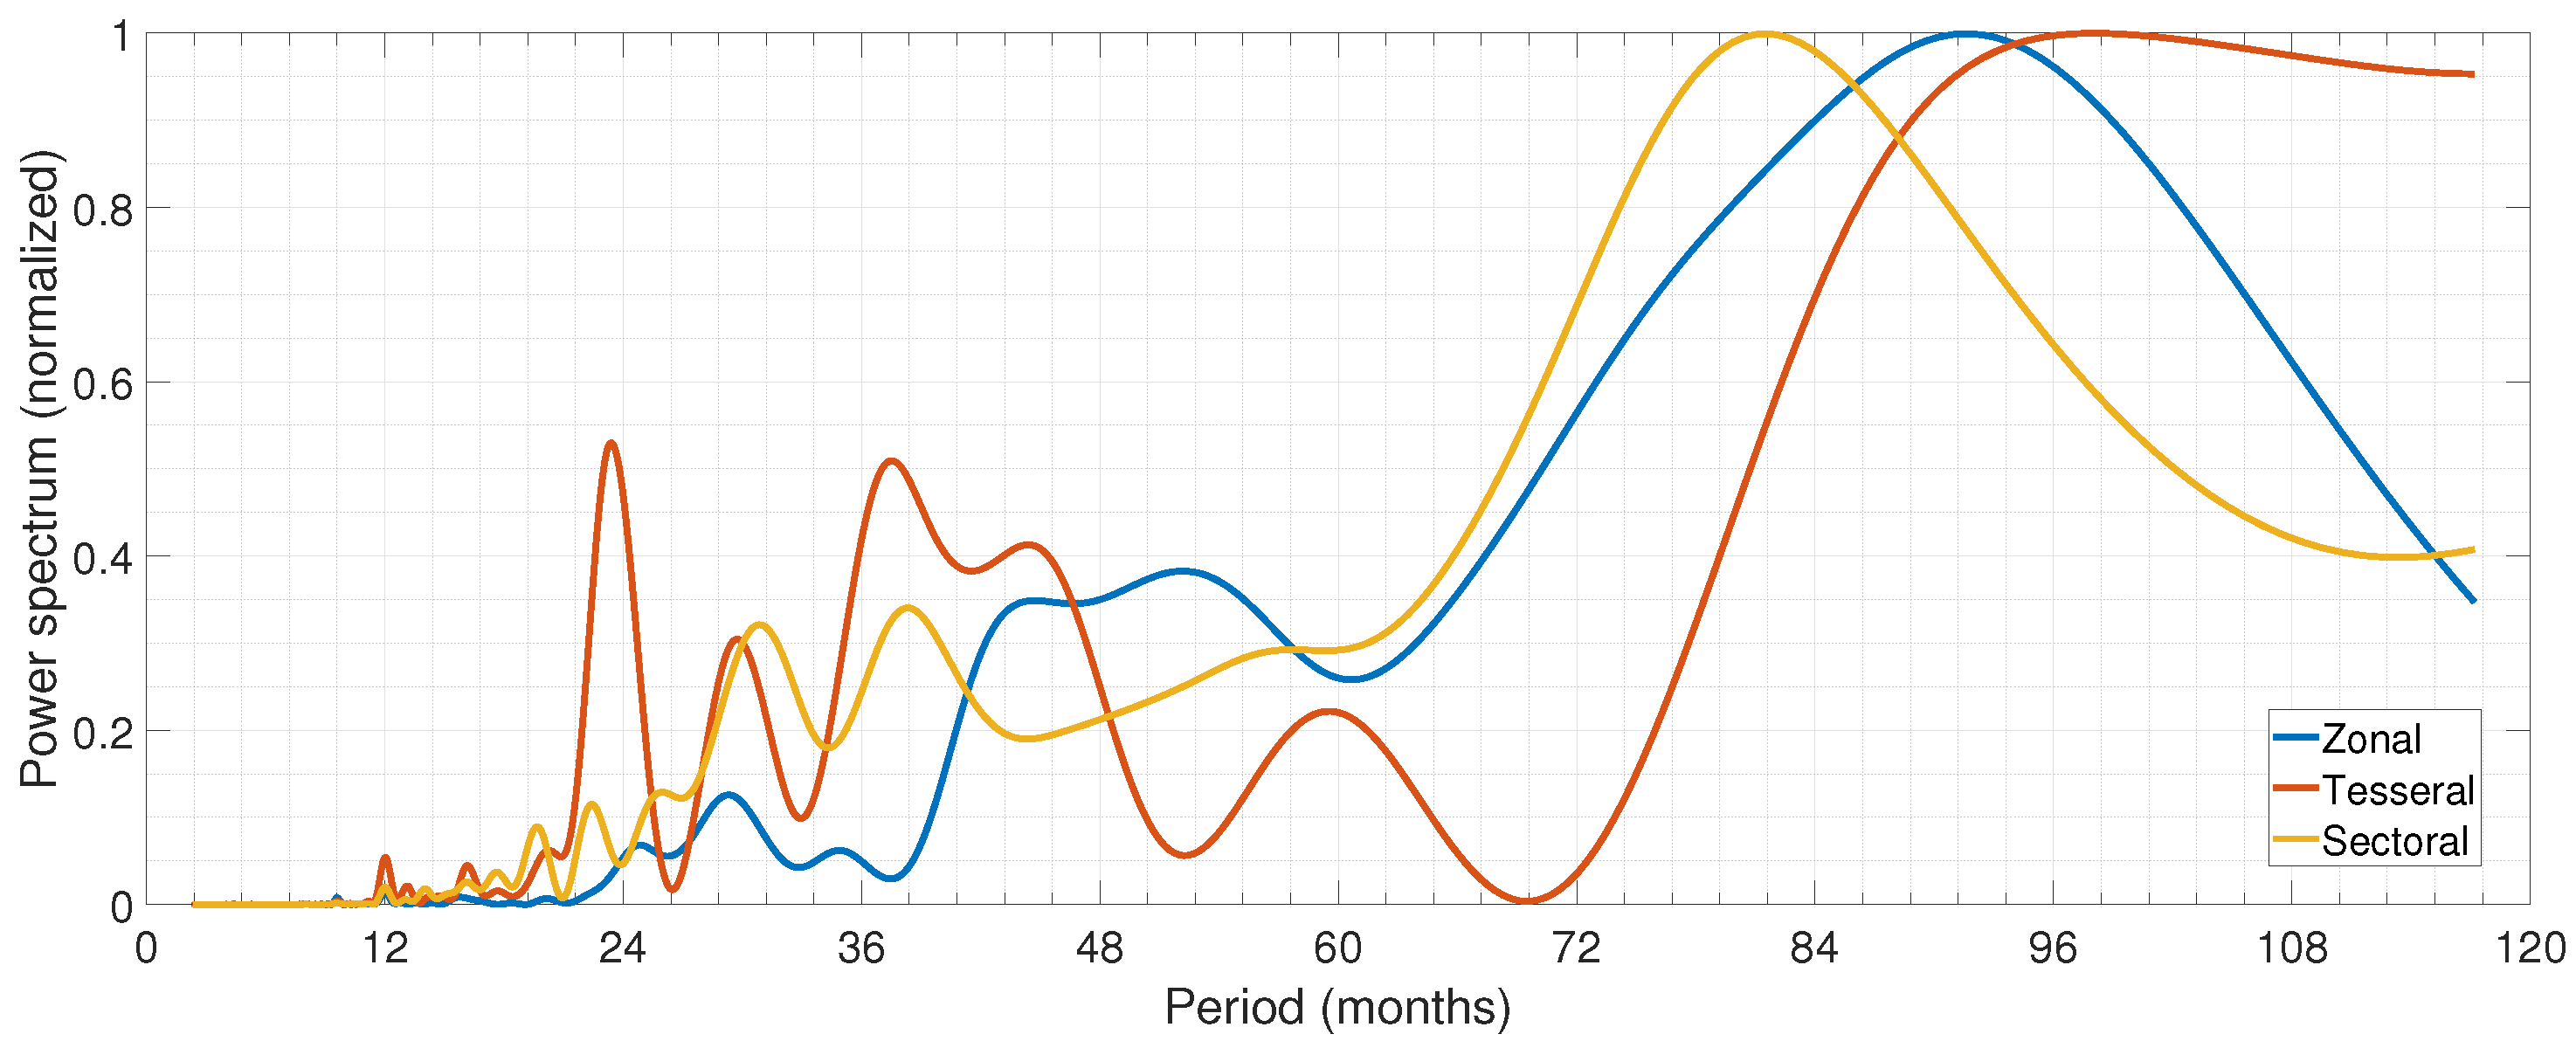
90/12 (months) = 7.5 years (blue line)
https://www.mdpi.com/1424-8220/21/22/7555/htm
As a reasonably frequent visitor to Britain – which I really enjoy doing – its always raining!
Then you must be visiting the wrong parts of Britain !!! Try the South…….
In March 1983 l returned to the UK from a 3 year stay in NORWAY It was said to be the wettest spring ever and all were moaning I pointed out that in this green and pleasant land it very seldom rains all day even when the storms, that only started 5 years ago according to the Met Office, strike. In Bergen it can start to rain in October and continue until February with no intermission. Typical moaning Brits and typical failure to invest in flood control
Rain before seven,
Dry by eleven.
Old countryman saying.
That is why I enjoy that classic “A Song of the Weather” by Flanders and Swann.
griff claims that the Met office told him that UK rain is now 6% wetter, ergo.. something?
Lucky for us the Met would would NEVER EVER play politics with data. So. There can be no doubt that the UK is 6% wetter. However the MET defines “wetter” in their favor. Which they would never do.
😬
Wrong sort of rain then
Only works for spherical raindrops in a vacuum (for some values of wet).
Nothing to do with the rain, just that it’s 6% wetter. I blame crying millennials for the increase in moisture!
Heh.
Ripping Yarns was a TV Series written by Michael Palin and Terry Jones between Monty Python gigs.
The episode “The Testing of Eric Olthwaite (1977) had as its plot:
Nice Yorkshire accent. It rained in ‘eckmondwike. Climate Climate.
The series with one of my all-time favorite lines ever as Palin’s character escaped from the public boarding school:
“I was seventeen miles from Graybridge when I was caught by the school leopard.”
” … UK rain is now 6% wetter … ”
… meaning climate change reduced the amount of dry rain?
Enough of this hydrophobia….
The UK got 100% ‘wetter’ as a result of being in the EU…
Yeah but then he was claiming there are increased droughts.
He pretty much claims whatever is happening in the world is caused by Climate Change.
CC is making rain wetter ? is it making all water wetter ?
and I have once again cited the evidence in a post here today. Because it is.
Was that the evidence that a blind man was supposed to be able to see?
C’mon man – you’ve never heard of Braille rain ??
The Thames River has the best historic rainfall and river flow data of all rivers in the world, yet it can still not be flood modelled.
This is because:-
The catchment imperviousness is always changing.
The river channel is always changing.
It never rains the same way.
Unknown volume of snow melt always contributes to major floods.
It is my understanding that most critical factor in the flooding of the Thames is amount of evaporation leading up to a storm event.
Low rainfall and warm summer/autumn allow considerable volumes of winter rains to be stored in the catchments chalk soils, thus reducing the peak flows of any major winter storms.
The River Severn has suffered some of the more severe flooding of the past few days here in the UK. It has a long history of flooding ,however:-
In 1607 many hundreds drowned in a flood between Gloucester and the river’s estuary.
In 1770 (February), following a quick thawing of 2 months of snow over its course in both Wales and England, many bridges were swept away, including 16 in Shropshire alone.
In 1818 it flooded 5 times
In 1847 the river rose 18feet in 5 hours
In 1947 it suffered one of the highest ever recorded floods for the river.
Smaller but still major floods occurred in 1965, 1968, 1981, 1989,1990
The effects of flooding along the river are accentuated by the large tidal estuary and the fact that towns such as Worcester closer to that estuary have expanded greatly onto the flood plain in the last 40 years.
1947 would have been due to snow-melt after the unusually heavy falls that year…
And oldie (maybe a goodie) from the Norfolk Annals on Project Gutenburg:
https://www.gutenberg.org/files/34439/34439-h/34439-h.htm
https://wattsupwiththat.com/2019/03/04/climategate-continues-the-mann-hockeystick-university-of-arizona-emails-are-now-public/#comment-2650406
WTF does extreme rainfall mean???
Paul Homewood fairly uses 5 day rainfall, but why not 1/2hour, 1 hour or 24 hour?
Each location generally has one critical “time of concentration” with many locations having more than one.
If alarmists try to link increases in rainfall to increase in floods they must be specific for each and every catchment.
“WTF does extreme rainfall mean???”
It really rained and I got wet.
Select rainfall here:
https://www.metoffice.gov.uk/research/climate/maps-and-data/uk-climate-extremes/
It looks like the UK was rainy in 2009 and 2015. Were the next three closest years all in the 21st Century? Earlier? How early? Informing people is a much different process than trying to convince them. A free society is the difference.
Monthly and annual for England and Wales here, Novembers 1770, 1852, 1929, and 1940 were wetter than November 2009:
https://www.metoffice.gov.uk/hadobs/hadukp/data/monthly/HadEWP_monthly_qc.txt
Standard test methods used to evaluate building envelope resistance to water penetration – simulation of severe wind driven rain – use a water spray rate equivalent to 8 inches/hour (200 mm/h). This is based on extremes actually measured although higher rain rates do occur for intervals of a few minutes especially during hurricanes.
In reality, extreme rain falls rarely exceed 3-4 inches per hour and these high rates aren’t usually sustained for more than 15-30 minutes.
Rick
Agreed, but this is building design.
In tropic zones buildings are usually designed for peak hour of intense rain.
In non tropics buildings are usually designed for peak 6 minute rain. As a storm crosses the city there may be an intense few minutes of rain even if the storm doesn’t have a high hourly rate.
I apologise for not making it clear.
The time of concentration, is the time water flows from the extreme point of the catchment overland then along the channel to the point of interest.
The peak rainfall in this time usually relates to the peak flow.
Here in Melbourne Australia, the city is located on the confluence of the Yarra and Maribyrnong Rivers.
The Yarra River has a time of concentration 36hours plus.
The Maribyrnong River has a time of concentration 15 hours.
So what is the critical storm duration of interest for Melbourne?
It’s not an extreme event for 36 hours or 15 hours.
It’s multiple combinations – something like a large event in the Yarra catchment followed by a large event 24 hours later in the Maribyrnong catchment, with both peaks reaching downstream at the same time.
In the case of Melbourne peak 5 day rain has no significant impact on the city.
All cities of the world have there own critical storm scenario.
Any storm front crossing Western Europe will have different impacts on different cities.
This is very important when considering the IPCC states that parts of Western Europe will have more droughts and more extreme rainfall.
Their studies and propaganda are either about droughts or extreme rainfall.
They don’t provide studies to show a region is impacted by droughts AND extreme rainfall. If some cities in the region are impacted by 12 hour storms and other by 5 day storms then you must be specific.
I have not read a single study that shows the multiple cities within a region will get more droughts and floods. It’s make believe.
I didn’t see anything alarming in those charts.
Griff will be so disappointed.
Don’t worry, he/she/it is a very inventive individual.
“UK Winter Extreme Rainfall” seems to be extremely constant and frequent…
Cities like London are continually developing and the covered area – brick, cement, paving increases as does the runoff into the storm drain system. That’s what a fixation on curbing emissions, insulation and heat pumps can lead to.
Rainfall hasn’t really changed, but the built environment has.
Planning Authorities all over the country are forever granting permission for housing developments on flood plains. There is little common sense anymore.
I am not sure that flood plains/dry land fall within the purlieu of the Planning Authorities.
It is more likely to be building control…
True story. A few years back, during a very heavy summer rain event, the roadside storm drains were overwhelmed in my village. This led to localised flooding of a few nearby houses and a torrent of water forming into a small, temporary river flowing through my back garden and down into the Ancholme Valley. The Local Authority, and some longstanding residents said that the frequency of these events had definitely increased over the previous 20 years or so and that climate change was to blame.
Nobody, including the Local Authority, knew where the drains went – they had lost the charts years ago. I took it upon myself to investigate further and with spade in hand, found that the main storm drain (about two and half feet diameter) ran directly underneath a 50ft willow tree in my back garden. The Local Authority then turned up and smashed the drain pipe to find at least the first 20 yards of it completely chock full of willow roots.
They re-routed the drain around the willow and there hasn’t been problem since – well except for the huge willow crashing over dead about two years later. The Local Authority said the tree collapsing was just coincidence…
Absolutely correct, along with massive changes to urban environments in the UK as people have replaced hedges with fencing and covered their drives for additional parking and lower maintenance. Although all of these things have a major impact on storm water and wildlife,the establishment blob — especially the likes of the BBC — ignore this and blame it all on climate change.
The irony is that environmental measures, such as reduced river dredging, have made the problem much worse while councils have cut back on drain maintenance, not least because they were told there’d be less rain “because of climate change”.
On top of that people judge what’s happened on their own lifetime experiences, which is understandable but wrong given the timescales of climate change. You really couldn’t make it up.
Obviously the old rainfall amounts are “biased” and need to be “adjusted”.
G’Day MarkW2,
“…reduced river dredging…”
Was a directive from the EU. “To keep the environment ‘natural’.” So Britain stopped a long-used practice.
Unfortunately, the folks most affected will wait for ‘the government’ to do it. Thinking about it, just might be a good investment for insurance companies.
Is climate change making winter floods getting worse in England?
“Get” worse maybe? still sounds a bit Daily Express.
The DailyGetsMuchWorser than the Worsest Thing There Never Was.
Just lose “getting”.
Floods were reportedly caused by farmers changing to row based crops like maize from barley or wheat. Of course these were summer floods.
I think you’ll find that barley and wheat are planted in rows nowadays. I think they use seed-drills rather than random scattering.
The wettest winters have nothing to do with ‘climate change’. December 1876 and January 1877 were wetter in total than with the Jan-Feb 2014 floods. Because of a combination of short term low indirect solar, and a warm blob in the northeast Pacific.
https://craigm350.wordpress.com/2014/03/18/the-great-global-weirding-of-18767/
CAGW is now causing desertification in the UK–will be the conclusion of the alarmists.
I keep saying this again and again to people who live near me… This is England and we are stuck in the middle of the Atlantic, it’s always going to rain…so don’t buy a house that floods… 2+2=4 people (most times)
Perhaps you should change the title from UK to England since that is where your data is from. Completely ignores the areas where the most rain falls in the UK such as Wales.
Isn’t it the trend that’s key to the argument ?
Unless you think that global warming would lead ONLY to increased rain in Wales.
I would assert that a general increase in rainfall would be observed in any of the river gauges – accepting that perhaps one may be too small a small a sample due to local changes; but that many data sets all showing the same thing seems pretty convincing to me.
No doubt people cleverer than me can torture the data to make it reveal a wetter truth…
Once weather systems hav e passed over Wales there’s less left to fall on England. Why else would Birmingham have built the Elan Valley reservoirs all those years ago?
Sure
But if AGW puts more water in the clouds then more will get over the hills
ITs only logic
Why only the winter half? Does it not rain in summer in the UK (I am not familiar with UK weather)? I understand that the charts are a response to the original question of winter flooding, but why was that question posed?
Of course it is and the Met Office data bears that out…
the UK has become wetter over the last few decades, although with significant annual variation. 2011-2020 was 9% wetter than 1961-1990.
The change in rainfall depends on location – for example, Scotland has experienced the greatest increase in rainfall, while most southern and eastern areas of England have experienced the least change. From the start of the observational record in 1862, six of the ten wettest years across the UK have occurred since 1998.
The number of days where rainfall totals exceed 95% and 99% of the 1961-1990 average have increased in the last decade, as have rainfall events exceeding 50 mm. Both these trends point to an increase in frequency and intensity of rainfall across the UK.
UK and Global extreme events – Heavy rainfall and floods – Met Office
And from this 2021 report
Climate change continues to be evident across UK – Met Office
As well as increased temperatures, the UK has been on average 6% wetter over the last 30 years (1991-2020) than the preceding 30 years (1961-1990). Six of the ten wettest years for the UK in a series from 1862 have occurred since 1998.
2020 was the first year that the annual values for rainfall, temperature and sunshine were all in the top ten in the same year. 2020 was third warmest, fifth wettest and eighth sunniest on record for the UK.
Other notable weather extremes from 2020 include 8 further named storms (in addition to Ciara and Dennis), the UK’s third warmest day on record with 37.8°C recorded at Heathrow on 31 July, the southern England heatwave in August, extreme rain fall in Norfolk on 16th August and exceptionally heavy widespread rainfall on 3 October making this the UK’s wettest day on record.
Be sure to look at this for the chart showing rainfall changes!
and as to floods, only a fool would attempt to make light of the near annual severe floods and flash floods in the UK since 2000. Multiple new flood records have been set and then broken: some areas have flooded 2 or 3 times in that period, while not having flooded in the previous century.
a useful exercise is to search online for ‘UK floods wiki NNNN’ where NNNN is a year since 2000.You’ll find a litany of flood events in the headline articles resulting.
Global temperature increase of 1C since the Little Ice Age should increase Total Precipitable water in the atmosphere by 7%, thus increasing rainfall by roughly 7%….but 7% is well within the -70%/+300% variation in rainfall that most places on the planet experience annually, so difficult to discern.
Flooding events reported by media, are almost entirely the result of human beings failure to build adequate dikes and eliminate rainfall retention ponds in locations that Mother Nature intended to be flood plains….in other words, not CC but real estate greed….
AMO
griff, re UK and Global extreme events
On BBC Radio 4 The World at One on 17th Feb, Liz Bentley, C E of the UK Royal Meteorological Society said
“If you look back over the last, say, 50 years or so there isn’t a compelling trend that we’ve seen in the amount of storms we get in the UK”
“We’re not seeing any significant changes or trends within the number of storms or maximum wind gusts over the last five decades”
What do you make of the charts in the article Griff? If the case was so clear, why doesn’t it show up at these stations?
It seems as if global warming effects are again, everywhere except where the best measuring stations are.
“2011-2020 was 9% wetter than 1961-1990.” A recent 10-year period compared to a prior cherrypicked 30-year period. Sure. Figures don’t lie, but liars can figure.
” The change in rainfall depends on location – for example, Scotland has experienced the greatest increase in rainfall, while most southern and eastern areas of England have experienced the least change.” Is it Scotland that has experienced increased flooding recently? Or has it been southern and eastern areas of England?
Again, the Met Office is trying to convince people, not to fully inform a free people.
Griffy – as long as you continue to use Wikipedia and the heavily biased met office to support your spurious claims, all will continue to regard you as a delusional moron. Floods and heavy rains have been a feature of the UK since forever – if you read the accounts of Roman soldiers forced to serve here, away from the sunny Mediterranean, you’ll appreciate the history of British weather a little more. From 55CE right the way through to today there has been little variation – deal with it.
warmer , sunnier and abundant water . and you complain ! would you prefer colder , greyer , drier ?
…. what answer would you expect from walking freakshows who have wet dreams about white cops shooting unarmed black people.
It’s been several years since I last checked, say about 7-8 years, but when I looked, the rainfall chart for England & Wales over the last 150 years, strangely & mysteriously showed that some years were drier than others, & some years were wetter than others, however when averaged, it was a perfect flatline over that time frame!!! Perhaps the UK Wet Office has a new crystal ball to replace its puter modul!!! It’d be just as effective!!! I wonder if they call their puter Hal??? Didn’t work out too well for the crew around the last puter with that name!!! I also wonder if said puter asks, “Hey guys/gals/ what kind of scary story do you want me to output today???
yes there are more floods,but from the same amount of rain.
You know where I’m going here….
We could start with the River Severn, flooding at this very moment.
But it is towns, villages and houses that are centuries old that are being flooded.
Contrary to the opinion of Climate Scientists, projecting politicians and other trolls, folks are not stupid and would not have put their settlements where they’d regularly get flooded
River Severn is the perfect example.
Q: Why?
A: Because its drains most of North Wales.
Wales is a mountainous place and is very effectively over-run by sheep. What sheep have done, are doing, is eating everything right down to the roots and exposing already thin soil to the effects of sun wind and rain.
Because everyone in the UK expects Cheap Food, the farmers are forced to keep many more sheep than even they know they should.
The overall effect is that The Severn turns into a storm-drain with even modest amounts of rain. Water that would have been absorbed on the hillsides now simply pours off the hills like water off the roof of your house.
The same amount of water flows but it goes down the river inside 24 hours whereas previously, when all those villages and houses were built, that same volume of water would have taken 3 or 4 days to drain away
Cumbria, my old place, is similarly affected.
Its called Soil Erosion
All the sheep are doing really, is leaving bare soil exposed to the sun – exactly what ploughs, tillage and Roundup do
But once some rain arrives, that soil turns to a liquid slurry and races away downhill.
All farm fields and land with a slope of greater than 4 or 5 degrees is affected and is why all contemporay flood water is, typically, brown in colour.
It placed every previous attempt by humans at settled civilisation on an Extinction Trajectory and we are on that exact same path.
Because that brown stuff is not only our food supply, it is all the trace elements and micro nutrients that our physical & mental health depends upon..
Fat people are not healthy, in any way shape or form. Easily 50% of global population is now diabetic, chronically chemically depressed and almost all are seriously deficient in at least one major nutrient.
Typical Magnesium, Zinc and/or Iodine
Or the B Vitamins, especially B12 = the one that controls your mental health.
Its single most important source, the one we evolved to use, being fertile high-organic soil.
Explains a lot doncha think..
Actually it’s Mid-Wales. Also the sheep have been there for centuries. Removal of the original oak and ash woods and replacing them with commercial evergreen woods (e.g. Teme valley in the 40s) changed the drainage and led to more rapid flooding. Llyn Clywedog was built in the headwaters of the Severn as a flood control reservoir in the 60s as a result.
G’Day Peta,
And when that silt laden water hits the flat ground, it slows, drops the silt, thus raising the river bed. Dredging was the old-fashioned way to keep rivers in their beds rather than overflowing.
Amazing what happens when you have raw data without adjustments.
I’ve left comments on more advanced statistical analyses for data, however, this in true in general.
We have said before that in the climate change agenda there’s no explicit discussion nor acceptance that the statistical behavior of nature over large periods of time (decades, centuries, millennia) shows natural variability: natural changes of the physico-chemical equilibriums of nature. These changes appear hidden behind the rigorous scientific methods of measurements and formulations.
This is not the “common sense” that people think when they assume that in the climate change issue the logical way to accept is what they believe is true because “they can see it”. This is the UNCOMMON SENSE of science hiding the truth, the one that you can’t see, most likely the answer that you least expected. Nature always hides a surprise when you think that you’ve figured it out.
This a short article of someone working on statistical data fit of flooding information in the UK. As you can read, floods are caused by a complex mechanism of natural activity. It is worthy to remind that natural variability causes changes such as an area totally arid for ages, to totally flooded during other ages. Totally normal behavior of the earth.
If climate change driving extreme storms was actually an obvious present issue, even the simple plots on this article should show evidence. However, this small study doesn’t show any increase in flooding, but actually flat (equal) and lower. It is a good thing that it fails, because this kind of studies disqualify the exaggerated/unfounded/un-evidenced predictions of impending destruction, catastrophe, extinction.
JBVigo, PhD
I’ve left comments before in other posts about more rigorous statistical methods of analyses. However, this is true in general:
We have said before that in the climate change agenda there’s no explicit discussion nor acceptance that the statistical behavior of nature over large periods of time (decades, centuries, millennia) shows natural variability: natural changes of the physico-chemical equilibriums of nature. These changes appear hidden behind the rigorous scientific methods of measurements and formulations.
This is not the “common sense” that people think when they assume that in the climate change issue the logical way to accept is what they believe is true because “they can see it”. This is the UNCOMMON SENSE of science hiding the truth, the one that you can’t see, most likely the answer that you least expected. Nature always hides a surprise when you think that you’ve figured it out.
This a short article of someone working on statistical data fit of flooding information in the UK. As you can read, floods are caused by a complex mechanism of natural activity. It is worthy to remind that natural variability causes changes such as an area totally arid for ages, to totally flooded during other ages. Totally normal behavior of the earth.
If climate change driving extreme storms was actually an obvious present issue, even the simple plots on this article should show evidence. However, this small study doesn’t show any increase in flooding, but actually flat (equal) and lower. It is a good thing that it fails, because this kind of studies disqualify the exaggerated/unfounded/un-evidenced predictions of impending destruction, catastrophe, extinction.
JBVigo, PhD
My hypothesis: CO2 clogs the pores in dirt and causes flooding in the UK. Send $$$$ and I will generate a computer model that says it’s so.
Is it me or is there something periodic going on here? Something like 20 to 40 years?
Mann said it’s volcanoes
Just need to find them