Guest essay by Eric Worrall
An international team of scientists, including Dr. Willie Soon, has produced a solar model which does a skilful job of reproducing past climate shifts such as the Little Ice Age and Medieval Warm Period.
The abstract of the study;
Role of the Radiation Factor in Global Climatic Events of the Late Holocene
V. M. Fedorov 📧, D. M. Frolov 📧 Faculty of Geography, Moscow State University, Moscow, 119991 Russia
V. M. N. Velasco Herrera 📧 Instituto de Geofisica, Universidad Nacional Autónoma de México, Mexico, 04510 México
W. W.-H. Soon 📧 Harvard and Smithsonian Center for Astrophysics, Division of Solar, Stellar, and Planetary Sciences, Cambridge, 02138 USA d Institute of Earth Physics and Space Science, Sopron, 9400 Hungary
R. G. Cionco 📧 Universidad Tecnológica Nacional, Grupo de Estudios Ambientales, Buenos Aires, 2900 ArgentinaReceived April 30, 2021; revised July 16, 2021; accepted July 19, 2021
Abstract—On the basis of calculations of insolation and insolation characteristics, taking into account changes in solar activity, the causes of global climatic events in the late Holocene have been determined. The main reasons for the Little Ice Age (LIA) are the long and deep minimum of summer insolation and insolation seasonality (IS) in the Northern Hemisphere. The values of the minimums are fixed in the range of approximately 1400–1750. The depth of the minimum over the past 5000 years, taking into account the change in solar activity, is about 8.0 W/m2 for summer insolation and about 13.3 W/m2 for IS in the Northern Hemisphere. The medieval climatic optimum is associated with the winter maximum of insolation contrast (IC) in the Northern Hemisphere, reflecting an increase in the meridional heat transfer in the winter half of the year from the equatorial region to the polar regions, as well as with a maximum of interhemispheric heat transfer. The increase in winter IC at maximum (1118) relative to 3000 BC is 28.4 W/m2. The difference between the hemispheric radiative heat transfer at the maximums (881, 940, and 976) increases by 5.0 W/m2 relative to 3000 BC. Thus, global events of the late Holocene are associated with extremes of insolation characteristics (incoming radiation, IC, and IS of the Earth), but the temporal structure of the extrema themselves is determined by variations in solar activity. It follows from the above that, when reconstructing and predicting global climatic events, it is important to take into account not only variations in the incoming radiation, but also the associated changes in insolation characteristics (IC and IS of the Earth), reflecting the mechanisms of heat transfer. The IC regulates the meridional transfer of radiation heat; its cause is a change in the tilt of the axis and precession. The IS of the Earth determines the intensity of interhemispheric heat transfer. The noted characteristics of insolation, reflecting not only variations in the arrival of solar radiation, but also variations in the mechanisms of heat transfer, are not taken into account in the general astronomical theory of climate. Taking these indicators into account will help obtain more complete information about climate changes in past eras and will allow the more accurate forecasting of the future climate.
Read more: https://link.springer.com/article/10.1134/S0001433821100030
It will be fascinating to see how this new paper is received.
In a normal field of science, a model which works would generate a lot of excitement. But as Willis recently pointed out, there seems to be a shocking level of complacency amongst many climate scientists when it comes to model quality.
Well, what a surprise !!!
“I see nothing. I hear nothing, I know nothing.”
The climate modelers creed. With emphasis on the last trait.
I used the link to read the abstract. Rest is paywalled. But from the abstract, I am doubtful this ‘skill’ isn’t mostly contrived. There are four reasons:
The Milankovitch mechanism is hardly in doubt [and not by me], but the rest of the paper is invalidated by using outdated [twenty year old] reconstructions of intrinsic solar activity variation.
How can the sun POSSIBLY influence the temperature? Thats a right wing conspiracy.
Who remembers “It’s the sun. Stupid!”? I mean, I’m not a climate scientist(happily), but I can read, I can think. I understand what .04% means, in any metric. Just drop it, it’s all about to fall apart anyway! I give it less than 12 months, then reality returns, along with sanity, and real democracy.
Hi Leif.
Regards.
Bob
DUH!!!!! What f**king moron does not know the big, flaming ball of hydrogen is the primary driver of climactic change effecting all the bodies orbiting it?
Von Neumann’s elephant
https://aapt.scitation.org/doi/pdf/10.1119/1.3254017
Angels dancing on the head of a pin.
“It will be fascinating to see how this new paper is received.”,
My guess is badly. It is appalling written to the extent that whole sentences are repeated. For instance on the bottom of page 1242 it states:
“Between 1780 and 1820, the air temperature in the North Atlantic was about 1–3°C lower than at present. It is known that forests in Central Europe, especially in mountainous areas, have been severely degraded since 1500.”
then in the middle of the next column on page 1243 the same sentence appears:
“Between 1780 and 1820, the air tem-perature in the North Atlantic was about 1–3°C colder than it is today. It is known that the forests in Central Europe, especially in the mountainous regions, have been severely degraded since 1500.”
If the authors can’t even be bothered to proof read their article why should anybody else bother reading it? It hardly inspires any confidence in their work.
At worst, this hypothesis leads us down another blind alley following models of anthropogenic carbon dioxide forced global warming that are plausible but inconsistent with recorded observations and climate changes.
What a worthless paper!
The MWP was warm because of a dearth of volcanic eruptions (only 31 in 300 years)
The temperature decreases of the LIA precisely match the SO2 aerosol injections into the stratosphere from known volcanic eruptions, with NO climatic effect from solar minimums.
The Little Ice Age, a series of longer than average duration centennial solar minima, each with periods of increased negative North Atlantic Oscillation conditions, bringing increased cold weather anomalies to e.g. northwest Europe. Interspersed by decades of warmer to hot weather in Europe, the latter like in the late 1300’s, the 1530’s and much of the 1610’s to mid 1660’s, accompanied by strong cooling in Greenland.
The Maunder minimum, an increase in El Nino conditions and a warmer AMO, but with increased Arctic air incursions to the mid latitude continents (negative AO/NAO). The warmers SST’s would actually reduce low cloud cover, increasing the shortwave forcing, so the global temperature should rise rather than fall.
Solar Forcing of Regional Climate Change During the Maunder Minimum:
“Modeled surface temperature changes show alternating warm oceans and cold continents at NH mid-latitudes”
https://www.researchgate.net/publication/11616609_Solar_Forcing_of_Regional_Climate_Change_During_the_Maunder_Minimum
The Dalton minimum, the bulk of the colder years in CET were 1807-1817, seven of those years had no aurora observations. Page 11:
SECULAR VARIATION OF THE AURORA FOR THE PAST 500 YEARS
https://citeseerx.ist.psu.edu/viewdoc/download?doi=10.1.1.641.5823&rep=rep1&type=pdf
The impact of the solar minimum is clear in this image, which shows the temperature difference between 1680, a year at the center of the Maunder Minimum, and 1780, a year of normal solar activity, as calculated by a general circulation model. Deep blue across eastern and central North America and northern Eurasia illustrates where the drop in temperature was the greatest. Nearly all other land areas were also cooler in 1680, as indicated by the varying shades of blue. The few regions that appear to have been warmer in 1680 are Alaska and the eastern Pacific Ocean (left), the North Atlantic Ocean south of Greenland (left of center), and north of Iceland (top center).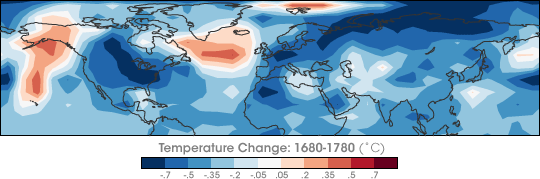
https://earthobservatory.nasa.gov/images/7122/chilly-temperatures-during-the-maunder-minimum
I’ve been saying for the past 15 years that we’re heading into an extended cold phase, probably of Dalton Minimum intensity. I’m so confident of my prediction that I sold my house near Sacramento, CA and moved to a couple of acres in South Texas, a little west of San Antonio.
And I’m stocking up.
Here in the British Isles we already have evidence that over the last 1m years the islands have been occupied and abandoned at least nine times. During that million years the climate was ever changing as was weather, sea level, and nature as a whole at many different levels and in many different ways.
It would seem to be constructive to know why and how our historical climate moved from one extreme to another extreme if only to demonstrate that our ancestral responses were intelligent and based upon the experience and knowledge of the time, unlike the muddled and confused thinking we are currently observing among our so called expert ranks facing a couple of degrees of extra warming over a multiple centuries.
Dunno what the model says. But the observational evidence for this is well known and best communicated by Prof Weiss to the Schiller Institute.
The work is well supported by the very close correlation of the detected frequencies in the proxy observations of temperature cycles with well defined frequenies at 1Ka, 500a, 200a and 60a.
On further research to seeka source of these frequencies in a natural causeme, the authors found the solar wind variability defined by the cosmogenic radionuclide formation rate on Earth, well studied nd reported by Steinholberm, Scafetta, etc, that solar wind cycles are havebeen shown to control.
The actual cloud nucleation effects of cosmic ray showers on are well discussed in the literature, well reported by the Svensmarks and Nir Shaviv, and the correlation too tight for comfort.
Having models whose assumptions better match reality is a good thing. Better than models with dodgy assumptions that are not supported by the physics and don’t predict the future. Because its assumptions are stuffed with unsupportable attribution errors and lack of any consideration of solar wind effects, geothermal effects, proper consideration of cloud feedback, as the GCM’s do.
It is important for anyone who is not clear on this to realise that the UN IPCC models depnd on the assumption that all change for the last 2,000 years in cased by humans, no change is natural. If that assumption is proven to be wrong, because most observed change is natural, there is no anomalous change for AGW to account for, and their guesses are self evidently wrong on the observations. Ludecke and Weiss showed this years ago now.
https://schillerinstitute.com/media/carl-otto-weiss-le-changement-climatique-est-du-a-des-cycles-naturels/
They found three key frequencies, well 4 including the well known 60 year cycle, in the proxy temperature records, and NO monotonic signals as would ov ccur with human change, always rising, so all natural cycles and no detectable AGW.
Re convolving the frequencies predicts cooling from around now on the compound effect of the detected cycles, as would also be natural on the observed time series record.. The frequencies found matched the cosmogenic isotope formation rate maximums almost perfectly. If there is anyone here who has not seen and read this fundamental work regarding short term millennial scale cycles, as well seen in the ice core record at both poles, better watch the 20 min master class, and read the supporting papers.
Models can be wrong, they are the product of the guesses of their creators. Evidence derived directly from the observations of nature much less so, they are the only test of any scientific theory. Even if some people prefer their beliefs and models, only observations are real. I this case it seems the authors have created a model which is much closer to the observations than the CMIP/GCM guesses. Because the guesses are founded in recent science, not 80’s GCM models programmed with political presumptions as to an AGW cause of observed change, not to determine what causes the observed change. Modern science knows better, and should respects the evidence of nature over the guesses of modellers. The problem is no longer what causes change, and how little of net observed change is human, which is certainly undetectable within error bands.
The problem remains as communicating the truth of observation based deterministic science to the people who are being deceived by the IPCC models for other reasons than saving the planet from natural climate change. Per theUN OPCC, to transfer wealth and prosperity from West to East, in the IPCC’s public statements of intent, and the objectives of Agenda 21.
Ludecke and Weiss covering paper is here. Enjoy some deterministic/empirical/natural reality. What we can see, not what people make up. Contains NO models.
DOI: 10.2174/1874282301711010044
But its nice that models can be created by Soon et al to demonstrate a credible solar cause of the short term climate cycles of 1Ka period, 2 deg range and typical rate of change ((i.e. when changing) of 0.8 deg per century, as are self evident in the ice core records w/o all the fancy science………….. so again, there is nothing anomalous in the change of climate for AGW to account for. BUT note that the recent paper is concerned only with insolation effects of solar activity, as also reported by Steinhilber er al and referenced by the authors , but apparently chooses to ignore any effects of solar winds on cosmic rays hence cloud formation rates in their philosophy.
And finally,
A tIme series of 4 superimposed Interglacials by James Covington from the referenced sources. Spot the short term cycles in every event …… it’s really not hard to see the truth from the natural record we now have at decent resolution, and the GCM modellers didn’t but were exposed by it when it became known. so they now have to deny to make their claims, that are overtly wrong as a result. How long can they keep this up? While the money keeps comimg?
No kidding! The sun plays a role in the earth’s temperature – really?
While I have very high respect for Dr. Soon (I don’t know the history of the other co-authors of the scientific paper summarized above), I ran off the rails upon reading this statement in the above abstract:
The 2016 WUWT article available at https://wattsupwiththat.com/2016/09/29/earths-obliquity-and-temperature-over-the-last-20000-years/ presents a “cartoon” graphic by Javier demonstrating only a very week link of global temperature with obliquity and shows that in the last 5000 years, Earth’s obliquity has only changed by 0.58° due to precession of Earth’s spin axis (consistent with Laskar [1986] calculation).
The difference in the cosine of 24.00° versus the cosine of 23.42° is 0.45%. If this change is applied to a solar insolation value of 342 W/m^2 (averaged over Earth’s surface), I get a delta value of only 1.5 W/m^2 variation over the last 5000 years.
Thus the Earth’s variation in obliquity (Soon et.al.’s “IC”) must be a relatively small part of the total W/m^2 variations mentioned in the above abstract. That then means the “variation in solar activity” and the “insolation seasonality (IS) in the Northern Hemisphere” must be the predominate cause of century scale climate shifts. I will need to read the full paper to understand how this can be so.
This seems to be really useful new insight. But I did not understand the basis of the cycles. I can understand that seasonal (i.e. annual) insolation cycles could well interact with astronomical cycles such as precession. But the main precession cycle is 26 thousand years, and seasonal tilt cycles once every year (of course). Also there is obliquity (41 thousand years) and apsidal (112 thousand). What astronomical cycles have the right period to match the timescale of the medieval warm period and little ice age?
In five days, another wave of Arctic air will sweep over the western US.
I thought it was very Interesting paper, If anyone wants the pdf its here:
https://drive.google.com/file/d/1D11lGGYOrHdlyGwDMO49SVxz4HnVTrp1/view?usp=sharing
Annual average surface temperature change (C) due to solar irradiance change between the Maunder Minimum (late 17th century) and a century later, when solar output had returned to relatively large values, in the climate model (top) and in the historical temperature reconstructions (bottom).
https://www.giss.nasa.gov/research/briefs/2002_shindell_06/
Winter in North America is not going to end anytime soon. Look at the circulation.
http://tropic.ssec.wisc.edu/real-time/mtpw2/product.php?color_type=tpw_nrl_colors&prod=namer×pan=24hrs&anim=html5