From Dr. Roy Spencer’s Weather Blog
February 2nd, 2022 by Roy W. Spencer, Ph. D.
The Version 6.0 global average lower tropospheric temperature (LT) anomaly for January, 2022 was +0.03 deg. C, down from the December, 2021 value of +0.21 deg. C.

The linear warming trend since January, 1979 now stands at +0.13 C/decade (+0.12 C/decade over the global-averaged oceans, and +0.18 C/decade over global-averaged land).
Various regional LT departures from the 30-year (1991-2020) average for the last 13 months are:
YEAR MO GLOBE NHEM. SHEM. TROPIC USA48 ARCTIC AUST
2021 01  0.12  0.34 -0.09 -0.08  0.36  0.50 -0.52
2021 02  0.20  0.32  0.08 -0.14 -0.65  0.07 -0.27
2021 03 -0.01  0.13 -0.14 -0.29  0.59 -0.78 -0.79
2021 04 -0.05  0.05 -0.15 -0.28 -0.02  0.02  0.29
2021 05  0.08  0.14  0.03  0.06 -0.41 -0.04  0.02
2021 06 -0.01  0.31 -0.32 -0.14  1.44  0.63 -0.76
2021 07  0.20  0.33  0.07  0.13  0.58  0.43  0.80
2021 08  0.17  0.27  0.08  0.07  0.33  0.83 -0.02
2021 09  0.25  0.18  0.33  0.09  0.67  0.02  0.37
2021 10  0.37  0.46  0.27  0.33  0.84  0.63  0.06
2021 11  0.08  0.11  0.06  0.14  0.50 -0.42 -0.29
2021 12  0.21  0.27  0.15  0.03  1.63  0.01 -0.06
2022 01  0.03  0.06  0.00 -0.24 -0.13  0.68  0.09
The full UAH Global Temperature Report, along with the LT global gridpoint anomaly image for January, 2022 should be available within the next several days here.
The global and regional monthly anomalies for the various atmospheric layers we monitor should be available in the next few days at the following locations:
Lower Troposphere: http://vortex.nsstc.uah.edu/data/msu/v6.0/tlt/uahncdc_lt_6.0.txt
Mid-Troposphere: http://vortex.nsstc.uah.edu/data/msu/v6.0/tmt/uahncdc_mt_6.0.txt
Tropopause: http://vortex.nsstc.uah.edu/data/msu/v6.0/ttp/uahncdc_tp_6.0.txt
Lower Stratosphere: http://vortex.nsstc.uah.edu/data/msu/v6.0/tls/uahncdc_ls_6.0.txt
We’re all going to die. Yawn
You beat me to it, Greg61. Though I would’ve begun with Oh no +0.03 deg C to reinforce the absurdity.
Regards,
Bob
We’re all going to die because over the last 24 years we’ve had .. 1/10th of a degree of warming.
The 2017 peak is 1/10th of a degree higher than the 1998 peak. And the 13-month avg in 2017 is just ~ .06 degrees hotter than ’98.
At some point they’ve got to fish or cut bait, or whatever the saying is, because their constant out of control high-pitched fear-mongering is getting obviously ridiculous.
It’s much more frightening than that, as I’ve said before, the average globul temperature has risen a massive, terrifying, unprecedented, 1.1 degree over the last 150 years, making that a staggering 1/7000th of a degree Celcius per year on year!!! We’re all doomed!!! 😉
Alan
Remind me again when the little ice age ended.
The number is 0.007 degrees C/year which is 1/136th not 1/7000.
Does not matter they have a voice and you don’t
The attacks on UAH data and methods should begin in earnest in a few days with Biden and Kerry in agreement with lots of press coverage. Special teams of climate communicators are being activated at this moment.
Have we reached 12 o’clock on the doomsday clock yet as these matchsticks under the eyelids are getting a tad uncomfortable and I’m getting lockjaw.
The clock is on pause during the Biden years dispite war in Europe and Asia.
Hmmm… lower than 1988 when it all started. Interesting.
As warm as the 20s?
It was warmer when Julius Caesar got stabbed in the back. The climate was real nice back then
That’s clever of you Derg. I didn’t know Dr Spencer’s UAH work went back to the 20’s.
The 0.03C is not absolute, not based on 100yrs ago but is relative to a recent warm period of 1990-2020. UAH reports a trend of <0.14C (previous months) & >0.13C/10yrs (this month) over ~43yrs = ~0.57C which does appear to be significant.
If we are in the bottom of a cycle, the current temperature is about 0.35C to 0.45C warmer than the bottom of ~1989, & ~1993. While this could represent a slight warming trend (0.13C/10yrs), we don’t have the historical data using the same satellites & sensors before late 1978. There are many positive & negative drivers of climate so +/-0.5C natural variation cannot be ignored. But this isn’t a hockey stick to bash us over the head with.
Any cooling will now be blamed on Volcanoes, nature & our non-CO2 pollution to somehow “adjust” their climate models to suit the actual observations. I find it strange that some people are so quick at blaming warming on humans (not nature) but they think any cooling is a natural anomaly or wrong data (never blaming CO2).
There have been many in North America & Europe which are not wanting it to be any colder than the coldest days/nights they’ve had over the past 18mths. Cities frozen, electricity grids failing due to cold storms, vineyards needing heaters to stop frost destroying crops, lizards falling out of trees stone cold, ships stuck in ice. Individual weather events don’t represent the climate averages but it’s very hard to have significant warming with so much cooling over long periods of time.
You write:
1) ” Any cooling will now be blamed on Volcanoes… ”
Firstly, let me add La Niña. Is that not a well known cause for cooling?
Secondly: on what else than volcanoes would you blame the increases in the lower stratosphere and the decreases in the lower troposphere which happened together in 1982 and 1991?
The cooling generated by El Chichon was so heavy that it completely erased the El Niño in 1982 out of UAH’s data – despite the fact that this 1982 event belongs to the strongest ENSO signals of the last 100 years.
*
2) ” Individual weather events don’t represent the climate averages but it’s very hard to have significant warming with so much cooling over long periods of time. ”
Very interesting to read, especially for me living in Northeastern Germany.
Our last winter deserving the name was in 2010. Since then, a few cm of snow, and finito.
Even in 2021/22! A year which was for us much cooler than those before. Since mid November, coldest nights at -5 °C, apart from one single night drop down to -12 °C on Dec 26!
Shall I mention
*
I have more and more the impression that on this blog (I read in it since over 10 years), cold weather patterns get quickly identified with naturally cooling climate, whereas hints on warming patterns lasting over longer time are automatically downgraded to… weather.
*
Do we have significant warming? No se.
I made an own evaluation of UAH’s grid cell trend data
because I wanted to compare it with their original graph.
We see that apart from a small hot spot near the South Pole, everything happens above 30 °N.
Doesn’t look horribly dramatic, but I’m not a specialist in the domain.
Source for UAH grid cell trends
https://www.nsstc.uah.edu/data/msu/v6.0/tlt/
Original graph
Out of curiosity, I went on accuweather to check out what this past December and January looked like for Germany. I selected the city of Kassel, close to the center of the country. That site shows that the actual measured temperatures in that city were well below normal.
Do you claim that site is wrong, or that the center of the country is not representative?
https://www.accuweather.com/en/de/kassel/34117/january-weather/168717?year=2022
Change the month to December and year to 2021 to see that month’s data.
Jtom
I repeat:
” Since mid November, coldest nights at -5 °C, apart from one single night drop down to -12 °C on Dec 26! ”
Here are, for the period mid Oct 21 till end Jan 22, the night temperatures for the corner where I live
and here are those near Kassel
Similar temperatures. But I don’t know what is usual in Kassel.
Apart from the drop a lot above normal in comparison with what we had 30 years ago (as said, 2010 was our last real winter).
I was not discussing about what X or Y considers to be above or below norm for the places A or B.
With the two graphs added below, I hope you better understand how things do look like here in comparison with the past, and that ‘well below normal’ sounds a bit academic to me, though a guy generating himself anomalies wrt some reference period out of absolute data, exactly knows what it means.
GHCN daily stations in Berlin, Germany
1881-2021
1971-2021
*
Here is a sorted list of the monthly anomalies since 1951
1956 2: -11.04
1963 1: -9.26
1986 2: -9.12
1987 1: -8.18
1954 2: -7.30
1963 2: -7.30
1969 12: -7.14
2010 12: -6.66
1985 1: -5.94
2013 3: -5.33
2010 1: -5.31
1970 1: -5.30
2006 1: -4.81
1980 1: -4.59
1985 2: -4.45
At position 81
2021 4: -2.39 (yes, April!)
Rye grass needs ~6°C,but hardier meadow grasses and fescues will often grow slowly at ~4°C.
Migration of birds is an evolutionary adaptation to increase survival rates, birds have been adapting for a long time against climate, weather and food shortages.
The DWD graph does confirm your anecdotal evidence that average temp for January 2022 in Potsdam, Brandenburg, (if that’s about where you are) is on average a bit warmer than the 1981-2010 average.
Spring however seems to show it’s doing the opposite, and that’s when CO² is increasing in the atmosphere.
If the winter of 2010 is your reference for a real winter (average T -1.95°C) then you would have to go back to 1996 to find a colder one.
The average January temperature did not drop below -2°C between 1895 and 1924, that’s nearly 30 years, I’m presuming that was natural.
Thanks for trying to teach me about how weather and climate behave here where I live!
When I write ‘as said, 2010 was our last real winter’, I mean thast as it should be understood by normal people.
FYI, I was born in 1951, and perfectly recall February 1956, January 1963, etc etc.
A look at my second reply to Jtom might help you much more than you did ‘help’ me.
I have hourly DWD and METEOSTAT data on disk, thanks.
*
Could you spare me your CO2 blah blah? I’m not at all interested in such a poor, superficial discussion concerning that stuff.
I’m not trying to teach you anything, I was just verifying with data what you were saying, is that verboten in Bindidon world?
How incredibly arrogant, but seeing the way you reply to people I can see arrogance is one of your personality traits.
Just remember one thing, this comment section is for everybody and maybe other people might learn something, this isn’t all about you, get over yourself.
As for 2010, it is you that categorized it as “real winter”, a term very subjective and totally unscientific, I just put a figure to it so I could compare with other years.
I presume this video of heavy snow falling in Berlin in January 2017 is also not considered a “real winter” by normal people?
https://www.youtube.com/watch?v=afx2r12IhTg
Last February 2021 was probably not a “real winter” either according to the all knowing Bindidon.
https://www.dw.com/en/heavy-snowfall-paralyzes-northern-and-central-germany/a-56483641
Of course: this site is for everybody.
With the difference that I would never write such teachy stuff as
” Rye grass needs ~6°C,but hardier meadow grasses and fescues will often grow slowly at ~4°C.
Migration of birds is an evolutionary adaptation to increase survival rates, birds have been adapting for a long time against climate, weather and food shortages. ”
Jesus.
What now concerns Jan 17 and Feb 21, Climbel: that was nothing in comparison with Feb 10 – with respect to the corner where I live.
It’s good not to look through the wrong end of the telescope.
And by the way, I’m old enough to know the difference between a winter when I have to scoop snow off the sidewalk in front of our house with a big shovel every day, and a winter when I occasionally shove a few chunks of snow onto the street.
You can name me arrogant as long as you want. I’m immune against such claims.
Yes, arrogant people usually are.
January 1988 was 0.00°C.
LOL
So according to UAH and bellcurveman, the world temperature has risen by 0.03°C since 1988.
HORRORS! RUN AWAY!
Yes that’s exactly what the UAH is saying. If you ignore all other months and compare an average cool January in recent years with one of the warmest January’s from 33 years ago, there has only been 0.03°C of global warming. I suggest you alert the scientific community straight away with this vital information.
Oh Noes…
” So according to UAH and bellcurveman, the world temperature has risen by 0.03°C since 1988. ”
That is the typical nonsense produced all the time by the Monte-Carlo genius…
No, Monte-Carlo: the temperature did not rise by 0.03 °C.
Every child above 7 would understand that a warming is not determined by simply, trivially drawing a line above a time series’ plot.
*
According to the data published by UAH
https://www.nsstc.uah.edu/data/msu/v6.0/tlt/uahncdc_lt_6.0.txt
including the newest data for January 2022, the linear trend for January 1988 – January 2022 is: 0.14 (± 0.01) °C per decade.
Means that according to UAH, the global temperature has increased by 0.476, i.e. a bit less than 0.5 °C in these 34 years.
Nothing to hurl about! But… it is as it is, and not as you ‘see’ it.
“Every child above 7 would understand that a warming is not determined by simply, trivially drawing a line above a time series’ plot.”
I think I see the problem here….
“Every child above 7 would understand that a warming is not determined by simply, trivially drawing a line above a time series’ plot.”
Except that is exactly what they are teaching 7 yr olds. See this increasing rate? That is never going to stop!!
Umm no they are teaching them “if we act responsibly …. it will stop.”
Except it won’t.
Firstly not all CO2 is man made. In fact only a small percentage of the increase is man made. https://wattsupwiththat.com/2022/01/16/how-much-manmade-co2-is-in-the-atmosphere-really/
Secondly even if we achieved the full Paris Accord targets the effect on 2100 increase in temperature will be a mere 0.1° less than is we achieve RCP8.5 (seriously worst case scenario) model projections. Or put another way we can have practically zero impact on future temperature regardless of what we do and thus teaching 7 year olds that we can is at best misleading and more accurate utter lies.
Oh right, simple-simon-says. The temperature depends on how we act. Unless we do what we’re told by the gaia worshippers, Gaia will punish us by turning up the thermostat (which doesn’t make sense for punishment because warmer has always been better). Time to cancel a few virgins into the volcano?
I just knew it. When I was clearing snow for my garbage bin this morning @ur momisugly -12 F, it felt at least a tenth of a degree cooler.
Oklahoma City just broke two 100 year records for snowfall for date on Feb.2 and Feb.3.
Last year in February, the city had a debilitating storm and many lost power for days, which was unfortunate as just the previous November, we had a terible storm which brought the city to a standstill, with many streets impassable and many people without power, (I went 18 days w/out electricity.)
In the past dozen or so years, Oklahoma has experienced all- time record cold temps, probably the worst blizzard on record (Christmas 2009?) and many cold weather events.
All of this is just weather, of course and shouldn’t detract from the fact that we’re destroying the planet by trying to stay warm. And breathing.
Maybe it’s our Great Grand kids who just won’t know what snow is.
Staying warm and breathing are good things and beat the alternatives.
Yeah.
Indeed, it’s colder and colder in Northern America.
And in Europe, it’s getting warmer and warmer.
I didn’t collect GHCN raw daily data for Europe since a while, but here is a rather typical example – Germany:
And yes: Bavarian and Austrian Great Grand Kids very possibly still will know in 30 years what snow is.
But if even in such a cool year as was 2021, the following winter shows nearly no snow around Berlin in Northern Germany till right now, will then ours still know that?
No se!
I wouldn’t get too fixated on the rise in temps in Europe over the past few decades. It’s all dependent on what’s happening in the North Atlantic and the Gulf Stream feeding it. The AMO has been warm and has been declining for over a decade now. Based on it’s long history, it will continue down and the subsequent land temperatures will drop along with it. Nothing happens fast in the oceans, but they do happen.
Bindi, your graphs are just scaring the heck out of us. Oh, what we will ever do? Can anyone help us now?
We are all so different. I moved to Nevada to experience cold weather. I love it. My friends in So Cal and Scottsdale AZ HATE cold, and REALLY HATE snow, which I enjoy shoveling. Took me two weeks to clear the driveway.
December broke the Reno snowfall record. Lovely. January broke the low precipitation record (ZERO precipitation). My heart would be broken, except the temps have stayed low enough we still have some 2′ drifts around the house and ice on the rear deck (mountain top living).
Of course, I worry that propane will eventually be outlawed. It’s up over one dollar (US) from a year ago. My whole house generator will be worthless, and by then we’ll be largely using renewables in NV (i.e. we’ll be freezing half to death for weeks at a time).
We’re all going to die, so we’re good with it!
A good chance of a drop to the negative in a month or so.
Then we have to wait a few years to see if this leads to the first downward step in temperatures since the AGW farrago began.
There have been two upward steps since the mid 20th century cooling period.
Such steps up and down being a result of solar induced cloudiness changes which cause alterations in the proportion of solar energy able to enter the oceans.
I notice that the new 30 year average makes it easier to drop below the zero line. My comments are best considered in relation to a 60 year period.
Any period of less than about 70 years simply reflects part of a cycle. Over most of the last 43 years we have been in an upward trend of the approximately 70-year temperature cycle. Additionally, a 0.13 C/decade trend on the warm side of the cycle is unalarming. Count me unimpressed with such a small positive temperature trend in the face of a steadily increasing trend of atmospheric CO2 concentrations. I assume that would put a pretty firm lower bound on the number for the Transient Climate Response (TCR) range of estimates.
A reduced rate of warming seems to be at least part of the reason for “CAGW” morphing into “Climate Disaster” under the CliSciFi regime. There is always bad weather somewhere around the globe with which to stampede the sheepople towards the socialist nirvana de jure. The only limitation on warmunists’ desire to control is OPM. Individual Western nations are nearing that limit to lesser or greater extent. Let’s Go Brandon!
just here they said that it was one of the cloudiest winters on record
Thank you Dr. Spencer for your extraordinary work to produce a long term global temperature measurement so we can all see with our own eyes what’s happening. The UAH data is by far the best resource we have for refuting the hyperbolic claims of the alarmists. We get excited about big downturns but it doesn’t mean much other than to remind us that natural variation dominates. It’s the long term trend that matters.
The trend in the next two decades will be interesting to watch. It’ll have to increase dramatically to catch up with model projections. The longer it remains moderate the more steeply it will have to accelerate to match the models. At what point do the alarmists admit that the models are wrong? Those more grounded in science are already quietly ignoring RCP8.5, saying its projections of CO2 are unrealistically high. Which is really funny and a disingenous deflection because atmospheric CO2 continues to increase in line with RCP8.5 but temperatures and sea level rise are stubbornly refusing to go along with its predictions and they know it, meaning the models are wrong for every CO2 scenario (8.5, 6.0, 4.5, 2.6} and always have been. You would think, being scientists, that they would revise their models but the dogma is strong in them and they still cling to their invalidated assumptions about CO2 radiative forcing because catastrophic warming just has to be true, gosh darn it.
The models are wrong.
They should be adjusted continually.
I could model a forecast for tomorrow, and as new data came in I would continually adjust the model.
I would never stick with the original forecast I made a day ago when new data refutes it.
Who are these so called modellers that aren’t adjusting their models on a regular basis?
Scientific theories should not be judged as right or wrong, but useful or not useful. Newton’s gravity is wrong compared to Einstein’s, but more useful….From the meteorology/climatology standpoint, AGW is not useful. From the political POV, it has proven to be quite useful.
Scientific theories should not be judged as right or wrong, but useful or not useful.
Been reading William James, huh? : > )
But utilitarianism is not an adequate epistemology for everyday life, much less for empirical investigationa..,.
The CATASTROPHIC Anthropogenic Global Warming gravy train is supported by billions of dollars of mostly government funding. The only evidence for this comes from the models. They simply can’t be adjusted.
Oh they are revising their models. But until they stop using CO2 as the main control of temperature they will continue to be wrong.
“At what point do the alarmists admit that the models are wrong? Those more grounded in science are already quietly ignoring RCP8.5, saying its projections of CO2 are unrealistically high. Which is really funny and a disingenous deflection because atmospheric CO2 continues to increase in line with RCP8.5 but temperatures and sea level rise are stubbornly refusing to go along with its predictions and they know it, meaning the models are wrong for every CO2 scenario (8.5, 6.0, 4.5, 2.6} and always have been.”
Excellent question.
CO2 does continue to increase in line with RCP8.5, but the temperatures are currently cooling.
The alarmists are hoping the warming will continue. We shall see. Let UAH be our guide.
Exactly, they will do or say anything to keep the curves afloat.
Remember, it was Phil Jones that stated there would need to be a pause in warming for 15 years “before they became worried”.
Worried about what? That their gravy train would end?
It is impossible to be worried about “climate tipping points” and the lack of “climate tipping points” simultaneously.
It looks like the UK may be the first to see all this defeated. The have been subjected to a variety of onerous rules and regulations to counter Covid, all based on doomsday models projecting massive deaths. The models have been wrong at every step in modeling all the mutations of the virus. On top of that, those onerous rules were completely ignored by those in power.
Now they are faced with massive new taxes and energy costs because of policies based on yet more models. And they realize that those in power won’t be the least inconvenienced by the higher costs. It’s nice to be able to vote yourself a raise.
The people are not happy. I am waiting to see if a Trump-like politician steps up and offers saner solutions than those being pushed by the Labour Party and Carrie’s, sorry, Boris’s Tory Party.
The experts may never admit their models were wrong, but the people know it.
All predictions or alarmist reactions to current weather events which they extrapolate to future climate all assume RCP8.5. Reality is rather different. Despite all the claims of business as usual being RCP8.5 it is in fact RCP 2.6. The original target and best case scenario.
That’s not a fact that can be disclosed by activists and politicians activating for extreme change because it would negate any changes. So to solve the problem the IPCC has now created a lower scenario so that they can make a new target to justify reduction is CO2 output.
Factoring in the 5~6 month lag between La Niña cooling and UAH 6 global temp anomaly cooling, March’s temp anomaly will likely be around -0.1C~-0.2C and will mark the end of the current La Niña cycle.
UAH6 temp anomalies will increasr after March as a new El Niño cycle develops later and will generally trend upwards will through to the middle of 2023.
It’s very difficult to predict how strong the developing El Niño cycle will be, but given the 30-year PDO cool cycle seems to already started, it’s likely to be another moderate El Niño cycle.
There is a pretty good chance that the next La Niña cycle starting from around the end of 2023 will be a strong one as we haven’t had a strong La Niña cycle since 2010, and there is usually at least one strong La Niña every 10 years, so we’re “overdue”…. (Yeah, I know that’s not how statistics work, but still..)
Holá SAMURAI-san,
This is a thoroughly modernized discourse you are offering us here.
Moderate appreciation of ENSO, no longer GSM blah blah…
Much appreciated.
That’s a pretty substantial reduction from your previous predictions in which you said -0.3 C on the 1981-2010 baseline [1] which is -0.44 C on the new 1991-2020 baseline. Why the reduction?
Don’t be so sure the La Niña will disappear too quickly. The Australian BOM tracks the tropical Pacific waters to depth and its still pretty cold to 160W. Maybe at least to fall before it moves to La Nada. http://www.bom.gov.au/climate/enso/#tabs=Pacific-Ocean&pacific=Sea-sub%E2%80%93surface
rbabcock-san:
According to Pacific equatorial sub-surface ocean temperature anomalies, the current La Niña cycle is quickly dissipating and warm deep-water currents are quickly moving east, as occurs when a new El Niño cycle is developing:
(Page12 of attached ENSO Report)
https://www.cpc.ncep.noaa.gov/products/analysis_monitoring/lanina/enso_evolution-status-fcsts-web.pdf
“She’s dead, Jim.”
Did you not even read through the report? Page 25: The CFS.v2 ensemble mean (black dashed line) predicts La Niña to continue into autumn 2022. Then to La Nada. An El Niño is probably a year away and current indications say mild if it develops.
Just too easy to cherry pick statements that agree with one’s confirmation bias.
We are still feeling the effects of the cloud changes seen over the past 25 years. They have thinned allowing in more short wave (aka solar) energy. This energy has warmed the oceans and oceans continue to release it slowly back into the atmosphere. Until the clouds thicken back up we will not see any long term cooling.
BTW, looking at the atmosphere as a multi-layer onion provides insight as to why CO2 increases cannot provide more warming.
When you add CO2 it radiates more energy in all directions. That includes upward. If you believe downwelling energy warms the Earth, then the increased upwelling energy should cool the planet.
But neither is true because the amount of upward energy flux is independent of the amount of CO2. The actual amount of energy flow is based on the total energy available and is moderated by the gravitational field. Since neither of these changes with added CO2, you get no warming.
To understand this think of 3 layers of the atmosphere constantly absorbing and radiating energy through CO2 molecules.
The middle layer is radiating more energy than the upper layer because it is denser. It is radiating less energy than the bottom layer because it is less dense. Same is true for absorption.
Hence, the middle layer absorbs more energy from the layer below than from the layer above. However it radiates equally in both directions. This means there’s a net positive movement upward and a net negative change downward.
This is how energy moves through the atmosphere.
If you replace some O2 with CO2 you get more absorption and radiation in all 3 layers. However, the amount of change in all 3 layers is unchanged since the difference is driven by the change in density which is unchanged. The flow remains the same.
Even though more energy is radiated downward from any given layer, that is met with an even larger flow upward from the layer below it. The difference is based on the difference in density.
This is not at all simple. It takes most people some time to grasp what is going on. It helps to first consider what would happen without gravity. Then all the flows are equal and you quickly realize there would be no energy movement at all when you increase CO2.
I realize the actual flow in the atmosphere is not this well constrained. Statistically, all those other complexities vanish.
Finally, it is rather amazing that the upward movement of energy through the atmosphere is driven by gravity. Not at intuitive. While there exists downwelling IR, the energy flux is always upward. Hence, it cannot warm the planet.
” When you add CO2 it radiates more energy in all directions. ”
Typical nonsense.
If CO2 (and yeah! at the very first position, water vapor) molecules aren’t present in the atmosphere, than all the terrestrial IR immediately radiates to space, instead of being caught by these nice little molecules.
And where CO2 catches IR (at up to 50 km altitude), this IR very certainly is not due to heat generated by convection!
What now concerns the real effect of that half of IR reradiated down to surface by H2O and CO2… hmmmh. That’s a myth imho.
Denial of science is common among the climate cult. Are you claiming that Kirchhoff’s Law does not apply to CO2? Definitely, appears that way.
The half of energy radiated down is always less that the amount of energy radiated upward due to the density differences as I described. That means the net flow is always upward and ends up in space.
There is one small error in my description which I insert to see if the person reading it makes any attempt to understand this science. You failed.
Bindidon
No ghg’s, how does the atmosphere cool. It will warm through conduction with the surface, but how does it cool?
That “half” you talk about ignores the actual phenomena that is occuring. In order to describe how it actually proceeds requires a calculus showing how the diffusion of the radiation occurs. It is not a simple half goes up and half goes down. The lapse rate and the density changes in altitude determine how much actually goes down and goes up!
It seems to me that none of the people having replied did understand what I wrote:
” What now concerns the real effect of that half of IR reradiated down to surface by H2O and CO2… hmmmh. That’s a myth imho. ”
Every 12 year old child would have read that correctly.
The replies remind me these Spanish corridas, and the toros solely looking at the red muleta.
Thanks a lot, very good.
Since you obviously did not understand the comment you responded to, it’s not surprising that you are out in left field. The comment and replies below answer all of your points.
The downwelling IR does not warm the surface due to the effects of the EBL. Once you realize that energy primarily remains in the atmosphere, then you only have a net upward flow of energy similar to a conduit with the flow driven by the differences in density as you move upward.
You are capable of understanding. It’s not intuitive, but it’s also not overly complicated once the main points are understood.
For the very last time:
” ” What now concerns the real effect of that half of IR reradiated down to surface by H2O and CO2… hmmmh. That’s a myth imho. ”
Didn’t you understand that simple sentence, man?
I’m telling that I do not believe that downwelling radiation coming from reemission by H2O or CO2 has any warming effect.
Do you have problems to understand
” That’s a myth imho. ” ???
Jesus are you Pseudoskeptics boring!
CO2 doesn’t radiate more in all directions.
Consider this. If there is 1 unit of energy radiating upward and it is captured by a CO2 molecule. Then if half that energy is then radiated downwards, then there will only be half a unit left to radiated upwards. The total amount of energy being radiated upwards decreases while the amount being radiated downwards increases.
I was simply referring to the random nature of CO2 radiation. In addition, once energy is absorbed it is no longer radiating upwards or downwards. In the case of CO2 the surface signal is extinguished within 10 meters. No more surface originated radiation going upwards. All you have is CO2 radiated energy going upward (downward) between layers as in my description. Study it closely, you will find that the net radiation flows upward based on the gravitational force.
But, what about the back radiation of that first 10 meters of absorption. Doesn’t it warm the surface? Turns out it is irrelevant. Since it is within the equilibrium boundary layer (EBL) of the atmosphere any imbalance is quickly removed via conduction. The energy that was supposed to warm the planet is returned into the atmosphere as part of massive equilibrium energy transfers.
Conduction may be slow across large distances but those do not exist in the EBL. Conduction also utilities all atmospheric gases and kinetic collisions at the surface occur a thousand times faster than radiation events. As a result, any downwelling energy to the surface from within the EBL disturbs the equilibrium and conduction works to restore it quickly.
This effectively means all we have are the layers I mentioned previously. Energy effectively starts flowing upward with slow losses to space as the density decreases.
I realize this destroys the belief that CO2 generates 3.7 W/m2 of warming. The 1.1 C warming that it could create almost entirely disappears. We now have an explanation for the results of Seim/Olsen 2020.
https://www.scirp.org/journal/paperinformation.aspx?paperid=99608
This is a complicated physical phenomena that I don’t think people understand completely. This is an example only, don’t look at the numbers, just look at the concept. First, emissivity = absorptivity. If emissivity is based on temperature, then so is absorption of radiation. If you had two CO2 molecules, one at the surface at 300 K and one at 10,000 ft at 250 K (because of lapse rate), The surface would emit based upon 300 K ^4, but the one at 250 K could not absorb all that radiation. What happens to the rest? On out to space.
Now I’m not stupid. I know what happens is vastly more complicated because of continuous temperature change and continuous radiation values. They are not linear and require calculus to describe the actual gradients. That is one reason why radiation diagrams using linear algebra to describe what is going on is so much foo fa rah.
Read carefully what Richard M has written. It is a good attempt at describing a complicated atmosphere.
Radiation is not a bullet. It is an electromagnetic signal that radiates in all directions, just like a radio signal from an isotropic antenna. That wave front is made up of energy which we quantify as “photons”. The energy in any specific direction of that wave front follows the inverse-square law. As the spherical wave front gets larger the energy contained in each incremental piece of the wave front gets less. Just like a radio signal gets weaker as you move away from the antenna.
I would also add this observation: If GHG’s in the atmosphere intercept LWIR going up and then re-radiates it, why doesn’t the GHG’s in the atmosphere intercept the part of the wave front headed downward toward the earth? it would seem logical that by the time that wave front reaches earth a certain portion of it would have already been intercepted. And part of that back radiation would then again be sent away from earth with only a fraction being left to actually go on toward the earth. What will be left by the time that wave front reaches earth? If that original backward wave gets intercepted in the atmosphere 100 times and half of it is lost each time then the part that reaches the earth will be X/(100 * 0.5) or 50 times smaller than what started out.
My conclusion from this? The atmosphere gets heated much more that the earth does from back radiation. That really puts into question trying to use atmospheric temperature as a proxy for surface temperature. It’s probably *not* a linear relationship yet everything trying to depict radiation and the earth never accounts for this.
Some people divide IR into IR-A and IR-B and IR-C with IR-A being the shorter IR frequencies. They say that incoming IR from the sun does not match outgoing IR from the earth in frequencies. This is supposed to be key in how there is a small net warming from IR. The CO2 allows X amount of IR to hit the earth’s surface, but only allows X-small amount to be radiated back to space…….due to differences in frequencies.
I am not sure about the effect of gravity on radiation, but it does affect the density and temperature, i.e., the lapse rate. As you move up, there are fewer and fewer molecules and they are also colder.
If you take a slice of atmosphere that has 10 CO2 molecules, then the next slice has only 9 CO2 molecules and are cooler. If the 10 radiate all at once, then the nine only intercept part of the radiation and some goes on upward. Also, since the 9 are cooler, they do not radiate as much in the downward direction as was sent from below. The net is always upward.
This ignores conduction both from the earth to all air molecules but also from CO2 to other molecules. This is what warms the air.
Exactly, this is precisely what I was describing. Gravity affects the density and it is the difference in density that leads to more net upward radiation between layers.
Essentially, CO2 creates an energy conduit moving energy from the high density surface to the low density upper atmosphere. The conduit narrows and energy leaks out (toward space) as you go.
To go a bit extreme, a 2% increase in absolute temperature (call that 5C) causes an 8% increase in emitted IR energy….and the solar constant remains, hmmm, constant….There’s just not enough solar energy available that double the CO2 can absorb to make the planet much warmer than it already is, at least without some sort of fairly big Albedo change. Maybe one more degree. So as they say on Wall street “if something can’t continue rising…it will stop.”
It’s harder to push the earth’s temperature distribution curve further to the right than to the left. There’s the T⁴ term that favors the other direction.
Just to prove my point.
https://climate.weather.gc.ca/climate_data/daily_data_e.html?StationID=49568&timeframe=2&StartYear=1840&EndYear=2022&Day=3&Year=2022&Month=1#
Denise, I’m not sure to be so much younger than you. I perfectly remember here in Europe our winters in 1956, 1963, 1979. They were by far not as cold as what Northern America experiences since ‘evah’ during all winters, but 11 °C below norm: that’s a lot too, isn’t it?
*
The coldest records in GHCN daily for OTTAWA:
CA006105976 54-41 1933 12 29 -38.9
CA006106100 54-41 1957 1 15 -38.9
CA006105976 54-41 1933 12 30 -38.3
CA006105976 54-41 1934 2 17 -38.3
CA006105976 54-41 1925 1 19 -37.8
CA006105976 54-41 1943 2 15 -37.8
CA006106090 54-41 1957 1 15 -37.8
CA006105976 54-41 1934 2 8 -37.2
CA006105976 54-41 1943 2 16 -37.2
CA006105976 54-41 1957 1 15 -37.2
*
But to remember cold moments, you just need to go back three years ago, and look at corners not so terribly far from yours, e.g. Cotton, Minnesota in January 2019:
USC00211840 54-35 2019 1 27 -48.9
USC00211840 54-35 2019 1 31 -47.2
USC00211840 54-35 1965 1 14 -45.6
USC00211840 54-35 1996 1 20 -45.6
USC00211840 54-35 1982 1 17 -45.0
USC00211840 54-35 1967 1 18 -44.4
USC00211840 54-35 1972 1 15 -44.4
USC00211840 54-35 1996 1 31 -44.4
USC00211840 54-35 1965 1 29 -43.3
USC00211840 54-35 1996 1 21 -43.3
There is, as it seems, always a corner near us which is way colder than where we live.
Hi Denise. The cooling scare in the 1970’s was a narrative mainly driven by the media. A lot of that was based on the research by Reid Bryson and his human volcano theory in which he thought aerosol forcing would overpower greenhouse gas forcing. He wasn’t completely wrong as there was a period between 1950 and 1980 in which anthropogenic aerosol forcing really did match or even exceed human greenhouse gas forcing. But by 1980 pollution was reigned in and GHG forcing began outpacing aerosol forcing. In fact, aerosol forcing started to decline some. Anyway, most scientists in the 1970’s were convinced that the Earth would continue to warm [1]
From memory, James Hansen (the “Father Of Global Warming”) led the panic about an imminent ice age in the ’70s.
Seems that particular bout of “science” wasn’t “settled” enough to last into the ’80s.
(Smart guy Jim Hansen – he sees when one trough is drying up and another is beginning to fill, and time to get your nose in before the crowd piles in.)
I don’t think that’s right. I think what you are referring to is the Rasool 1971 publication. Although Rasool 1971 used some of Hansen’s research Hansen was not an author on the publication. It’s important to note that Rasool was only exploring possibilities related to hypothetically large increases in aerosol forcing on the order of 4x or higher what they were at the time. BTW…notice that Raspool cites Bryson in that publication. Anyway, Hansen, AFAIK, never predicted an ice age.
Dr. S. I. Rasool of the National Aeronautics and Space Administration?
Mr. Rasool came to his chilling conclusions by resorting in part to a new computer program developed by Mr. Hansen that studied clouds above Venus.
So is there any record of Jimmy Hansen pooh poohing his buddy at GISS’ paper?
No. There is no record of Hansen “pooh poohing” Raspool or Schnedier. In fact, he said the Raspool 1971 publication was a useful scientific paper.
BTW…Raspool & Schneider may be right. Note that in 1970 the RF of aerosols was -1.5 W/m2. 4x that would -6 W/m2. A 3.5 C change would only require a climate sensitivity of 0.6 C per W/m2. Today you could argue that R & S were too conservative with their 3.5 C estimate.
already saw this on Roy Spencer’s feed. You posted Spencers complete website entry …TMI
Who is Roy Spencer, I am a older lady just stating what I believe, Please give me a link , maybe he agrees with me. No need to be rude!
When the indentation level of a comment is the same as that of yours, it is very unlikely a reply to what you wrote.
OMG really? You saw it somewhere else? I’m soooo sorry.
Is this meant to be rude to me or the the reply to me.. hard to distinguish from your vague comment.
Reply to Denise, it can be confusing sometimes but Danley Wolfe wasn’t replying to you, he was just making an uninformed comment, and got a sarcastic reply from Charles Rotter the admin of the site.
When someone replies to you, your name will be at the top of their comment, and the comment box will be offset slightly to the right.
Try not to take comments personally, life’s to short.
Dr Roy Spencer is the author of the article, his website is here:
From Dr. Roy Spencer’s Weather Blog
Good, helpful comment.
He is responding to Danley Wolfe as shown under his name where it states “reply to Danley Wolfe”
No one is picking on you relax and enjoy the reading here.
It’s sarcasm. Perhaps you were so busy being offended you couldn’t recognize it.
love it keep posting best things thanks for sharing love it
Literally nothing out of the ordinary is happening at all (except the rise of an evil New Religion!)
the fireworm approaches
We don’t need to argue about 0,?/deg, We need to accept that the earth is getting warmer. However the minuscule increase is not an existential threat. This is what we should sing together. The world is not in danger. As Tucker would say “Sit down and shut up,”
We all have periods when temperature is hot/warmer than whenever. Here along the Ohio River our “plant hardiness zone” was changed 20? years ago. We moved up to a warmer
zone. This doesn’t prove/disapprove anything. I plant the same plants and have the same bugs and viruses.
We are not facing an existential threat.
I miss the old days, when the river Thames in London was frozen three foot deep and the Valley Forge encampment also had its ground frozen three foot deep…. Those were the days……
All that New Jersey swamp, frozen solid.
Everybody…. that’s ”climate change” right there. Have a good look then run away screaming.
0.13 degrees per decade! So 1.3 degrees in a century’s time! Woop-de-DO, warmists!
Dear warmists – explain THIS to me. Say the temperature is (on average) 16 degrees Celsius in my country. If it is 18 degrees in 100 years time, *how will that kill anyone?*
It WON’T!
Even in a hot place like (say) India – say it’s (on average) 35 Celsius now. In 100 years that’s 37 Celsius. Big deal!
Oh, but “melting Antarctica” they say! Gee, even if that were true, we can *move!*
We’re not helpless! Yes, it would be massively expensive but *people can adapt!*
Oh, but “water shortages”, they say. It is true that *some places* (best example being Southern California taking water from the Colorado River) need to wise-up with their water usage but their problems are caused by *massive waste of water* – not by the climate.
Oh, and India is FAR ahead of the West when it comes to conserving water (with their water-harvesting schemes).
Newsflash – If it were warming, that means more evaporation. Evaporation *cools* – that’s why a breeze on your sweating body feels so good. It also means *more rain*.
It’s a self-correcting system!
As for desertification, one of the main causes of that is foolish land use – grazing too intensively and chopping down every tree in sight.
I note that with increasing CO2 levels the *Sahel is greening*. Oh, and we had record wheat harvests a couple of years ago – oh, that nasty CO2!
“Even in a hot place like (say) India – say it’s (on average) 35 Celsius now. In 100 years that’s 37 Celsius. Big deal!”
Most of the warming is not global as they like to say, but heavily weighted in the upper northern hemisphere.
India will be fine.
I live there and I am freezing.
lol 🙂
I live in Northeastern Germoney, the last winter was deserving that name was in 2010.
I’m not freezing at all anymore, how good.
The only disturbing factor is that the cold has been replaced by permanent wind, due to atmospheric lows running since years every day down from the Northern Atlantic.
With such a bad news for Coolistas, I hardly will become upvoted 🙂 🙂
Get-money? Is that a slip?
Ger-money, ugh auto correct.
They both work 🙂
No kidding, it’s so cold here I will become a climate refugee tomorrow as I travel to FL.
I live in the north of the Netherlands and I totally agree: we haven’t seen any serious winter since 2010. Only lots over grey overclouded skies and winds from the southwest that deliver relatively hot air masses. Even now, in a year with record low Solar activity, no frost up till now. While for at least the last 100 years low Solar activity covariated very strong with low temperatures and lots of great ice skating events. I almost forgot how snow looks like ….
OK, one positive thing about this is that I’m not going into bankrupcy as our leftish green liberal government has made energy prices skyrocketting -as Obama promisssed.
BTW CB, how many thermometers are there in that red blob? Or have “they” simply spread out the few there are?
I agree, India (and everywhere else) will be fine.
Well the map is based on NOAA’s GHCN-m v4 and that takes monthly mean temperatures from 25,000 ‘thermometers’ across the globe. I don’t have the metadata on their exact locations.
I think there’s only about 10 permanent stations in the Arctic, somebody will correct me if I’m wrong.
Talking of the Arctic…
The wetter the environment, the less impact CO2 has.
The tropics will see the least warming from CO2, assuming they see any.
Wouldn’t that make sense, because the tropics are much more humid than the polar regions, and H2O vapor is 20X the greenhouse gas CO2 is.
I am waiting for another Kapitan Kolbenikov eco tourist boat trip to demonstrate to all selected passengers the horror of the disappearing ice in the Arctic, which got stuck in ice that was supposed to have not been there for several weeks without rescue, the ice being so thick that ice-breakers couldn’t reach the stranded vessel!!!
Popcorn is open, waiting to see what a negative AMO does. If temps fall off back towards 1970s levels, CO2 is a busted flush. If it stays level (hopefully) CO2 is having some effect, though not dramatic.
Any suggestion of an alarming rise from CO2 is already dead, we know that, the lack of warming cant be accounted for, the Cabal admitted it. So the whole panic is over anyway.
Some trivia:
Only the 17th Warmest January, or 28th coldest, out of 44 years of UAH data.
The coldest January since 2012.
Only one January in the 20th century was warmer.
Warmest evah
I see your math’s skills are as good as your spelling.
No, 17th warmest in 44 years is not warmest ever – it’s 17th warmest. Hope you can understand the difference, or do you want me to draw another picture.
Hahaha are you going to draw us another hockey stick?
You and Mann are clown-shows. I am wondering if you are related to the Russia colluuuusion Simon who posts on here.
Call me back when you have a couple hundred years of data.
Declaring warmest or coolest ever from 44 years of data is a fools errand, and you are just the fool to attempt it.
Can you actually read? I said it was the 17th warmest January out of 44 years.
Maybe you are thinking of carlo, monte who thinks that UAH is so bad, that every month is statistically tied for the warmest ever.
Stop whining.
Brilliant come back. I can only admire the originality of your wit.
You are right
It’s getting colder
Very bad
Thanks for highlighting the end of the AGW scam
He luvs his noisy grafs…
Thanks, I do like them – but ggplot does most of the work.
And as of this date, we have more arctic sea ice than we have had for a dozen years. I remember everyone saying that was “the canary in the coal mine” only a few years ago when those death spiral arctic ice graphs were “exhibit A” for an alarmists proof of gorebull warming.
https://nsidc.org/arcticseaicenews/charctic-interactive-sea-ice-graph/
DMacKenzie
You are right; when sorting NSIDC’s G2035 absolute data for the January months since the year 2000, we see this as top 10:
2003 1: 14.39 (Mkm²)
2002 1: 14.27
2000 1: 14.22
2001 1: 14.20
2004 1: 14.03
2009 1: 13.91
2008 1: 13.89
2022 1: 13.88
2010 1: 13.74
2012 1: 13.73
But it is not incorrect to have a global view, taking the situation in both the Arctic and the Antarctic into account.
Here is the global top 20 for the January months:
2015 1: 20.45 (Mkm²)
2008 1: 20.30
2003 1: 20.16
2014 1: 19.98
2009 1: 19.62
2004 1: 19.62
2001 1: 19.43
2012 1: 19.38
2013 1: 19.24
2002 1: 19.01
2000 1: 18.97
2010 1: 18.70
2005 1: 18.41
2007 1: 18.37
2020 1: 18.16
2016 1: 18.16
2021 1: 18.15
2011 1: 17.97
2022 1: 17.74
2006 1: 17.63
Here is a graph showing the absolute values for the Globe as time series:
Right on, we have a recent recovery since 2019! No need for even more salt-free water in the oceans, especially in the Northwestern Atlantic.
But… such a recovery we had already for 2012-2015, and for 2008-2011.
A look at recent years in departure form (wrt mean of 1981-2010) might be of interest:
{ I have reinstalled 2012, it is the plot in dotted black. Most people don’t know that 2012 was a very icy year, because only its melting season has obtained attention. }
Source
ftp://sidads.colorado.edu/DATASETS/NOAA/G02135/
Once again the warmies misuse statistics in a desperate effort to remain relevant.
The same is pretty good valid for the Coolistas, isn’t it?
No kidding…maybe the tiny warming is due to all the concrete and asphalt 🤔
“No kidding…maybe the tiny warming is due to all the concrete and asphalt”
Haha… given the fastest warming place on the planet is the Arctic…. I don’t think so….
Hey it’s the Russia colluuuusion clown. I had to laugh when Trudeau said Russia was behind the trucker protest. I seriously laughed out loud and said to myself where have I heard that before 🤔
And then the Canuck press dutifully picked up the Russian nonsense and ran with it.
So no answer for my pointing out how silly your comment was re warming coz there ain’t no concrete (worth talking about)in the Arctic. Just Duh!!!! Russian collusion. Duh!!! Trudeau. Dud Duh Duh!!!!!! If nothing you are consistent. But hey you don’t need to know anything about science if you are Derg, just copy and paste irrelevant stuff to divert from the fact you have no answers when questioned.
Hey you were the Russian colluuuusion guy and it cracks me up how Trudeau does the exact same thing.
You are a clown show and should be ashamed of yourself. You can’t talk science because you are a liar. The world is beginning to see what pieces of 💩 you type of people are.
Once again no come back just put downs. What a guy.
Because you are a liar. Russia colluuuusion indeed.
I’m unaware of “coolistas” here?
There are warmistas for sure.
The rest are just normal people who can read
What on earth are you on about? I stated where this January fell in relation to other Januaries according to UAH. It should be obvious that being 17 out of 44 is not particularly warm. It’s a pretty average month at least compared with recent years.
If I wanted to demonstrate warming, I could have simply pointed to the head posting where it states that the warming trend over the last 43 years is 0.13°C / decade, and that amounts to 0.56°C of warming over the satellite era.
If I really wanted to misuse statistics in order to exaggerate the warming I would have gone done the Monckton path and cherry picked the start date to show a length of faster warming. E.g. Despite the double dip La Niña, UAH shows that over the last 14 years and 8 months the globe has warmed by 0.44°C, a warming rate equivalent to 3.0°C / century.
Same old, same old, tired worn-out carpet, anything to keep the rise alive.
Carlo, Monte That is just so fair.
–
Bellman
If I really wanted to misuse statistics in order to exaggerate the warming.
If I really wanted to misuse statistics in order to exaggerate the warming I would have cherry picked the start date of UAH to show a length of faster warming.
–
It is blindingly obvious that if you start on top of a sine curve and misrepresent it as being the average that it will always go down from that point.
Seeing that you never admit this fact but take it as gospel gives you no credibility at all.
Admit faking it and grow up statistically
“It is blindingly obvious that if you start on top of a sine curve and misrepresent it as being the average that it will always go down from that point.
Seeing that you never admit this fact but take it as gospel gives you no credibility at all.”
Why would I deny that. But if you are suggesting UAH data shows we are at the top of a sine wave, you need to show that. When will we see this fall? How long before there is a statistically significant drop in temperatures? At present the best fit looks to be a straight line.
If the evidence changes I’ll admit it, but this continuous wishful thinking, looking at each La Niña as proof that we’ve reached the top and cooling must surely follow, is just getting embarrassing.
I’ve been following these claims for decades. “There’s no evidence of warming in the 90s”, in 2009 Monckton’s claiming that “there’s been rapid global cooling for 7 years”, the month by month growing pause up to 2016. Every time there’s a chorus of skeptics claiming that this is proof that we’re at the top of a sine wave and any time now temperature will start plummeting – but so far it has not happened.
Anything to keep the rise alive == bellcurveman.
Here is the proof. Run your trend out 1000 years. Is your trend accurately telling you we going to achieve that? If not, why not, and when will your trend turn negative?
Are we never going to reenter another glaciation? If so, temps are going to have to fall.
These are questions that linear regression of a short time, geologically speaking, need to answer. But, so sorry, linear regression can never follow cycles. A linear regression must have a non-changing slope. Therefore, it can never follow a phenomenon that varies in time.
You have an odd idea of what constitutes proof.
Why would I run the trend out to 1000 years? I’m not even extending out past the current date.
“If not, why not, and when will your trend turn negative?”
That’s the question I was asking. I keep being told we are at the top of a sine wave and any time soon it will turn negative, but so far no evidence that it is actually happening.
“Are we never going to reenter another glaciation? If so, temps are going to have to fall.”
Obviously. But that’s a long way from saying temperatures are currently falling.
“These are questions that linear regression of a short time, geologically speaking, need to answer.”
Why? There are a lot of reasons for linear regression, but predicting what will happen outside their limits is not a good one. If you want to predict what will happen in the next 100 let alone 1000 years, you really don’t want to just extend the current trend line. You need things like physical models.
“But, so sorry, linear regression can never follow cycles. A linear regression must have a non-changing slope.”
Not true. You can fit all sorts of curves using linear regression. But as always, the more variables the more risk of over fitting.
I have yet to see a Fourier analysis of the temperature curve over several millenia or a wavelet analysis either. Either would break out any cycles there are to be found in the temperature record. While the Fourier analysis won’t tell you much about the phasing or time relationships of the cycles. Wavelet analysis doesn’t identify frequencies as easily but it gives time relationships. Look up a wavelet analysis of a speech sample some time.
Until I see a widely published analysis like this I take all linear trends of temperature with a grain of salt.
Think of it this way. The temperature curve is time dependent and generates a multi-model data distribution. You can’t take a multi-modal data set and jam it all into a single average without losing all of the modality associated with the actual data. And when you lose that modality you also lose time-dependence associated with the temperatures. A wavelet analysis of the overall data set would give you at least some of the time dependence back (i.e. the seasonal time dependence). A fourier analysis would give you the frequencies of the cyclical changes, e.g 4 cycles/year for the seasonal time dependence.
From this you could *see* the relationships of starting and ending periods. If there are long term cycles, e.g. like La Nina/El Nino, then it would show up and you could avoid biasing the trend line from the choice of start/end date.
UAH is *NOT* a time series temperature. It is a calculated metric based on the satellite traveling around the earth and reading radiance as it travels. It does *NOT* measure Tmax or Tmin and has no real relationship to climate. It is, once again, a multi-modal, time dependent snapshot of “something”.
As a metric it is useful in measuring gross trends in the metric. It is not really all that useful in determining climate at any point on the earth let alone a global climate. It is far different than surface based temperatures.
There are none so blind as those who will not see. Monckton’s claim is that there has been no warming, not that we are cooling. If CO2 is the thermostat and CO2 keeps going up but the temperature does not then that thermostat is broken. If the thermostat (CO2) is broken then all the models that depend on the thermostat are broken as well.
If you are truly open-minded on this then go here and read this *FOR MEANING*: https://www.nature.com/articles/s41598-018-25212-2
This paper was written by agriculture scientists. Their investigations have *real* world consequences that can be measured and validated.
“”On average, FFF has been occurring later (by 5.4 days century−1), and LSF has been occurring earlier (by 6.9 days century−1), resulting in the average lengthening of the CGS (by 12.7 days century−1). ”
[tpg – FFF is first fall frost, LSF is last spring frost, and CGS is climatological growing season]
“We developed relationships between county-level crop yields vs. agroclimate changes and found that all crops (maize, soybean, sorghum, spring wheat, winter wheat, and cotton) responded positively to a lengthened CGS, while responding negatively to increase in GDD, except cotton.” [tpg – GDD is growing degree days]
“The annual AGDD trends (deviation from mean annual AGDD) in time domain (1900–2014) are presented on a national scale in Fig. 3. The deviation was initially close to zero, which rose to a positive maximum in 1939 and thereby started declining into negative deviations until the end of the study period in 2014. The national time series is derived from observed data at 1218 sites, and presents a national changes in AGDD, but it should be acknowledged that the constituent sites show highly variable trends and relying on a national series can conceal regional variations.”
[tpg – red in the attached image is annual GDD]
So what do we know from this? CGS is increasing while GDD is decreasing. Longer growing seasons with less heat accumulation.
My conclusion? Minimum temps are going up thus positively moving the first and last frost day while max temps are stagnant to moderating thus not increasing heat accumulation.
Admittedly this is for the continental US but this gives us a good picture of what is happening with a large percentage of the globe. You can find the same relationship with heating/cooling degree day values around the world. Fewer heating degree-days and stagnant to moderating cooling degree-days.
Are you now going to tell us that all of this data, which runs counter to the Earth turning into a cinder, is wrong and these ag scientists don’t have a clue as to what they are talking about?
“There are none so blind as those who will not see. Monckton’s claim is that there has been no warming, not that we are cooling.”
Take that lesson to heart. I specifically said it was Monckton’s claims from 2009 when he was constantly claiming 7 years of global cooling. Here for example, or here.
+0.03degrees, just wow.
According to bell curve bellman, 1988 was +zero degrees; this means 0.0088K per decade or 0.88 mK per century.
We’re all gonna die!
“We’re all gonna die!”
Correct.
You first with any luck.
There is a very real psychological phenomenon whereby people who are convinced they are going to die find some way to make it true.
So should we be sending the rubberized banana truck to pick you up?
For you own safety?
“You first with any luck.”
Very likely.
“…people who are convinced they are going to die find some way to make it true”
So you think you are never going to die?
Maybe my not very subtle joke was lost on you. Every one dies eventually.
Thanks Roy for the update. Doesn’t look to scary to me!
I like the bigger dot for the latest reading…makes it easier to see what’s happened this month.
The real climate emergency is locking in mandates, regulation, tariffs, and tax increases before the oceans reveal the fraud and before Edward Markey laments “Who could have known.”
Another graph I saw on these pages said no warming for the past 7 years. What do I believe?
The Third Viscount has a {sarc} very selective view {/sarc} over UAH’s data.
The more you look at the history of a time series, the more it tells you.
Yawn…CO2 climbs and temperature stays the same. CO2 is a control knob 😉
Different data sets. The pause is in the HADCrut data, that post acknowledges warming in the UAH data aside from the last few months.
The Arctic air mass is cut off in the southern US and will remain there longer.
The “warming” is the “warming”. Not much.
But I am most disturbed by the deceitful government policymakers who use the purposefully deceptive words “address” and “mitigate” climate change.
Rank and file climate crusaders all presume that means doing something about it when it does not. Query any of them to provide any science showing carbon policies altering the climate and they clam up or parrot the usual cliches.
IMO more attention (criticism) needs to be aimed at and highlight the absence of any atmospheric, climate or weather changes possible from the worthless “addressing” and “mitigation”.
As most regulars here are aware, there is widespread recognition that all of the implemented and proposed “addressing” and “mitigation” is worthless as relating to anything climate or weather,
Example https://ballotpedia.org/Fact_check/Would_the_Clean_Power_Plan_mitigate_climate_change
Excerpt: The excuse…
“The value of this …[mitigation] …is measured in showing strong domestic action which can actually trigger global action to address what is necessary…if we don’t take action domestically, we will never get started.”
That is nothing but another fatally flawed presumption. It’s an empty claim that will never even be measured. Who and how will will anyone ever show global action is addressing what is necessary?
No one will, ever.
We’ll all be dead, decades will pass and the asinine mitigation will never trigger or address anything necessary.
Without demands for science and politicians to measure and demonstrate positive climate impact the climate crusade remains the biggest fraud in human history.
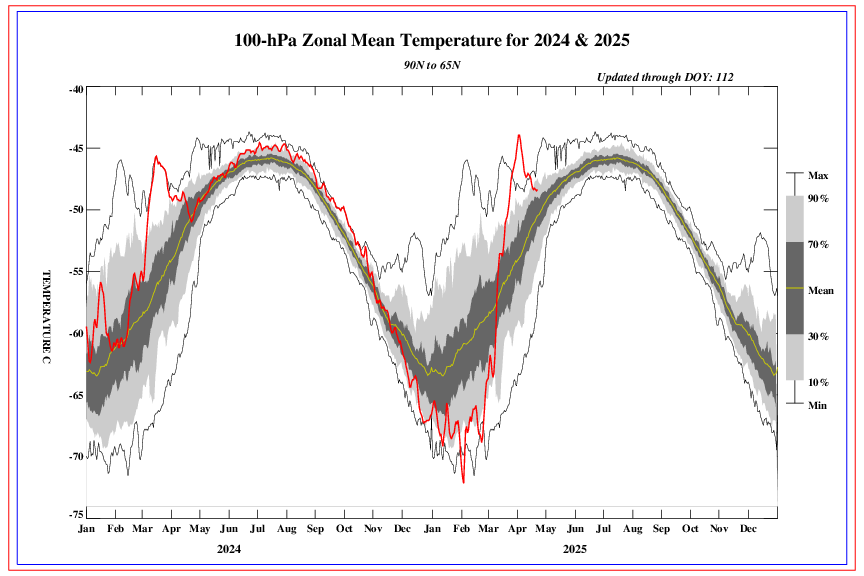
There was a record temperature drop above the 65th parallel in the lower stratosphere.