By Robert Vislocky, Ph.D
After every tragic meteorological event there will inevitably be the alarmist cries that climate change was a substantial influence. The recent late-season tornado outbreak of Dec 10-11 is no exception. Usually most of these are appeals to emotion with no data to support the relationship between extreme weather and climate change. However, this tweet from Michael Mann pointed to a 2019 peer-reviewed study titled “Increasingly Powerful Tornadoes in the United States” by Elsner et al.1
This study, not so surprisingly based on the title, claims that tornado power has increased 5.5% per year on average in the period from 1994-2016 as displayed in Figure 1 below: https://myweb.fsu.edu/jelsner/PDF/Research/ElsnerFrickerSchroder2019.pdf

I found this result to be intriguing in the least, especially in light of the observation that intense tornadoes (EF3-EF5) appear to be declining in frequency. So I investigated further and did a bunch of number crunching with the actual tornadoes dataset available from the Storm Prediction Center (SPC), downloadable from the following web site:
www.spc.noaa.gov/wcm/data/1950-2019_actual_tornadoes.csv
According to the article, power for a tornado is computed using (i) an estimate of the wind speed (taken from the mid-point of each EF category’s wind speed range, or 97 m/s in the case of an EF5 which is unbounded), (ii) the area impacted by the tornado (computed by multiplying the path length by the width), and (iii) an estimate of the fractional path area for each EF category (for instance, an EF3 rated tornado will actually spend 53% of its life as an EF0, 27% as an EF1, 13% as an EF2, and only about 7% as an EF3 on average). These fractional estimates for each EF tornado rating can be found in Fricker & Elsner2: https://journals.plos.org/plosone/article?id=10.1371/journal.pone.0131090
It is item (ii) that will be the focus of this article, namely the historical path length & width data. At first glance going through the entire history, it was surprising to see so many tornadoes that happen to have a path length equal to 0.1 miles and/or a width equal to 10 yards. It’s almost as if these were some kind of default (or minimum) values that were assigned if the actual path length (PL) or width (PW) were unknown or not measured. The data below indicate the percentage of the time these values occurred within various time periods in the dataset. Keep in mind the authors’ results were for the period 1994-2016.

Anyone notice a big problem?! Of particular interest, it appears the discontinuity in PL occurs right when the F-scale was replaced by the EF-scale in January 2007. Digging deeper, shown below are the values for PL & PW at the 25th & 50th percentile levels for all tornadoes (EF0-EF5) across two time periods that span the authors’ study.

Results clearly show that the pre-2007 path lengths & widths are contaminated with an abundance of very small path lengths = 0.1 mi and path widths = 10 yd. It is meteorologically implausible that path lengths would increase by 2-3 times or that tornado widths would increase by 50% in just 13 years. Climate change is not that powerful! Unfortunately, this bias appears at higher EF rated tornadoes (EF2-EF5) as well.

The effect of the faulty path length & width data should be obvious for a study that spans across the two periods. Namely, the tornado energy dissipation data in the first part of the study (1994-2006) will be artificially low compared to the second part (after 2006) resulting in a false upward trend. As a result of this finding, the conclusion from the authors that tornadoes are becoming increasingly more powerful should be rejected outright.
Another minor flaw in the study is that the authors only plotted annual median, quartiles and 90th percentile tornado powers instead of plotting the sum total annual power. Using the former can result in misleading conclusions, especially if the number of tornadoes is increasing or decreasing through the time period. For example, suppose a given year had 100 tornadoes in each EF category and the next year had 200 tornadoes in each EF category. Plotting the median power or the 90th percentile value would show no increase from one year to the next, whereas plotting the sum total would provide a clearer picture.
Interestingly, assuming that the post-2007 data are reasonably representative of what truly occurred, below is a plot of total annual tornado power for all tornadoes (EF0-EF5) during the period 2007-2019 using the identical methods described in Elsner et al. Although the result shows a declining trend, keep in mind that this decline was not statistically significant. Unfortunately we will need to wait 10-20 years or more to find if a trend emerges. Hopefully, the NWS can take steps to ensure consistency in path length & width data (and EF ratings) going forward.

References
1Elsner, J.B., T. Fricker, and Z. Schroder, 2019: Increasingly powerful tornadoes in the United States. Geophys. Res. Lett., 46, 392–398.
2Fricker T, Elsner JB (2015) Kinetic Energy of Tornadoes in the United States. PLoS ONE 10(7): e0131090.
Disclaimer
I don’t receive any money from big oil and I’ve never met the Koch Brothers.
so Mickey Mann thinks the world started in ’94?
Looks like Mickey Mann, a lot like griff and the other trolls, never actually reads the studies he promotes.
As long as the title suits him, that’s enough.
This is Mannian / Mickey Mann science at it’s best.
If it wasn’t for scientific fraud, Mann wouldn’t be able to do anything scientific.
” scientific ” 🙂
With this, Mann has abandoned any guise as a scientist, and has gone full preacher. But combining data sets, and not accounting for a major discontinuity between them is just his personal style.
Mann may very well have inspired these authors to abandon scientific rigor. They had to be aware of Mann’s hiding declines, splicing records, and using contaminated series upside down if they yield the sought after results.
Mann, along with the rest of the team, in turn, got the horribly compromising advice about the importance of lying and cheating in advancing theories in science from the late Dr. Schneider who isn’t remembered for much else, except he was on board with Holdren during the big cooling scare. He quickly switched to warming because it paid better.
p-hacking which came into its own with climate science when they needed to find upward trends in the white and red noise they got as data, is probably a good way to find these discontinuities to exploit. If the data beyond the discontinuity goes the wrong way, easy peasy, turn it upside-down.
Mann will read this rebuttal or be told about it I am sure. Why doesn’t dear Michael come on here and discuss the 2 different analyses.
same reason they’re still waiting for the discovery documentation in court.
The “harry read me.txt” file from the climategate files shows what lengths they go to to force disparate data sets to fit, and when they have gaps they essentially just make up data that fits their ideology to fill in. At least the author of that file frequently acknowledged what a mess it was.
The question I have is where were the peer reviewers for the Elsner article? It took all of 15 minutes looking at the historical path length & width data to know it was corrupted before 2007. If there were tornado experts reviewing the article you think one of them would know this about the data.
Thanks for your informative post, including stuff I’ve never heard of before, like path width of tornadoes… someone measures that stuff???
Estimates is the word you are looking for.
An estimate is neither measured nor observed.
It’s a small field.
If you want to find the peer reviewers of this paper you can probably google the names of the paper’s authors. Anyone who has co-written other papers with these authors, but weren’t in on this one, probably got to do the peer review.
Experts? Far too many of the so-called climate scientists of today are not physical scientists but rather statisticians and programmers. They have no experience base from which to make judgements that experts are supposed to be able to do. They don’t even understand that when laying random boards end-to-end to create a support beam the uncertainty in the overall length is the sum of the uncertainties in each individual board. They think the uncertainty is how precisely they can calculate the average value of all those random boards. And it just goes on from there. None of them knows how to calculate the uncertainty in the annual sum of tornado power based on propagating the individual uncertainties of each tornado into the final sum. They just assume that all uncertainty is random and cancels out in the sum.
“not physical scientists but rather statisticians and programmers”
You will give programmers and statisticians a bad name. If any of these so called climate scientists were either good programmers or good statisticians they would have stopped producing this rubbish years ago. No these people are not logical thinkers at all.
I recall a conversation with Tamino from Open Mind years ago where he plotted Antarctic ice extent and “showed” a decreasing trend. It was obvious to me the early years were coarse estimates of no value. The early year extent was a flat line for many years…but Tamino didn’t see it. Or didn’t want to admit it. I think understanding data is a skill in itself.
For reference (if you can stomach it)…
https://tamino.wordpress.com/2010/10/16/history-of-arctic-and-antarctic-sea-ice-part-1/
Its enlightening how the alarmists respond in this thread to such an obvious criticism.
Tim. I followed your link and read the post and comments. The key problem is contained within the line: “I combined these with NSIDC satellite data since 1979 to form a continuous time series from 1870 to the present.”
With no error estimates on either series and no overlap this whole exercise is pure crap. I totally reject the whole analysis and while it is good of you to point out the glaringly obvious discontinuity at 1979, I think you are perhaps guilty of trying too hard to be reasonable and a better approach would be to call it all out as bollox right from the start.
This type of splicing of datasets is at the root of the whole hockey stick problem. The only support for splicing is contained in the overlap – if the overlap between any two series is independent, consistent and significant – with all the caveats about monotonically changing time series and spurious correlations and so forth – then and only then might it be worthwhile to splice some data, but really this bollox has gone on for too long and should be called out for what it is.
Little Mikee&Co. simply pushing the same lies and crap.
I did not know that the usual suspects had discovered a Yamal tornado in 2007!
Thank you Dr. Vislocky for clarifying their customary level of statistical obfuscation.
“customary level of statistical obfuscation” Like that phrase! Going to shamelessly steal it.
A lot of people, mainly lukewarmers, like to call it “statistical error” or “statistical ignorance”. But it never is. It is always statistical malfeasance, intentional.
While tornado deaths may have been reduced by better detection and warning systems, the US population has also more than doubled since 1950. Regardless of the number of deaths caused by tornadoes there has been a slightly declining trend in severe tornadoes (EF3 – EF5) since 1950. https://www.ustornadoes.com/annual-tornadoes/
Do you wonder how/if technology measures tornadoes differently over time?
Ba-hahahahahahahaha!
Coming from serial disinformer Mikey, that’s a laugh riot.
I am sure that Michael Mann will quickly point out the peer reviewed scientific study was actually a pile of excrement in his next tweet. Unless he WANTS to promote excrement… In which case no corrective tweet is EVER forthcoming…
There are millions of Africans that are starving as they try to eke out a living at subsistence farming on very poor soils.
We should start a GoFundMe campaign for Mann to embark upon a 5-year lecture tour in Africa about global warming. The areal extent and depth of the manure that he spreads should allow them to feed their families for decades.
Afghanistan or NW Pakistan would be better.
Give him a folding soapbox and a Bedouin outfit. One with a big circle with a small red dot at it’s center, front and back.
Oh, make the maximum weight for the folding soapbox about 145 pounds. That should keep manniacal talking fast.
Sent back to Yamal to lecture birch trees is another option.
Tell him there are no mosquitos or wolves near where he’ll camp…
It’s a lie of course, but far less than his own lies.
In computing gross tornado energy totals per unit time, I would hope that actual wind energies are used rather than the EF scale as a linear measure of storm strength. The EF scale actually grossly understates the energy of storms by using a flat differential in windspeed per step, whereas wind energy increases by the square of the wind speed increase.
For instance, using the top end of each increment in the EF scale compared to the top end of the next lower increment, from EF-1 (85 mph) to EF-2 (110 mph) the increase in wind speed is 29.4%. From EF-4 (165 mph) to the highest EF-5 (artificially limited to greater than 200 mph), the velocity differential is only 21.1%.
Yet using the wind energy differentials, the step from EF-1 to EF-2 has an energy increase of 67.5%, and the step from EF-4 to EF-5 has an energy increase of 46.9%.
The difference in energy of an EF-5 compared to an EF-1 is 454%.
So consequently, the energy, independent of path width or time, of an EF-1 storm is negligible compared to the energy of an EF-5 storm. Yet people who are not familiar with physics are going to think of the scale as linear rather than increasing as the square of velocity.
Same factor applies to hurricanes, such that most people get all atwitter over a Category 1 hurricane headed their way, not realizing that the wind damage from a Cat 1 cyclone is negligible to even a Cat 3 or Cat 4 storm, let alone a Cat 5 cyclone. Most of the damage from a Cat 1 hurricane is excess rainfall, not wind.
I followed the power formula used by Elsner, which mimics the PDI formula used with hurricanes. The wind speed was the mid-point in the EF categories but was cubed once input into the power formula. These were the exact inputs used:
EF0 = 33.8 m/s ^ 3 = 38,614 (m/s)^3
EF1 = 44.0 m/s ^ 3 = 85,184 (m/s)^3
EF2 = 55.2 m/s ^ 3 = 168,197 (m/s)^3
EF3 = 67.5 m/s ^ 3 = 307,547 (m/s)^3
EF4 = 81.8 m/s ^ 3 = 547,343 (m/s)^3
EF5 = 97.0 m/s ^ 3 = 912,673 (m/s)^3
Keep in mind that a tornado rated EF5 in the database, for example, won’t spend it’s entire journey as an EF5. Studies done by the NRC show that an EF5 will spend 54% of its life as an EF0, 22% as an EF1, 12% as an EF2, 7% as an EF3, 3% as an EF4 and only 2% as an EF5. These must be taken into account when integrating along the entire path length and computing the total power of the tornado in its entire life span. This computation is detailed in the two references.
Bob, why cubed ? That would be energy based on scaling up the depth in addition to the cross sectional area….
Good question. Squaring gets kinetic energy or joules, while cubing gets power or joules per second, at least in the appropriate formulas from Elsner & Ficker. I’m not sure it’s been conclusively shown which one is more correlated to actual property damage.
One factor missing in both formulations is the movement speed of a tornado which can vary considerably. Surely I’d rather have a tornado whip past my property at 50mph than slug through at 10mph, and the latter would dissipate more energy & cause more damage given the same path length, width & wind speed.
Cubing could make sense to use in acceleration computations but not in wind energy – ie kinetic energy – computations.
Could it be that squared is appropriate for energy against an area and cubed for energy associated with a volume? I guess I’m thinking that the wind hitting the front side of a barn or house exerts a force against the area of the structure but the backside of the structure also sees a vacuum which causes a force to be exerted on the backside of the structure. A straight square of the wind speed wouldn’t seem to capture all of the forces at play.
Where am I going wrong?
Mickey can’t be monitoring that tweet: there are negative replies slating his assertion, including a link to this article! Surely Manntastic would have blocked them all by now?
Funny story. I first saw the Mann tweet on someone else’s twitter thread as she reposted his tweet. I replied to her thread and politely showed why the chart was erroneous being based on corrupt data. Mann must have seen this and blocked me!! Just shows how petulant the Mann is and how blind-sided he is to any opinion/data that challenges his biased notions of the relationship between climate change & extreme weather.
Before I got banned from Twitter, I made one mildly critical reply to one of Manntastic’s tweets and he blocked me straight away. As you can imagine I was inconsolable with grief (or some such).
Watching the petulant child throw his hockey stick out of his pram is always amusing.
“the petulant child throw his hockey stick out of his pram”. VERY good!
” Mann must have seen this and blocked me!!”
This is not how science works Mickey, as a “scientist” you would normally seize on this opportunity to point out the errors in Mr Vislocky’s findings.
Running away with your fingers in your ears endears you to no one.
Mr Vislocky wins.
The first reply is from an activist climate scientist
“Out of the climate scientists on here, my voice is one of the most desperate and the most like the scientists in #DontLookUp. I plead, I curse, I make myself vulnerable. I point steadfastly to the meteor. Ironically, this limits my access and exposure in the mainstream media.”
Pretty sure that sort of shrieking is more likely to get you on the tele, unless being mocked. The issue might be that there are so many wanting to do well for themselves wearing sandwichboards instead of doing science.
They love to pretend the meeja is silencing them. This is laughable – you can’t move for stories about CAGW all over the meeja, be it online, on TV, or in print.
Toto, it looks like the data is not in Kansas anymore, it has moved to Penn State and is under the control of the Wicked Witch Mikey Mann. Nothing funnier than desperate fools in a hurry.
Like other things in the past at Penn State, the data is being molested once again.
I am sure that Mann will be peddling climate change for the probable upcoming tornadic activity in the days ahead. I have been talking & tweeting about different subject matters for a while now in regard to a daily Index that I have developed. I call it the SSPW Index. It is based on different solar and space weather variables.
It shows promise in forecasting the state of things like the AAM, MJO, 850hPa 135E-180 and other atmospheric variables. Because they seem be affected by it. I started talking about the December extreme waves ahead for us weeks back. Below is a tweet from December 11th about the extreme December wave pattern and the MJO. I finally started to hashtag all references to the SSPW Index a while back. #SSPWIndex
This rising SSPW Index was causing havoc to the atmosphere, models as well, because a rising SSPW Index goes against La Nina tendencies. Hence my Phase 6-7 thoughts for December and +AAM. And warmth for the eastern USA. Tornadic activity
as well since the most severe outbreaks this year went hand and hand around these rising wave patterns.
Common sense says that if you believe that the sun possibly has an influence on the ENSO phases, winter-time state of the NAO or polar stratosphere, climate in general, then it should have an influence upon the atmospheric variables that develop these trend states. Extended atmospheric patterns = a climate response pattern.
The SSPW Index is a forecasting tool that can be considered along with any other model forecasts. It needs to be tweaked but it has a good foundation to build upon on.
Jim Hughes windweather sun and stratosphere on Twitter: “Daily #SSPWIndex average since July 1st is 4.27. The 3 day moving avg for 12/13? 11.59. Highest since early August. Wave drops next 2 weeks. But late December wave is much stronger! Highest value since early May. MJO’s looks similar. These waves matter #Natgas #tornado #wxtwitter https://t.co/vlLhBdYKQ8” / Twitter
Slightly OT, but the energy price tornado is really hurting the EU.
[TOTALLY OFF TOPIC – DELETED (just using the word tornado is a lame attempt at relevance- Anthony)]
You’re spreading Marxist disinformation again, Bonobo. You know very well what exploded Enron and it wasn’t the spot market. Enron was a scam, Bonobo, and you know it.
Why do you Marxists persist in trying to spread disinformation in the modern age when anyone who is interested can look up the facts and see that you’re lying?
Mope, Enron was a dereg scam, with a free-market spot-price mantra as Skilling said ¨on the side of the angels¨ .
Looks like Brussels are on the side of the free-market spot-price angels too. British Divinity in high places, what?
In what passes for your mind, everything short of full government control of everything is the free market.
In this case a government makes changes in regulations that actually dramatically increase the number of regulations fail, however since those who were in charge sold the changes as deregulation, you accept it as pure free market.
I still wonder if Biden et all starts are war somewhere after giving his Covid fight at the Federal level?
Omicron is a dud.
Enron was caused by dishonest accounting practices. Nothing to do with the free-market.
You’ve been schooled on this before, bonobo, and you know that you’re lying. Typical dishonest Marxist.
Just because you put the word “tornado” in your comment doesn’t make it the slightest bit relevant.
I went and had a look at that Twitter thread. A bad decision which caused a spike in blood pressure, but on the plus side it did confirm my decision to use Twitter only to regularly follow anything to do with St Johnstone FC, Patrick Moore and a couple more people whose opinions I respect.
Updated version of the chart:
Thanks Bob, I had been looking for that LINK it loads an Excel File.
Bob,see note above.
Nice chart. What graphing software do you use?
Yep, thanks Dr. Vislockey for an excellent review of this data. It’s clear to me that pusing these faulty “studies” is a political exercise. One would have to assume these authors and Dr. Mann himself would be sufficiently educated in math and science to discover the issues like Dr. Vislockey has discovered here.
On a related note, here in California the religious faithful in the church of catastrophic global warming spent the past summer proselytizing the impending doom California will suffer from permanent drought conditions. As I write this post, California is is poised to break a 30 year record for snow pack in our sierra mountains. The decans and priests of the church of catastrophic global warming have all retreated to their monasteries and remain silent. These disinformers will lay in wait for the next opportunity to crawl back out into the daylight and exploit the next natural cycle in our weather.
Note that the snowpack is at a record for late December. If it doesn’t rain again, the April numbers will not be good.
And, in another breakthrough for saving the Earth from Climate Change (TM), the California legislatrue has passed AS 1383, by which everyone will have to separate their food waste for separate processing, either in aerobic devices or in (large) compost heaps. According to the news, it goes into effect on 1 January, 2022. According to our trash company, the state hasn’t even finished the regulations. And I’m just cynical enough to think that some very important , elite, people, will be owning and operating the waste food processing plants, for a handsome profit.
The municipalities will end up owning the composting plants, with important facets of the collection and redistribution process run by whichever companies have the cheapest bid or the best political connections. It is a recipe for collusion, pork-barreling, corruption, mafia involvement, and plain old politician’s aphrodisiac of power over citizenry, not to mention constantly increasing user fees….
And just what is a “climate expert” ? It is not someone who is lauded by other “pat on my back, and I’ll pat on your back in return.” Look at Mann’s 83 page c.v. and you’ll see the definition of trope and cliche. https://michaelmann.net/about/cv
One definition of any kind of “expert” is to see how organisations like the BBC describe people. The BBC have a special department staffed by “experts” who can detect other “experts” a mile away.
Ask Matt the crapper Grath.
He’s a self appointed climate expert.
An expert picks up these faults better than an amateur. Their brainfarts smell like any other. They merely have the expertise to feel it coming on and avoid getting in the elevator.
Mikey trying to hide the decline again. He doesn’t learn from past mistakes.
Superb work, Dr. Vislocky!
Another article about the decline in strong tornadoes: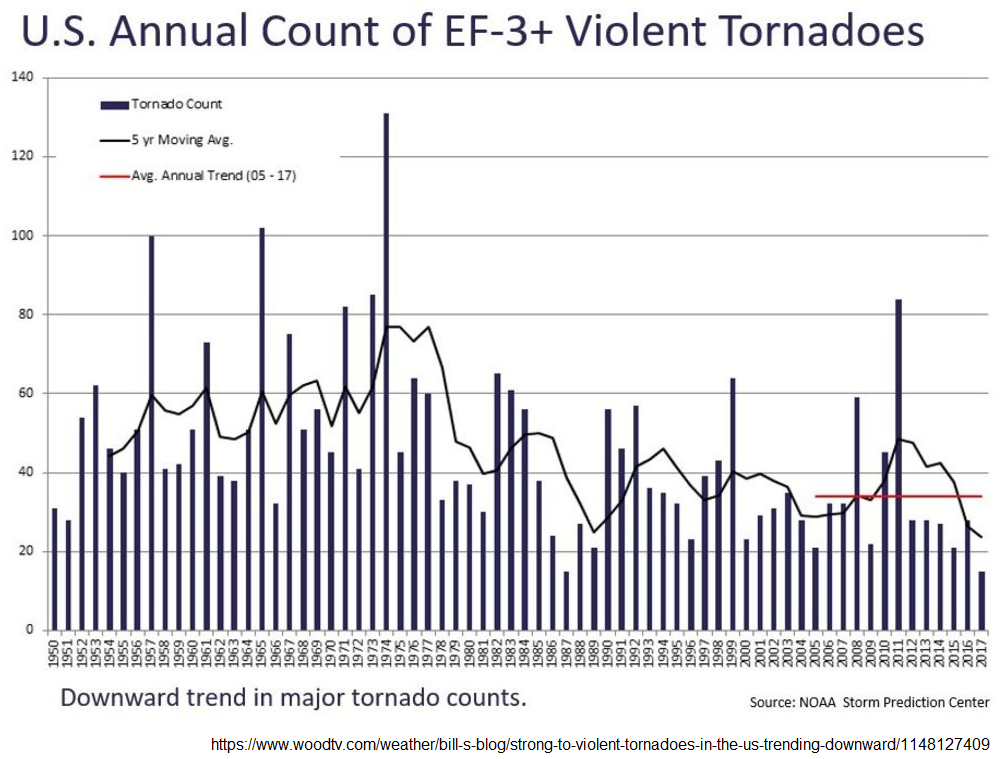
https://web.archive.org/web/20190331105309/https://www.woodtv.com/weather/bill-s-blog/strong-to-violent-tornadoes-in-the-us-trending-downward/1148127409
BTW, some readers might wonder that the tornado data is almost all for the USA. The reason for that is that the great majority of tornadoes in the world occur in the USA.
Probably because we have more SUVs than anyone else… 🤔
BTW, if someone (like Mann) has you blocked on Twitter, and you want to read his or her tweet, right-click it, and open it in a “private” or “incognito” window.
(Well, that’s how you do it when using a computer. I don’t know whether it can be done from a mobile device.)
Then, if you want to comment on it, despite being blocked by him, first find a reply to his tweet (in the “private” or “incognito” window), then copy the URL of the reply, and paste it into your non-private browser window (where you’re logged into Twitter). They you can post a reply to the reply, like I did here (even though Mann has blocked me).
Mann will probably never see the reply, but, unless Twitter shadowbans you, other people reading the thread will.
From the graph it appears that tornados like cooler weather.
It’s true. I ran a correlation between EF3-EF5 frequency and the average temp and found a fairly high inverse correlation (about -0.55 or so). Definitely liked the cooler springs & summers.
We took the children to the National Science Museum in Canberra many years ago, where one of the exhibits was about tornados. The claim was that these are far more common in Australia than people realise, but tend not to be reported because of low inland population densities.
This article, and Dave’s comment, prompted some further (cursory) reading, which tends to indicate that we only have around 5% of the number in the USA, and they are lower severity because they tend to occur with summer thunderstorms and higher clouds.
It’s their modus operandi to identify data, papers and articles that contradct the alarmist position and then quickly pump out a suitably titled paper to prevent any potential damage. There doesn’t have to be any actual support in the pumped-out paper, just the perception of support. If you have pal review and zero scientific integrity, it isn’t difficult. You can bait and switch, supplemented by post-hoc data selection, like the Doran and Zimmerman “97%” paper. You can use statistical methods tailored to give desired results, together with truncation of inconvenient data, as in Michael Mann’s hockey-stick. You can fill in missing data, or ignore the fact that there is missing data, as in this study. They know that if they keep up a high production rate of dodgy papers then they can swamp honest scientists.
Falsehood flies, and the Truth comes limping after it. – Jonathan Swift
Long term weather forecast you should know and what to do about it:
Space X founder Elon Musk reiterates aim to land people on Mars within FIVE to 10 years so he can establish a human colony before Earth ‘gets too hot for life in about 500 million years’
Very nice work and well written summary Dr. Vislocky.
Thank you.
Bob, I need the source data and methodology on that POWER graph. You didn’t provide it in the article. It needs to be there. Otherwise it is unsubstantiated. Please email it.
No problem Anthony. Will send it over when I get back home to my computer this evening.
And if anyone else wants the data I’d be happy to supply everything, unlike certain climate scientists who like to keep those things under lock & key, LOL. BTW, the methodology to compute tornado power is outlined in the references provided.
Bob,
I’d be interested in the references on how to calculate tornado power.
thanks,
Here is the detailed data & methodology used to compute the power of a tornado that I emailed to Anthony. Let me know if anyone finds anything of interest!
Hi Anthony, Charles:
Below is the methodology used to compute energy dissipation (power) of a tornado. It is the identical method used in the Elsner reference article:
https://myweb.fsu.edu/jelsner/PDF/Research/ElsnerFrickerSchroder2019.pdf
You can download my spreadsheet from the link below as it was too large to email (44mb):
https://docs.google.com/spreadsheets/d/10Hqjc9t_ID7wmQ-mNLcERUJQYMJ23Rzo/edit?usp=sharing&ouid=118241829553136652349&rtpof=true&sd=true
Methodology
Power is governed by the following formula:
P = A x D x sum(Wi x Vi^3, i = 0 to F)
A is the area in square meters and is computed by multiplying path length x width of the tornado.
D is the air density which was set to a constant 1 kg/m^3.
F = EF rating of the tornado.
V = wind speed computed from the mid-point of the EF rating (see note 1 below).
W = fraction of the path damaged by one of the EF categories (see note 2 below).
Note 1. Elsner didn’t list the mid-point wind speed values he used in his article, only the 97 m/s for EF5. The others I was able to find in his other articles: https://agupubs.onlinelibrary.wiley.com/doi/full/10.1002/2014GL060441
These wind speeds are cubed in the power equation, so the cubed values are shown here too.
EF0 = 33.8 m/s = 38,614 (m/s)^3
EF1 = 44.0 m/s = 85,184
EF2 = 55.2 m/s = 168,197
EF3 = 67.5 m/s = 307,547
EF4 = 81.8 m/s = 547,343
EF5 = 97.0 m/s = 912,673
Note 2. The EF ratings are basically the maximum intensity of the life of the tornado. So, for example, an EF2 will spend a fraction of its path as an EF0, EF1 and an EF2. The fractions over the life of each EF rated tornado are based on NRC calculations shown in the following article and displayed below. So, for example, an EF5 tornado will only spend 1.7% of its life as an actual EF5, 3.3% as an EF4, 7.0% as an EF3, 11.9% as an EF2, 22.3% as an EF1 and 53.8% as an EF0.
https://journals.plos.org/plosone/article?id=10.1371/journal.pone.0131090
EF0: 1.0 EF0
EF1: 0.772 EF0, 0.228 EF1
EF2: 0.616 EF0, 0.268 EF1, 0.116 EF2
EF3: 0.529 EF0, 0.271 EF1, 0.133 EF2, 0.067 EF3
EF4: 0.543 EF0, 0.238 EF1, 0.131 EF2, 0.056 EF3, 0.032 EF4
EF5: 0.538 EF0, 0.223 EF1, 0.119 EF2, 0.070 EF3, 0.033 EF4, 0.017 EF5
So here’s how to compute the main term : sum(Wi x Vi^3, i = 0, F) for each tornado EF rating:
EF0 = (1.0 * 38,614) = 38,614 (m/s)^3
EF1 = (.772 * 38,614)+(.228 * 85,184) = 49,232
EF2 = (.616 * 38,614)+(.268 * 85,184)+(.116 * 168,197) = 66,162
EF3 = (.529 * 38,614)+(.271 * 85,184)+(.133 * 168,197) + (.067 * 307,547) = 86,488
EF4 = (.543 * 38,614)+(.238 * 85,184)+(.131 * 168,197) + (.056 * 307,547) + (.032 * 547,343) = 98,013
EF5 = (.538 * 38,614)+(.223 * 85,184)+(.119 * 168,197) + (.070 * 307,547) + (.033 * 547,343) + (.017 * 912,673) = 114,892
So to compute the power of the tornado just use the values above for the appropriate EF rated tornado and multiply it by the path area.
Here’s an example using the monster tornado from 24-April-2010 which was an EF4 with a path length of 148.97 miles and a width of 3080 yards (must convert both to meters).
Power = A x D x sum(Wi x Vi^3, i = 0 to F)
A = (148.97 mi * 1609.344 m/mi) * (3080 yd * 0.9144 m/yd) = 675,203,425.4 m^2
D = 1 kg/m^3
sum(Wi x Vi^3, i = 0 to F) = 98,013 m^3/s^3 (see above for an EF4)
Power = 675,203,425.4 * 98,013 = 66.2 x 10^12 watts = 66.2 terawatts
Note that on the 2nd page of the Elsner article it referenced this tornado as having the largest power in the database and they also got 66.2 terawatts so my computation was spot on with theirs.
As for my spreadsheet, it started as the tornado database you can download from the SPC. The link was given in the article but here it is anyway: http://www.spc.noaa.gov/wcm/data/1950-2019_actual_tornadoes.csv
The columns that have data in colored font are the columns I’ve added over time. Column O contains the Power values (in gigawatts) for each tornado. Column P gives a running total count for each year. Path length is in column AD, tornado width is in column AE. EF ratings are in column U and column AN.
From 2016-2018 there were some 240 tornadoes with unknown intensities (listed as -9 in the data). In the past SPC used a formula (based on dollars of damage and path length) to fill in unknowns prior to 2016. I followed the same procedure to fill in these missing intensities which is presented at the bottom of the document in the link below. Of the 240 missing tornado ratings, 228 ended up as EF0 and 12 were EF1. Column AN has the complete EF ratings with no missings. There were no missing data indicated in the path length or width data, though I suspect that 0.1 & 10 may have been used for that purpose in the past but can’t get official confirmation on that.
https://www.spc.noaa.gov/wcm/data/SPC_severe_database_description.pdf
Let me know if you have any questions on the methodology or data.
Regards,
Bob Vislocky
Methodology was emailed to you & Charles. BTW, I didn’t include it in the article as it would have doubled the length, and I wanted the focus to be on their graph and how it was erroneous due to corrupted path data. The chart I posted was just in passing to show how their use of medians and quantiles can hide a decline on post 2007 data. Since the decline was not statistically significant the graph should not be re-posted with the intent of showing that tornado power is decreasing.
The conclusion comes first with these frauds. Then they massage and contort the data to fit the conclusion. It is standard fare now in climate “science.”
That’s CliSciFi to you, Dave.
Of course the tornadoes will get stronger, the better to push the carbon fraud, my dear. Will WUWT ever address the diabolical use of geo-engineering? A fourth grader can make a tornado – not the toughest challenge for geo-engineers.
So, another Hockey Stick “gone with the wind”.