This commentary was first published by the CO2 Coalition, December 3, 2021
Opinion by Kip Hansen – 2 December 2021
Member – The CO2 Coalition
Jeremy Bassis, an Associate Professor in the Department of Climate and Space Sciences, University of Michigan, Ann Arbor, recently published an Opinion piece in EOS , a science news magazine published by AGU (American Geophysical Union), titled “Quit Worrying About Uncertainty in Sea Level Projections”.
It is an interesting read but not because it presents good advice to the scientific community. Rather, it presents the case that climate and ice models, which are used to make projections, are not up to the task. While those who program climate models have been trained in what we know about the basic physics involved in the biggest sea level rise issue – ice sheet dynamics – the actual projections by those models depend on parameters that are loose guesses about things we don’t know. As a result, Bassis says “…recent studies using climate and ice sheet models are, more and more often, coming to very different conclusions about future rates of sea level rise and even about the sensitivity of ice sheets to future warming…” and because of that, he tells us:
“Large discrepancies among model projections of long-term sea level rise have spawned calls among the scientific community for scientists to work on reducing uncertainty. However, focusing on uncertainty is a trap we must avoid. Instead, we should focus on the adaptation decisions we can already make on the basis of current models and communicating and building confidence in models for longer-term decisions.”
I agree in part with Bassis on one major point: “we should focus on the adaptation decisions we can already make”. But I strongly disagree that these decisions should be based on current models and their outputs. It is not that I think differently than Bassis about the problems of the models, they have problems galore. If one reads Bassis’ opinion just to understand why the models perform so badly, one will have gained something useful.
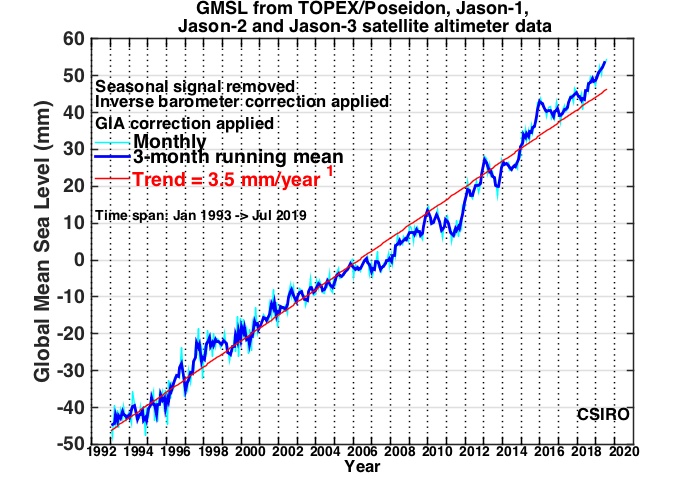
My disagreement comes from a different angle: Today’s observational data about global sea level rise itself reveals sharp disagreement between sea level research groups and measurement methods. NOAA says tide gauge records for the U.S. tell us the global absolute sea level rise for the 20th century has been 1.7 mm/yr. NASA’s satellite measurements claim 3.4 or more mm/yr, about double NOAA’s figure. Simply put, there is vast uncertainty about how much the sea has risen this year, last year and the last 50 years….we don’t need to look to the future for uncertainty about sea level rise.
The only truly dependable measure of sea level rise is that obtained from tide gauges – these gauges reliably tell us what the height of the water’s surface is compared to the land to which the tide gauge is attached. That measurement is called local Relative Sea Level (RSL). All RSL is local and strictly speaking applies only to the single point at which it was measured.

The only sea level of concern to ports, municipalities, states and their governments, planning committees, city engineers and port authorities is Relative Sea Level measured at their precise location. That RSL is reality – it is a fact – it is really happening, right there, right now. The historical record of that RSL for that location is also reality – it is their reality – those past RSL measurements are also facts, they happened. Of course, historical records were created using less precise tools than current measurements, but they are the best we have and while they lack some of the precision of modern tide gauge records, they are generally dependable and represent data that informs us of the magnitude of that locality’s RSL changes reliably.

Thus, using reliable data of changes in RSL — comparing observations of the present to observations of the past — local authorities can easily predict short- and medium-term changes in sea level for their locality. That fact is based on simple physics – the water level of the world’s oceans is not capable of rapid, decadal-scale changes which would overwhelm local sea level dynamics. So, with reliable predictions of future local Relative Sea Level rise, localities can and should plan and carry-out sensible no-regrets adaptation measures based on the factual changes, past and present, of sea level at their port, city, county or state.
In order to make sure that the adaptation carried out is addressed to the right problem, that it is solving the right problem, more data is required.
And globally?
One would think that if we looked at all the tide gauges of the world and combined all their measurements in some manner this would tell is how quickly and by how much Global Sea Level is rising. Unfortunately, that is not the case. Why? It is because tide gauges measure that all important metric local Relative Sea Level – the point at which the water’s surface hits the land. So, if the water rises (as it does every tidal cycle and every time a storm hits and the wind blows), RSL sees a rise. Likewise, if the land (or the pier or seawall to which the tide gauge is attached) subsides (moves closer to the center of the earth), RSL also sees a rise. And if the land rises up, as it does in Alaska, RSL falls. This relationship simply means that we cannot determine changes in the actual level of the sea – the distance of its surface to the center of the earth — unless we know if, how much and in what direction the land itself (or the dock, pier, or whatever structure to which the tide gauge is attached) is moving.
The recent flooding of the City Dock area of Annapolis in Maryland gives us an educational example. It was caused by exceptional tides at the end of October 2021 (see tide chart several paragraphs above). This area of Annapolis floods every time there is an unusually high tide. Why? … because it is mere inches above normal high tides for the area. The media blames this on climate change induced sea level rise. However, global sea level rise did not inspire Annapolis to build this iconic shopping area only a few inches above its normal tides. Nor did global sea level add much to their current problem. How do we know?

NOAA’s CORS Network supplies the data we need. Using GPS stations, running continuously for years, the CORS Network is able to discover the long-term movement of land masses and of specific locations (such as the structures to which tide gauges are attached). These CORS stations can measure movement in three dimensions – North and South, East and West, and up and down. The up and down measurement is called Vertical Land Movement (VLM). It takes years of CORS measurements to determine real long-term trends. Knowing VLM then, allows us to know “how the sea level is changing in relation to vertical motion on land.” [ see previous link ]

For Annapolis? The calculated rate of long-term Relative Sea Level Rise at the tide gauge for Annapolis is 3.71 mm/year or 1.22 feet in 100 years. Using continuously operating GPS reference stations (CORS), Richard Snay and his team at the U.S. National Geodetic Survey found that Annapolis and surrounding areas are subsiding, sinking towards the center of the earth, at a rate of 3.05 mm/year or about 1 foot in 100 years. [ref: Snay et al. (2007)]
Simple subtraction informs us that the absolute rise in the sea’s surface at Annapolis – how much higher the surface of the sea is from the center of the earth – has been only about 0.66 mm/year. That 0.66 mm/year is equal to 66 mm/century or 2.6 inches – in 100 years.
[ Per year that is 26/1000ths of an inch or ½ the thickness of U.S. dime (ten cent piece) each year – not totally inconsequential, but nearly so. ]
So, what happened to the 1.7 mm/year or the 3.4 mm/year of NOAA’s and NASA’s Global Sea Level Rise? We don’t know. Neither of those amounts of absolute sea level rise – increase in the height of the surface of the sea – actually arrived at Annapolis. The same is true for many other ports. The tide gauge at The Battery, at New York City, shows a RSL rise of about 11 inches over the last 100 years – but it is subsiding at 1.35 mm/year. Only 6 inches of the century’s rise is due to a rise in the absolute sea surface height.
This is repeated all over the world. Tide gauges have been used to calculate global absolute sea level rise but are not suitable for the task – they give erroneous results when perceived as global Sea Level Trends.

Unless…. unless they are corrected for the VLM of the actual structure to which the tide gauge itself is attached. Only then do you have a sufficient ground truth to know how much of the observable local Relative Sea Level rise (or fall) is due to VLM and how much is due to absolute sea level rise. Even then, you only really know for that specific location. We also know, once this correction has been performed, the causes involved and the magnitude of each cause – for Annapolis, four-fifths of their sea level rise problem is subsidence, the land sinking. For Annapolis to concentrate their policy efforts on reducing fossil fuel use to slow climate change and thus avoid increased high tide flooding is nonsensical. Their real problems are low elevation of waterfront properties (compared to water levels) and subsidence (which may not be solvable). The actual rise of the sea there over the last 100 years is less than three inches and that portion of the RSL rise could be mitigated by a single row of red bricks laid on edge (3½“) or a normal street curb (6”).
I fully agree with Bassis that we don’t have to worry about the uncertainty in sea level projections whether generated by models or from expert solicitation. But we certainly do have to worry about our uncertainty about sea level – today’s sea level – and its rise or fall over the last century, the knowledge which is needed to inform us about what to expect in the future. Satellite derived absolute or eustatic sea level rise is simply not appearing in reality – not appearing where the sea meets the land. Even NOAA’s and PSMSL’s tide gauge measured sea level rise is not appearing in reality – as actual rising sea surface – when it has not been corrected for VLM, ideally by Continuously Operating Reference Stations (CORS) attached to the same structure as the tide gauge (GPS@TG(ss)).

What the world needs is accurate actionable local data on their own local relative sea level rise and its contributing components so that they can come up with sensible no-regrets adaptation plans for their locality.
NOAA and its National Geodetic Survey CORS group along with the contributors to the Permanent Service for Mean Sea Level know what is needed to gather and process that data. They need more funding and more support from their respective governments to speed the installation (and maintenance) of Continuously Operating Reference Stations installed on the same structures as long-term operating tide gauges. Only when there are adequate numbers of these GPS@TG(ss) stations evenly geographically distributed will we be able to obtain an adequate understanding of global sea level rise derived from ground-truthed facts – not models that depend on parameterization or fabulously processed and adjusted space-based proxy measurements.
Author’s Comment:
I am not a sea level rise denier – the seas are rising and have been since the end of the Little Ice Age – at somewhere between 8 and 10 inches per century (maybe). Some places are in big trouble already. Other places are not. The biggest factors are geology and history.
Pragmatically, localities need to concentrate on their own problems and solutions. No matter what my little town does to mitigate global warming, it will not solve our problems along our tidal waterfront – ever. We need to solve our local problem locally. You do too.
But first, you have to have a true understanding of your local problems and possible solutions. For that, you need accurate facts – reality-based facts.
It may seem odd to you (it was to me) to demand reality-based facts. You may have been under the misguided belief that facts, by their very nature, were already reality-based. That, however, is no longer true, not even in the sciences.
Thanks for reading.
Kip Hansen is an expert on sea level and sea-level rise. Prolific author of numerous articles on the subjects. WUWT lists 445 commentaries and articles.
He has spent much of his adult life at sea, first as an officer on a merchant ship, and later as a USCG-licensed captain in the Caribbean, where he sailed with his wife while doing humanitarian work (mostly Dominican Republic).
He is a proud member of the CO2 Coalition.
This commentary was first published by the CO2 Coalition, December 3, 2021

Considering subsidence distracts from the green blob’s obsession with greenhouse gasses. Of course, reality tends to do that.
A step in the right direction would be to discard all models of SLR and go back to collecting real data at the source. Models do not generate data!
that and tide gauges…direct measurement….doesn’t show acceleration…unless you cherry pick
Long term there is some acceleration in the tide gauge record. It’s about 0.01mm/yr² or about one tenth what the people running the satellites claim. The satellite record is only 30 years and extrapolating the 0.098 mm/yr² acceleration they claim out to 2100 isn’t realistic.
And yes, follow the link, they really do claim 0.098 and not 0.1 mm/yr². Do they really expect us to believe they have it down to a precision 0.001mm?
Oh, Here’s the LINK to the abstract from their 2018 paper where they said acceleration was 0.084 mm/yr. So they managed bumped it up 0.01 over the last two or three years. Besides that, ten years ago the folks the Colorado University were questioning why acceleration wasn’t detected in the satellite era. Follow this LINK and scroll to the bottom to see that acceleration was negative ten years ago. The acceleration they are claiming today is a function of data manipulation and not observation.
Steve ==> Do you have a link to the PSMSL list of CGPS corrected tide gauge stations?
Peltier GIA data sets
As I recall you can pick out tide gauges from the main list using the Peltier data. But an already corrected list of tide gauge stations? No.
Steve ==> Incredibly useful link — but Peltier fails to capture the subsidence at the dockside where the tide gauges are actually attached. Far better than nothing, of course, and can be used to gain a better but not best idea of what is really going on.
Thanks!
Here is a map. https://www.sonel.org/-GLOSS,81-.html?lang=en
DHR ==> Thanks for the link. Here’s the rub — as I mentioned to Steve above, these PSMSL stations have data for correction for “nearby” GPS stations. Take a look at the various pages for Kitty Hawk
https://www.sonel.org/?page=maregraphe&idStation=2154
It is good data but there are three differing GPS solutions, none of which are GPS@TG(ss) (only nearby GPS). Satellite data differs from Tide Gauge by 2.6+mm/year.
That difference alone is greater than the expected total absolute global Sea Level Rise.
” That difference alone is greater than the expected total absolute global Sea Level Rise. ”
This statement makes few sense.
There are over 1,500 tide gauges in the PSMSL directory.
You can’t consider only one of them, just like you can’t consider only one grid cell in the satellite data.
Only a global average of satellite and gauge data within the same period will lead to a valuable comparison.
Bindidon ==> Averaging uncorrected data simply gives one an uncorrected “answer”. Each tide station has its own as yet unknown VLM that needs to be used to adjust their individually different relative SLR.
The fact the even the “nearby GPS” solutions, by different groups, for an individual station have that range of difference means that it will not be possible to find mm scale single number solutions for global sea level rise from such data.
The very idea that averaging massive numbers of already averaged measurements, measurement known to be in error to magnitudes equal to or exceeding the magnitude of the sought signal, all from different locations taken at different times, that idea is a fallacy of great import.
Even in CliSci, one cant make silk purses out of pig’s ears.
a) ” The fact the even the “nearby GPS” solutions, by different groups, for an individual station have that range of difference means that it will not be possible to find mm scale single number solutions for global sea level rise from such data. ”
Typical guessing, sustained by nothing technical, let alone of scientific value.
I just need to read above:
” Steve ==> Do you have a link to the PSMSL list of CGPS corrected tide gauge stations? ”
to understand that you are a novice in the field.
Maybe you look at this file describing GPS locations and their velocities (it is not quite what I use, but very near to it):
https://drive.google.com/file/d/1pt-OF8xBbSahXexI5vlL0twqyhI5hXPl/view
It is evident that when there are many GPS stations around a tide gauge, every software engineer lets his software automatically seach in the GPS velocity data base for that GPD station nearest to the gauge considered.
If no GPS is present within a given range around the gauge, it is automatically dropped off the considered gauge set.
*
b) ” The very idea that averaging massive numbers of already averaged measurements, measurement known to be in error to magnitudes equal to or exceeding the magnitude of the sought signal, all from different locations taken at different times, that idea is a fallacy of great import. ”
When someone writes something like this, the engineer automatically thinks that the writer has little experience in the corner we are talking about.
You should tell what you wrote above to e.g. Roy Spencer, who averages 9,504 temperature measurement grid cells with sometimes tremendously different behavior into one global series well known to you, and which you never would dare to question.
The same is valid when averaging about GHCN daily stations worldwide.
And a comparison between time series out of UAH grid data and the average of all available GHCN daily stations’ data looks like this:
Maybe you start learning how averaging really works, before you discredit it.
Here is finally a graph showing a comparison of long, professional work by Dangendorf & alii with a quickshot by statistician Grant Foster, together with my simple layman evaluation:
We certainly are all wrong, aren’t we?
Mr Hansen: no one expects from a journalist to do such a job.
But it would be fair from your side to refrain with such superficial and superfluous sentences.
Great tute on GPS locations and use. Much was new to me.
Bindidon ==> If you have a real name, you may email me at kip at the domain i4.net. I’ll end you a list of links on all those points.
Averaging bad data gives bad results
What’s the margin of error for a tide gauge? I’d be willing to bet it’s much larger than 0.01mm.
How do you measure .01mm of sea water when moving?
If I remember correctly, from a previous Kip Hansen article on that very subject, NOAA’s specification say 2.4 or 2.5 cm.
No one measures 0.01 mm of sea water.
The 0.01 mm are the standard error you calculate when you average the data provided by hundreds of tide gauges and calculate the trend.
Depending on how long the observed period, the standard error can differ: from very low for a century to very high for 5 years.
For the sat period starting in Jan 1993, the trend I calculated in January for the average of all gauges having sufficient data for the period till Dec 2020 is – without correction for vertical land movement around the gauges:
2.9 ± 0.1 mm/year (very similar to the sat altimetry trend)
For the single gauge Kungsholmfort in Sweden, the linear trend is:
2.4 ± 0.8 mm /year
But this has nothing at all to do with what is really measured at the gauges. For example, the values measured at the Kungsholmfort gauge in 2020 were, in mm, from Jan to Dec:
204 329 233 125 193 13 61 38 69 -24 55 -46
That is the data relative to a mean determined by the PSMSL data survey.
Since the “margin(s) of error” (which is included in individual station measurements are small compared to linear or quadratic trends found over physically/statistically significant time periods, they change the standard errors of the trends and of the acceleration of those trends hardly at all.
From your 2018 link:
That is a substantial ±18% uncertainty range based on an extrapolation of a 2nd-order polynomial! It doesn’t appear to address the fit (correlation coefficient) of the quadratic equation to the data.
Clyde ==> That 2018 is Nerem et al. They have been searching for acceleration in Sea Level Rise for more than a decade — and always find it, no matter what the data set says.
Their projection of 24-30 inches of rise by 2100 is arguably physically impossible, as far as I understand.
Clyde Spencer, Kip Hansen
I understand your doubts.
But SLR eveluations were done not only by Nerem & co; for example, by Dangendorf & al. as well:
https://drive.google.com/file/d/1-ilhh3ov20tfb03P5ZKDHTzZuJ9rD4P8/view
(this is a copy I downloaded at a time it was not behind paywall yet).
When you read that paper, maybe you understand how much more than a simple tide gauge evaluation they did.
I downloaded their data, together with a very quick evaluation by Grant Foster (including VLM correction), and NOAA’s sateliite altimetry data.
Here is a graph made last winter by my spreadsheet calc:
On the graph, you not only see how small the differences between three so completely different SLR evaluations can look like.
What you also see is that the three similar series have different quadratic factors, leading of course to differing SLR values when evaluating the functions for 100 years:
sat altimetry: 49 cm
Dangendorf: 56 cm
Foster: 64 cm.
We have to consider Foster here, of course not because his quadratic factor is highest! Rather because as opposed to Dangendorf’s work, he considered PSMSL gauge data only.
*
This global mean SLR of 64 cm in 100 years does not tell us anything about how much SLR will happen locally at all the gauges.
I have computed long time ago the linear estimates for local SLR, gauge by gauge (without VLM correction):
https://drive.google.com/file/d/1kLZZQH-zQjkWMvwT72JxAM34cLPOUjMr/view
{ Caution: the trends are computed on the basis of their entire lifetime; you obtain quite different values when you compute and compare their trends over the same period. }
Maybe I have some time to calculate the quadratic fit locally for each gauge.
Such a job would give us an estimate of what could happen locally, of course under the condition that everything remains equal (what of course never happens).
This quadratic fit is a hint – not more, not less.
But don’t try to tell that to a project leader responsible for long range projections at a reinsurance company like Munich Re: s/he will laugh at you :-).
No problem to post links to all the data (but except Willis Eschenbach, no one is known to me on this blog who would be able to generate a valuable alternative to these evaluations.
How do the correlation coefficients of the quadratic fits compare to the linear fits?
Linear estimates
Altimetry: 2.7 mm/year
Dangendorf: 2.8
Foster: 2.9
All in all, the linear stuff gives for 1200 years about 50 % of an evaluation based on the quadratic factors.
Caution: these linear fits (like the quadratic ones above) are valid only for the period 1993-2015 because 2015 was the final year in Dangendorf’s study!
Oh… I meant of course 1200 months or 100 years.
You didn’t answer my question about how the 1st & 2nd order fits compare based on the correlation coefficients.
Clyde Spencer
I overlooked your question. The answer you obtained from elsewhere makes no sense at all, it’s redundant blah blah.
*
Let us compare the linear and quadratic fits for Dangendorf’s data (I can’t paste the spreadsheet, thus the screenshot):
The other XiSquares are somewhat lower.
“You didn’t answer my question about how the 1st & 2nd order fits compare based on the correlation coefficients.”
Bindidon let’s me take some of the easy ones.
As you have been told, several times that I know of, R values for trends are statistically meaningless because they change with the trends. I think even MoB has made that point. But the standard error of a trend, along with the standard distance from the actual to calculated value, both drop from linear to quadratic estimation, for sea level station data.
For an example, consider the 1980 on data from 1611400 Nawiliwili,Hawaii.
The standard error of it’s linear trend is for ~0.00487m*yr^-1. But the standard error of the linear component of it’s quadratic trend is ~0.00077,m*yr^-1, or ~1/6th as large. The standard distance from the actual to calculated values also drops. but not by as much. For straight linear trending, it’s ~ 0.0545m, but for quadratic trending, it’s ~0.0522m.
I can’t download freeware files, but the data can easily be so evaluated in them. However, all I remember you doing is eyeballing them, and then passing on your nonevaluative prejudgment. None is so blind….
https://tidesandcurrents.noaa.gov/sltrends/sltrends_station.shtml?id=1611400
BTW, Clyde, in the referenced eval, including the standard deviations of the individual data points in the quadratic evaluation increases the standard error of both the linear component and the acceleration component by all of ~0.5%. So, AGAIN, for the temp or sea level evaluations under serious discussion here, ranging the individual data points reduces the statistical durability of the resulting trends by hardly at all.
The satellite record isn’t what people think it is. The Jason 3 handbook says 3.4 cm accuracy, trying for 2.5….instrument drift a mm. per year….
https://www.ospo.noaa.gov/Products/documents/hdbk_j3.pdf
So everything CliScis say about .1 acceleration is nonsense….
DMac ==> I just love a reader that actually looks for the nitty-gritty real specs for these measurements. In my earlier essays on SLR I point out these things — but most readers skip over the technical details and don’t look at the documents, even when they are linked. Anyone actually reading the Jason Handbook realizes why I say “fabulously processed and adjusted space-based proxy measurements.” The numerous adjustments and corrections for confounders are all orders of magnitudes larger than the reported delta in sea level.
I’ll just pick on 2 of the several possible errors made by those who “want-to-believe” satellite SL readings are 1mm accurate…
1). You can NOT take a thousand readings with a radar and assume that you have statistically improved the distance measurement accuracy by a factor of the square root of 1000. You are already taking giga-samples per second and subjecting yourself to the illusion that your “measurements” are only the ones you write down. Some chirping tricks can be used to get the accuracy to about 1/6 of a wavelength, but most radar engineers will say 1/2 wavelength, older ones 1 wavelength…Some satellite sea level papers did not grok this. Jason-3 engineers and physicists certainly don’t make such an error in their manual.
2). Everyone knows tides are due to the moon’s gravity. But most people don’t know the continents also move up and down up to a foot a day as well, changing as the Earth-moon barycentre orbits the Sun. The distance from satellites to a very few ground stations are used by the GPS system to determine this correction. The ground doesn’t necessarily settle back within some fraction of a mm. so neither do the ground stations. If it did, there wouldn’t be crustal stresses that cause Earthquakes and volcanoes. So few ground stations are involved that the very many tide gauges around the world should statistically result in better averaged-out sea level accuracy than from the GPS ground stations.…
And that’s just 2….we haven’t gotten to path length changes by radar refraction due to atmospheric water vapor yet…the various methods that 20 foot non-random ocean waves are statistically “flattened”, the 5km microwave swath that can’t be used near shore (where the tide gauges are) and so on….
This is exactly what the climastrologers believe about temperature also: take enough points and uncertainty goes to zero. Total nonsense.
DMac ==> I have spent 1/2 of my adult life working and living aboard ships and boats — all on the seas (not rivers and lakes). I know what the surface of sea looks like on the calmest of days and it is not flat but have ripples and wavelets far exceeding the single digit mm’s.
Normally, on the high seas, winds are Force 3 to Force 5 with waves measured in meters and the surface rough with other sized wavelets and foam and all else. See images at https://www.eoas.ubc.ca/courses/atsc113/sailing/met_concepts/08-met-waves/8e-beaufort-scale/index.html
“You can NOT take a thousand readings with a radar and assume that you have statistically improved the distance measurement accuracy by a factor of the square root of 1000.”
My (possibly flawed) understanding of statistics is that it works that way IF each reading is independent (or at least generated with a wide-sense stationary process).
Kip,
Note that the technical specifications for the Sentinel-6 system have every page marked with the following:
“Proprietary information: no part of this document may be reproduced divulged or used in any form without prior permission from CLS.”
So much for open, transparent communication.
https://www.eumetsat.int/media/38625
Clyde ==> I wouldn’t make too much of that. The document is the intellectual property of a private company CLS — Collecte Localisation Satellites. The statement is the equivalent of standard copyright-type noticed here in the States.
No one is hiding the information — they’ve made it publicly available on the ‘Net.
Kip,
There is a difference in that our (US) copyright laws allow for “fair use,” which means that for news or scientific publications, reasonable, small sections may be used without explicit permission.
However, CLS stated, “… no part of this document may be reproduced divulged or used in any form without prior permission from CLS.” That means they have reserved the legal right to deny any use they disapprove of. Thus, they have made themselves potentially immune to any criticism, even open public discussion of errors, should they wish to suppress it.
I’m reminded of the Climategate debacle where one of the participants ‘justified’ withholding data requested through an FOIA with the remark, “Why should we allow them access when they will only use it against us?” [paraphrased]
Clyde ==> Hard to be really upset about the wording given that the document is openly available on the internet to anyone who wishes to see it.
DMacKenzie
You confound here accuracy and the standard error of an estimate over a (long) period.
Acceleration or just increase per year [ie steadily, if slowly, rising]?
Starting from no increase after ten years at an acceleration of 0.01mm/year the increase would be 0.1mm/year, after 100 years 1mm/year etc
It is important that the tide gauges be connected to a GPS on shore, which is not always the case and sometime it is non-functioning. A lot of the reported SLR is actually subsidence, especially along the east coast of most of North America. Additional, there are all the real barrier islands, little more than mobile sand bars, that migrate with the seasons.This is where observation is so important and for more than a day one time. Changing coastlines need to be studied continuously over the seasons and lunar phases in order to sort out the baseline.
PM-K ==> Absolutely right . . . models have their place, but they do not create data. Only the real world should be measured. This was ever the cry of Nils–Axel Mörner — the greatest of the pragmatic experts — true experts — on sea level. Who had the nerve to say “Let’s go look and see what we find.”
Yep, and go we did! And we found a lot to think about. Niklas was tireless in his search for data and if things had been different we were heading back to the Maldives.
PM-K ==> What a great man he was and an exemplary scientist.
and Feynman – “The Pleasure of Finding Things Out”
Exactly. Consult Pat Frank about dealing with ‘errors’ the size of the Annapolis case for estimating future problems there!
Isn’t that what the article suggests?
Models do not generate data!
Maybe not but they sure generate make work programs and good taxpayer incomes-
Queensland coastal communities to be under water within 80 years (msn.com)
Then there’s all the counselling and shrink services for the depressed, doomed and sundry Gretaheads etc
Oops, that was a motor boat going past.
Lion Heart ==> People will laugh, but one of the problems with remotely detected (proxy) Sea level Rise science is that one is called upon to measure a constantly moving surface. One of my Sea Level: Rise and Fall essays here explains this, The sea is almost never flat, it always has ripples and waves and swells many 0rders of magnitude greater than the signal they are looking for.
Good report, Kip, and thank you for your charitable service. “The sea is almost never flat,” is only part of the problem. The seas are contained in ocean basins, which basins are not only not constant, but they are very dynamic. Consider: 1. rivers dump sediment into the oceans, 2. undersea volcanoes erupt all over the sea floor, 3. tectonic activity distorts the sea floor (think of the Japan/Fukashima earthquake, the sea floor rose about 20 feet causing the tsunami), 4. deep trenches form where plates are subducted, 5.China is building new islands in the South China Sea, 6. boats keep sinking, and 7. bays and channels keep getting dredged. Sure, the physical state of H2O is important, and the sea coasts sink or rise, but try to measure all of the basin distortions. OK, try to model it if nothing else.
And, the ocean basins respond isostatically to the increasing weight of the water (and sediment) they contain, generally getting deeper in direct proportion the the depth of the water column, and probably developing fore-bulges on the edges of the basins.
Did you ever wonder about the driving forces behind the old ‘geosyncline’ model?
Ron ==> Yes, to say that sea level measurement is complicated and complex is an understatement.
NASA’s satellite measurements claim 3.4 or more mm/yr, about double NOAA’s figure. Simply put, there is vast uncertainty about how much the sea has risen this year, last year and the last 50 years….we don’t need to look to the future for uncertainty about sea level rise.
________________________________________________________________
Here’s an up to date comparison of the various iterations of sea level rise according to Colorado University’s Sea Level Research Group:
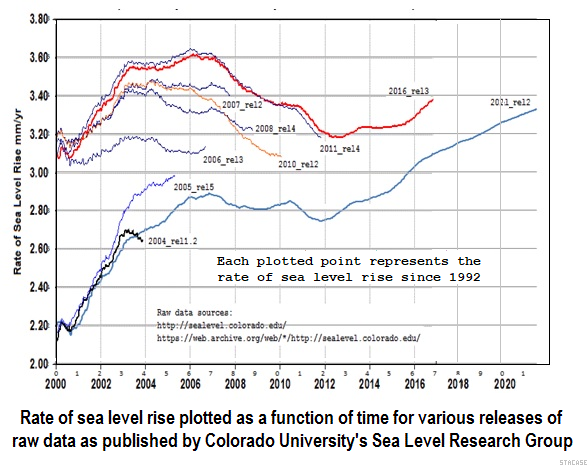
One has to wonder what is going on that causes every release of the Satellite record to change. The data from the several satellites hasn’t changed, it’s the interpretation that varies.
Steve ==> Yes and yes. You know that the reasons for this are many and varied. It is hard to explain the problems to the general readership. There have been a lot of good attempts here and elsewhere.
Part of the problem is that Nerem and his team at CU expressly start out trying to find acceleration — I don’t think they start in the right place — trying to see what sea level is really doing. Worse, they use a proxy measure (satellite data) that has necessarily been correted and adjusted for so many factors — many of which are mere guesses.
Mörner has the right idea — they ought to just go and look.
It is fascinating what you discover when you go and look and speak with the locals, many of whom have very long memories of exactly what their beach has been doing for a very long time. People who derive their living from the sea tend to be very familiar with its vagaries.
“Nerem and his team at CU expressly start out trying to find acceleration”
____________________________________________________________
Yes Colorado Unversity’ Sea Level Research Group (C-SLRG) you could pronounce that “See-slurg” has produced some very interesting titles for their publications:
Why has an acceleration of sea level rise
not been observed during the altimeter era?
Is the detection of accelerated sea level rise imminent?
Climate-change–driven accelerated sea-level rise
detected in the altimeter era
NASA Satellites Detect Pothole on Road to Higher Seas
Nothing like telegraphing what it is that you are all about!
Steve ==> There is a rule of thumb — “People find what they look for.” that applies to research (but not always, sometimes their fondest hopes are dashed.)
The upper lines remind me of the proverbial elephant’s trunk being waggled by manipulating coefficients in a model
Willis published an article here not too long ago that looked at this. His conclusion was that their claims are based on the measurements changes introduced each time a new satellite was added. They just switch to the data of the new satellite at that date and it trends differently than the previous great and best satellite. When he looked at the data of each satellite by itself, there was no acceleration of sea level rise in the record.
Here’s a further comparison. The graph linked below is simply the 30yr moving slope (trailing) for (a) Jevrejeva 2014 tide gauge sea level reconstruction and (b) HadCRUT4
The sea level changes clearly lag temperature by about 17-20 years or so. More importantly, the quasi-periodicity is quite evident in both time series. You can also see very clearly why you would look for sea level rise acceleration post-1992 – because its on an upswing.
Note also that Jevrejeva 2014 has not yet reached the peak rate of rise observed around 1960. Showing rate rises like this was a bit of an IPCC bust in the AR5 summary.
https://postimg.cc/McG6Kthm
3mm per year we are doomed, doomed I say.
There you go again with your defective reliance on empirical, real world data instead of the far superior modeling data produced by people who make a living crying wolf on climate change
(not everybody recognizes sarcasm, in case you’re wondering).
The humongous conceptual error made by ice sheet modelers is that they fail to take into account real world movement of ice sheets as determined by hydraulic engineering.
This is akin to someone looking at riverine flow rates during a wet period, and deducing from the higher flow rates that the upland areas must be running out of rainfall … when it is precisely just the opposite.
Ice sheets are simply semi-solid frozen water, just like liquid water in streams. Ice flows just like water, but with a much higher viscosity.
What drives the flow of liquid water, as well as semi-solid ice, is “head” – the elevational difference measured in feet or meters between the upstream fluid surface and the downstream fluid surface. This elevational profile is what engineers call the “hydraulic grade line”. The bottom surface profile can certainly affect total stream flow too, but in natural landforms it does not move around very fast. So what really drives water flow and ice flow velocity is the HGL. More head upstream as compared to head downstream, the greater the flow rate.
Therefore the ice sheet modelers fail to acknowledge that, given that the bottom surface profile of glaciated landforms changes very slowly, if the ice is moving more rapidly, it is NOT due to upstream melting but rather is due to a higher HGL upstream, or in other words, a thicker ice sheet upstream. Meaning, that MORE precipitation in the form of snow must be accumulating upstream, higher up on the landform, not less, to drive the flow rate to a higher velocity. And more snow means more ice, and that means faster moving ice.
But the knuckleheads doing ice sheet modeling could never pass a sophomore level hydraulics course that all civil engineers take, as well as MEs and ChemEs and anyone else who engineers fluid systems.
“…what really drives water flow and ice flow velocity is the HGL. More head upstream as compared to head downstream, the greater the flow rate.“
______________________________________
In other words, the amount of ice calving into the sea has everything to do with the amount snow fall in the interior and nothing to do with atmospheric temperature which on the ice caps is well below freezing nearly everywhere, nearly all of the time. Oh! Thanks for the hydraulic lesson.
I would modify that:
the amount of ice calving into the sea has everything to do with the amount of ice accumulating in the interior
Duane,
Few alarmists are familiar with the concept of “head;” except, perhaps, AOC!
Ab Man ==> ….pretty close to the dangerous edge, that last bit.
Over the edge, IMHO. Childish.
Duane ==> Thanks for filling in that side of ice sheet dynamics.
Anyone who has done homesteading-style hydro power unerstands the concept of “head” as well. It is not the amount of water flowing, but the difference in height between the inflow and the outflow points that equals power. Even a four inch pipe of water, with 100 feet of head, supplied tremendous power.
In the DR, we financed a project that ran an A/C generator for 21 homes, 24/7, with a four-inch pipe flow with 50 feet of head. (details are a little fuzzy, its been a lot of years)
Actually, Kip, flow rate matters too in terms of hydraulic power production. Producing hydropower is a matter of energy conversion – as in converting the kinetic energy of a moving mass of water as well as converting the pressure energy from the difference in head between inlet and outlet of the generator turbine.
There are hydropower plants that are called “run of river” plants because they depend mostly upon converting the kinetic energy of river flows into hydropower energy (similar to old fashioned water wheels or paddle wheels), and there are various combinations and permutations of head and velocity (low head/high velocity, high head/low velocity, and everything in between). The design of the hydro turbine depends upon the combination of kinetic energy and pressure energy driving it.
Duane ==> For this little project in the DR, the Pelton Wheel was hand made by a local welding shop using stainless steel and attached to a 120 v A/C alternator/generator. There was always plenty of water in the stream to keep the 4 inch PVC feed pipe full. A local retired Dominican engineer installed the inflow pipe in a collection pond and then laid the pipe down the mountain (above the flood stage so it wouldn’t be washed out) to a little concrete block generator building. Outflow just went back into the stream.
The flow is driven by head ‘differential’ so either the inland glacier is thicker or the seawall is lower. If the glacier is retreating or advancing is also a more obvious indication of whether the flow rate is greater than the local environment’s ability to ablate it.
Correct – so if the upstream surface elevation of the ice sheet is maintained at a constant, but the ice sheet is moving laterally at a higher velocity, with no change in frictional resistance on the land surface, then sea level must be dropping, not increasing.
Or to put it in simple terms – water flows down hill.
Kip,
The example of Annapolis shows that the alarmist motto has become: “Think globally, act moronically!”
How anyone could miss earlier instances of flooding at the location, or the subsidence that is so prevalent around Chesapeake Bay is a puzzle to anyone with a functional brain! They must have used a journalism grad; we know that they are trained to NOT do any research!
Adapting to SLR is not nearly profitable enough for GangGreen! That’s why they wail and moan about it’s dangers, while purchasing and remodeling their coastal palaces! Most of the rich, Green investors don’t want to wait for their money anyway; they want to suck their grift up quickly, and avoid possible identification!
Ab Man ==> It is a mystery to me.
How about we just let people who own property along shorelines worry about what they need to do about sea levels? Tidal erosion and land subsidence are the problems that need dealt with. Worrying about the slow rise and fall of sea level over periods of decades is wasted effort. Oh, and lets go, Brandon.
That is more a problem for their great great great grandchildren (or a chain of subsequent homebuyers). Few people buying a home today worry too much that it may have less real value in a hundred years when the sea might be a foot or so higher.
Or a foot or so lower. Or neither. The only problem in any of this is the meddling of a bunch of poorly educated busybodies who simply need to STFU and go do something actually productive with their lives.
Regarding satellite measurements: Do they make sure that there are no waves higher than 2 mm (1/10 inch) in the area measured?
What they do is make sure that their data continues to show an ever increasing rate of sea level rise. If that means changing the data, then it looks like that’s what they do.
Curious ==> No.
No, instead they assume millpond calm conditions and count wave activity as SLR.
Actually, the usual tide gauge design uses restricted in-flow and out-flow to a reservoir with a float, to dampen high-frequency changes, but allow measurement of low-frequency changes such as the tide.
Kip, thanks for bringing up the Sea Level issue. It is probably the biggest scare the folks pushing the climate scare have. The specter of coastal cities around the world inundated with a meter or more of sea level rise is a powerful image. Anyone submitting an essay to the current contest should give the sea level rise a lot of ink.
What is so amusing is how they pick areas that have been subsiding all along then wait for a king tide and send in the camera crews. This is how they get video of fish swimming in the streets of Naples and Miami. It makes no difference that these floods have been regular occurrences for decades and have nothing to do with SLR, people have short memories and believe what they are told.
Most of Miami Beach used to be well below sea level … the natural surface elevation above sea level covered a very small sliver of what is now Miami Beach. It was in the early 20th century when the Intracoastal Waterway was dredged, along with the harbors in Biscayne Bay, that dredging spoil was pumped onto what used to be a skinny barrier island to build what is now Miami Beach.
This kind of dredging land building was repeated throughout much of coastal Florida, primarily in bays and harbors, which is why there are so many canals in those areas – the dredge spoil from digging the canal was used to build the uplands in between. The City of Cape Coral is nicknamed “The Venice of Florida” because of its nearly 500 linear miles of dredged canals along the Caloosahatchee River estuary. Ditto in Fort Lauderdale, St. Petersberg, Clearwater, and other coastal cities that we think of as uplands.
Just as much of the City of New Orleans is actually below sea level – but the levies that were built along the Mississippi River allowed for drainage of that marshland to become a developed city.
Not to mention the Dutch “poulders” that were reclaimed from the North Sea by building dikes and windmills to drain the water, with much of the land surface lying below sea level.
You are absolutely correct. In grad school I studied stereo pairs from the 1920s of the Florida coast. It was very interesting, all those “barrier” islands are nothing of the kind, they are simply cut-off mainland beaches created when the ICW was dredged out.
I have never been worried.
Neither have the beachfront buying elites
I guess Gore, Obama… will have sold their places and shuffled on by the time the sea has risen 3 inches.
Well there is already a plan (a set of plans area by area) to manage sea level rise along every inch of UK coasts…
The point of Kip’s article is that all SL is local, Griff.
So with these UK coast plans, who compiled them, based upon what observations, what assumptions, and what particular LOCAL responses are warranted?
(That is to say, if the plans you refer to were done by “central planning”, file them in the wpb).
Now that’s hilarious, even by your standards, griff
And for eastern coastal erosion?
Based on 1.7mm per year, i think an easy solution is you being paid to walk the circumference of Britain continuously pulling a wagon full of bricks, every decade when you pass each low spot of the coast you lay down another layer of Bricks.
I just solved the SLR issue for Britain at almost no cost.
And where the land is rising, your job will be to move the beach sand closer to the waters edge.
The ultimate Govt job as no one will ever be able to see any difference from your actions, just like SLR.
I just created my first “green” job. Aren’t i wonderful?
Yep sand moving – it sounds like a “shovel ready” govt job to me!
Think of all the green jobs.
And if SLR accelerates, alarmist scientologists can volunteer to be part of the wall, stacked like cordwood and cemented into place.
Instead of burial (wastes land) and cremation (co2 release again) pay to be incorporated into sea walls, you get a commemorative plaque at your spot of the wall for descendants to bask in your glory how you saved XYZ village.
But then i guess a true believer shouldn’t have descendants, so what is the point? They would just curse you for breeding them into existence, further accelerating the End of the World.
This green stuff is difficult.
You mean a “lean on your shovel ready” job, for government workers!
If that plan incudes more GPS/Tide gauges to assess local conditions on which to make realistic decisions, then that would make sense.
If the plan is to start building sea walls meters high, and condemn coastal property, because of imaginary projections then no.
And how much SLR are we talking about here for the U.K. Griffy? Is is based on actual measurements from tide gauges or from those computer models?
I’m not convinced that this will be anything more than garbage, quite frankly. These plans will be based on the study that the govt commissioned the Met Office to provide; a study showing extreme sea level rise – the clue is right there that it will be the usual alarmist twaddle. The contents of the report appear to be based on model projections from now until 2300 and extreme sea level rise academic papers – zero observational data, just total speculation with no basis in reality.
They’re going to “manage” sea level? Or adapt to it?
There is no problem too small that some self-important bureaucrats won’t think that they are able to do a better job than the local people.
ROFL it’s like an episode of yes minister with the hospital with no patients.
Who pays the idiots who administer something that isn’t a problem?
Kip, your take on this is so compellingly obvious that I’m embarrassed (engineer here) that my mind was trapped in the abstraction of debating the global SLR aspects of future ‘problems’. One has to be careful that warming warriors don’t set the boundaries of issues at debate.
See my post here some years ago “Sea Level Rise, Acceleration, and Closure”.
The rate over the past 60-70 years is 2.1-2.2mm/year using only long record (to avoid the lunar nodal cycle complication) CGPS VLM corrected tide gauges. There is no detectible acceleration outside the estimate error. And that rate closes with the best estimates of steric rise plus ice sheet loss.
The NASA satellite estimates are useless. See previous post “Jason 3 Fit for Purpose?”, and my two more recent ones on the newest Sentinel 6 bird for specific reasons.
“The rate over the past 60-70 years is 2.1-2.2mm/year using only long record (to avoid the lunar nodal cycle complication) CGPS VLM corrected tide gauges.”
Like temperature, there is no “the rate”. There’s no global temperature, and there’s no global sea level.
Curtis E. Larson of the USGS (now retired) wrote “A Search for Scale in Sea-Level Studies, Journal of Coastal Research 4/22/788-800, July, 2006, reporting his work on sea level rise along the East Coast of the US based on peat bogs and river sediments. He concluded that sea level has risen at a rate of 1 to 2 mm/yr on average for the past 6,000 years which is the same as it is rising today.
That is not surprising given this graph:
That graph alone puts the whole SLR scare into perspective.
“… sea level has risen at a rate of 1 to 2 mm/yr on average for the past 6,000 years which is the same as it is rising today.”
Err No – the last 27 years have seen an average global SL rise of 3.5mm/year.
https://www.eea.europa.eu/ims/global-and-european-sea-level-rise
“The global mean sea level (GMSL) in 2020 was the highest ever measured. GMSL reconstructions based on tide gauge observations show a rise of 21cm from 1900 to 2020 at an average rate of 1.7 mm/year . The rate of GMSL rise accelerated to 3.3 mm/year over the period 1993-2018 and 3.7 mm/year over the period 2006-2018, more than twice as fast as during the 20th century ”
Global because it is very variable ……

Please note that the graph I provided is based on geological field work showing where water levels have been. It is based on long-term behavior (>6,000 yrs), not monthly data over the past dozen years. The satellite altimetry you are showing has its issues of accuracy compared to tide gauges, as detailed by Kip.
Aren’t you one of the people who has taken issue with Monckton because of the short time span and meaning of an apparent hiatus over the ‘cherry-picked’ interval?
Incidentally, the third graph that you show suggests that the rise in sea level is a result of the strength and direction of winds, not a result of thermosteric increase.
” The satellite altimetry you are showing has its issues of accuracy compared to tide gauges, as detailed by Kip. ”
Sorry: this is simply wrong.
For Jan 1993-Dec 2020, the linear trends are
The difference is below PSMSL’s standard error estimate.
“All RSL is local and strictly speaking applies only to the single point at which it was measured.”
Exactly the same thing applies to temperature station readings. They don’t apply to other stations anywhere, period.
There’s no reason to worry about sea-level rise any more or less now than there was before the AGW fear-mongering began. It’s not rising any more rapidly now as it was in the 1920s well before the scare-mongering. It’s obviously being used as a tool for the ec-loons and their wokeunist funders.
Here is a simple graph illustrating a comparison of global sea level changes over the past 100+ years and CO2 concentrations. These included Cross & White reconstruction, and the Holgate9 model using PSMSL without vertical land compensation. The CO2 data was the Scripps reconstruction, using combined chemical and Mona Loa data. Filtering the raw PSMSL data was using a Fourier 34 year ‘box’ low pass filter.
Primary purpose was to compare the CO2 and sea levels to note any apparent connection between the two. While both exhibited a rise over time, the sea level did not show any significant rise rate changes as compared to the CO2 rise. One might expect, since water expands when heated. In addition, the 1950’s CO2 “knee” was not reflected in and sea level rise change.
The one surprise that did show up was looking at the sea level frequency spectrum, where a 12 year cycle showed a correspondence to the 12 solar cycle.
A funny observation.
Some PSMSL stations have a season dependent signal of up to 100mm. Most visible at North Atlantic shores. The longest european serie of Brest has zero for the whole serie, but opposite variation if divided in half.
It could make troubles dependent on how you calculate the yearly values.
” It could make troubles dependent on how you calculate the yearly values. ”
No one simply calculates yearly values.
Who works correctly computes monthly departures from a mean – e.g., 1993-2020 or so – with removal of seasonal dependencies (annual cycle), by computing the monthly departures wrt the corresponding month in the mean aka baseline.
The job is the same regardless whether you do that for temperatures, sea ice extent, sea level etc etc.
If there’s a sealed aquifer beneath Annapolis, the simple solution is to drill it, frack it, and inject more water. This has been proposed as a long-term solution for subsidence in Venice.
Do we have laser reflectors? Like we have on the Moon.
And can measure them from orbit.
Or measure thousands of towns with a satellite, the rise or lowering in elevation with high precision?
Some satellites use lasers on land to determine their altitude. However, that isn’t possible over the open oceans. My understanding is that they have to depend on coarse resolution gravity models to determine the position and altitude while over the oceans.
In 1906, the San Andreas fault ruptured along the central California coast. As evidenced by photographs of twisted railroad tracks and exposed mussels on pier pilings, the coastal land moved 26 feet north and rose 1 foot in less than a minute.
In 1989, the San Andreas fault ruptured along the central California coast. As evidenced by photographs of offset highways and exposed mussels on pier pilings, the coastal land moved 10 feet north and rose 1 foot in less than a minute.
So in less than 83 years, coastal California rose 2 feet and moved 36 feet northward.
If trends continue, the rise in altitude and northward movement of the coastal lands will solve all human worries of temperature increase and sea level rise without doing a thing.
I wish I knew how to make successful searches of WUWT’s past articles but I definitely remember reading one about the 60 to 70 year switch between long term atmospheric pressure difference that have been recorded in the Atlantic Ocean, north & south, over the streatch between the US and Europe (Atlantic Multidecadal Oscillation?). Due to this, there is a reversal of the prevailing winds along much of the eastern USA coast. The predicted next change (expected to bring cooling) means the prevailing winds will push water towards the coast and raise RSL (much as the Trade Winds push water towards the Pacific Warm Pool and increase sea level there by around 22 inches relative to the west coase of North and South America).
The article said this would (temporarily, for perhaps a couple of decades) significantly raise high tides at many places along the USA northeast coast. Is this a reasonable expectation?
The article also expressed the belief that this would cause much howling among the warmists.
Sea level is rising, in part, because the oceans are warming. It is the thermal expansion of water.
Oceans are warming because they have been experiencing a gradual reduction in insolation for the last 400 years while land has been getting more. That slows down the water cycle between ocean and land and upwelling of the cool water in the deep channel flowing from the high latitudes to the low latitudes.
This process will proceed for another 10,000 years as the current precession cycle shifts perihelion toward the boreal summer solstice.
CO2 plays ZERO role.
No climate model predicts a reduction in total freshwater runoff from land that has been observed since reliable records have been available:
https://www.bafg.de/GRDC/EN/03_dtprdcts/31_FWFLX/freshflux_node.html
The easy ways to test the predictive ability of any climate model is to observe if it has open ocean temperature exceeding 31C on an annual average and/or if the net ocean evaporation (evaporation -precipitation) is increasing. Either case invalidates the model.
Hi Rick,
You raise an important point. One of the reasons the models are so far away from reality is that they include a thermal expansion factor (either 38% or 55% of total SLR according to the IPCC). The trouble is, there is, effectively, ZERO thermal expansion at the coast because there is not enough depth of water to make a significat, or even measurable expansion. So the models are doomed to project high even before any Relative Sea Level factors need to be considered – although Kip nails it.
Arfur
Hi Arfur
May i remind you that the sea is fluid water. It expands both sideways and up/down.
If you only look sideway the coast would raise faster!
Mr. Layman here.
At times the USGS has adjusted “0” for feet above sea-level.
https://www.foresitegroup.net/elevationmeasurements/
They rarely do it but it seems that this could have an effect on reported tide levels gages even if they had a GPS attached?
(Or is this comment from “Mr. Ignorant Layman? 😎
PS One of my favorite secular quotes is, “Everybody is ignorant, only on different subjects.”
Will Rogers