Statistical method more accurately determines whether jumps in ice core data significant or merely noise.
AMERICAN INSTITUTE OF PHYSICS
WASHINGTON, November 16, 2021 — Abrupt changes in ice core samples and other records indicate dramatic changes in climate occurred at certain points in the past.
In Chaos, by AIP Publishing, climate scientists identify abrupt transitions in climate records that may have been caused by the climate system crossing a tipping point. This happens when self-reinforcing feedbacks in a system push it away from a stable state, leading to dramatic change.
Identifying these events in the Earth’s past is critical to understanding the tipping points likely to be encountered this century as a warming climate destabilizes the Earth’s physical systems and ecosystems.
The researchers from CNRS (France), UCLA, and Columbia University devised a statistical method to determine whether transitions seen in climate records such as ice cores are simply noise or evidence of a more significant change. This has typically been done by visual inspection, a process that is time-consuming and subjective.
Their method is less error-prone, since it doesn’t rely on human determination of whether a jump is a significant transition. It allows comparing different records consistently and can identify important events that may have been overlooked in older studies.
An augmented Kolmogorov-Smirnov (KS) test, a statistical technique named after its original authors, provided an alternative approach to recurrence analysis. The KS test has been successfully applied to other inherently noisy systems, such as finance and signal processing.
The method compares two samples taken before and after the potential transition point to test whether they come from the same continuous distribution. If they don’t, the transition point is identified as a significant abrupt change indicative of a true climactic shift.
“We applied our method to two paleoclimate records of the last climate cycle, a Greenland ice core and a speleothem composite record from China,” said author Witold Bagniewski.
Analysis of ice cores reveals that the ratio of two oxygen isotopes varies over time. This ratio depends on the local temperature at the time the ice formed, providing a measurement of the climate at that particular time.
Speleothems are mineral deposits in caves showing a similar pattern of isotope ratios varying as the climate changes.
“Many of the abrupt transitions in the Greenland ice core record correspond to shifts between a warmer climate, known as Greenland Interstadials (GIs), and a colder climate, the Greenland Stadials (GSs),” said Bagniewski.
The existence of these two climate states, GI and GS, is an example of a bistable climate system, in which two distinct states are both stable. The climate may jump abruptly from one to the other when crossing a tipping point.
“Our methodology is very effective in correctly detecting abrupt transitions in climate records,” said Bagniewski. “Its wider application may help reconstruct the chronology of Earth’s climatic events.”
###
The article “Automatic detection of abrupt transitions in paleoclimate records” is authored by Witold Bagniewski, Michael Ghil, and Denis-Didier Rousseau. The article will appear in Chaos on Nov. 16, 2021 (DOI: 10.1063/5.0062543). After that date, it can be accessed at https://aip.scitation.org/doi/full/10.1063/5.0062543.
ABOUT THE JOURNAL
Chaos is devoted to increasing the understanding of nonlinear phenomena in all areas of science and engineering and describing their manifestations in a manner comprehensible to researchers from a broad spectrum of disciplines. See https://aip.scitation.org/journal/cha.
###
JOURNAL
Chaos An Interdisciplinary Journal of Nonlinear Science
DOI
ARTICLE TITLE
Automatic detection of abrupt transitions in paleoclimate records
ARTICLE PUBLICATION DATE
16-Nov-2021
From the fist sentence of the above press release about the just-published, peer-reviewed AIP publication:
So, now all the AGW/CAGM alarmists have to do is come up with the fundamental reasons that greenhouse gases in Earth’s atmosphere, during the times of abrupt transitions in atmospheric temperatures (as indicated by the ice core proxy data and the applied KS testing), also had similar abrupt shifts, assuming that they did. 🙂
Or perhaps, reading between the lines as it were, this data is hard evidence that atmospheric temperatures are totally independent of atmospheric greenhouse gas concentrations?
A while back, out of pure curiosity about such things, I made up an Excel chart with the length of time for cold periods in blue and the warm periods in yellow. I didn’t look at anything else. Length of time is just as important as a ambient temperature. My chart only addresses North America, but Europe had the same warm and cold periods going on.
It was an eye opener for me because with maybe 2 exceptions, the warm periods were consistently shorter than the cold periods. So this one has lasted about 18,000 years, +/- a millennium or two, and the snow/cold season seems to be starting earlier than it used to in the last few years, which means that Hallowe’en trick or treating began to require warmer clothing than prior decades. We started having October snow in my area back in the 1990s. Not fun for kids with trick or treating on their minds, and — well, boys, and girls, there was snow on my front steps on October 27 last year and freezing rain on October 25 this year. Snow was in the weather forecast, per the local weather radar frost/freeze/snow warnings, starting in mid-October, blizzard warning up in Minnesota, etc., but all the snow was up in the clouds.
Take a hint. Mother Nature is telling us something. You can quibble over charts and ice cores all you like, but that doesn’t prepare you for a blizzard dumping that white fluffy stuff on you. Early snow was reported in the Austrian Alps this past summer, and in other places – does that mean ZERO – NADA – NOTHING????
Just sayin’ — if this warm period is getting shorter, why aren’t we paying attention to that? We have 7++ billion people on this planet and not all of them live in warm places. So what’s the quibbling all about, anyway? Are any of you prepared to deal with heavy snows and blizzard conditions way ahead of when winter officially starts? Or are you so inured to the calendar that “official start dates” is all you can see?
I want to see all the self-important mopes who attend those climate cons at our expense become snowbound next year in a blizzard. I will welcome that sight when it happens. 🙂
You all have a nice day.
I’m not betting on a blizzard in Egypt come next November, Sara. 😁
No, but it could happen. If it can snow in Kuwait, which has happened recently, it can certainly happen in Egypt.
The Bronze Age was a very, very warm period during which Mediterranean civilization began to develop, what preceded all of that? There are places in Algeria that used to be fertile and wet, which are now dry as a bone, but back then, they were where people were starting to farm and raise cattle and sheep. The point is that the whole Med area used to be green and fertile and a huge swath is now desert. No reason at all that it could not return to green, fertile and wet, if the weather cycles went in that direction.
The city of Ur was built when the glaciers to the north of the Mediterranean (Europe/Eurasia) were starting to retreat. Clay tablets have been collected from there that indicate it was green, wet and fertile, and trade and agriculture were developing in the area between the Tigris and the Euphrates rivers. The whole area is mostly a dust bowl now. There is nothing says that it can’t change. It was called the Fertile Crescent for a reason.
Sara,
What temperature did you use to divide “cold” from “warm”? And what was your rationale for picking that specific temperature?
It wasn’t about temperature, it was ONLY the length of time from the start-to-end of one cold period and start-to-end of a warm period. There is plenty of room between the start and the end of each of them for swings in temperature and precipitation.
There were/are many things that have a profound effect on the weather, but that does not last.
Toba’s eruption 72,000 years ago would be a good example. That was during a warm period (Sangamon) and it had a profound effect when it happened, but things warmed right back up. Doesn’t have anything to do with ice cores or temperatures switching back & forth. It’s the length of time from one chill-down to the next warm-up. If Toba ejected enough material to block sunlight, that would account for a brief cold period in the middle of a warming period.
Every warm period had cold periods, and likewise, every cold period had warm-ups, however brief they were. The millenia preceding the Bronze Age would be a good example: rising Mediterranean civilization, Jordan was being settled and turned into a agricultural area, migrating Hoomans went from Siberia across the Bering Straits to North America and spread south from there, never mind exploring parts of the Pacific. The entire Mediterranean area began to flourish and agriculture became a guarantee of food resources. A good example would be the start of cultivating emmer grains around 17,000BC, which eventually led into agriculture.
Here’s a link to a website regarding the history of food:
https://www.foodtimeline.org/
If this has anything to do with solar output oscillating over time (which is very likely), then an active Sun has as much influence on things as the planet’s own weather and geological systems do, and I’m not so sure the Sun really “recovered” from its CME outburst in 2008.
There’s no one single factor involved: that’s my point. If our Sun has gone quiet, so be it. A quiet sun, combined with the wobble of the polar axis, can have a profound effect on the entire planet in regard to weather and agriculture. When you add geological activity, such as gassy volcanic eruptions coupled with high ash content, to that along with seasonal changes, that’s an indication that we should be preparing for extremes instead of squabbling over ridiculous nonsense like “tipping points” and CO2/.methane loads produced by the planet.
Defining “cold periods” and “warm periods” wasn’t about temperature, you say.
Come again?
This looks to me like a case of: we will try different types of statistical analysis until we get one that generates the answer we want. This has become a fairly common gimmick in academia.
How many types is analysis did the do on the data before they found the K-S test gave them the answer they wanted?
Lies, damned lies and statistics.
“Abrupt changes in ice core samples and other records indicate dramatic changes in climate occurred at certain points in the past.”
No thought given to the quality of data (missing layers/unconformities), which are common in other geological processes visible in sedimentary rocks? During the glacial max, ‘sedimentation’ of snow is very thinly bedded and can blow away sometimes at any site.
They would need to twin the coreholes to evaluate this. If there is a rapid warm up or cool down, look at the variations in thickness of layers at the point of change (warmer more snow, colder less) as a sign of sudden changes.
A gang of hubristic mathematicians and physicists without a sedimentologist on board makes their output questionable. If they had the conclusions already before the study was done, which is de rigeur in climate science, then it is activist, Lysenkoist garbage
Well said by a first class, data-driven, Geologist. 🙂
Ah, my warmest greetings to you Janice. Many good people have disappeared from this site and I find myself praying that they are still with us. I’ve experienced all or parts of 10 decades myself so am grateful for every sunrise.
😊
And still providing valuable commentary. Good gravy, Gary! My hat’s off to you. Regards,
Kevin
The only tipping point that matters to these people is the percentage retained from grants issued to write drivel such as:
No one knows if a warming climate “destabilizes” the Earth’s physical systems and ecosystems as it hasn’t been observed. To make such a statement is hubris, not science.
And it is contradicted by their own chart showing fewer “tipping points” of lesser magnitudes during the warmer Holocene.
Exactly right, Dave Fair! Those sharp Dansgaard-Oeschger warming events of which we are aware all occurred during the last glaciation. Once the great northern ice sheets were gone, those large, sudden climate changes apparently ceased. We have no evidence of sudden climate changes of such magnitude during the warmer interglacials, such as the current Holocene, or the even-warmer Eemian.
The evidence is compelling that, on millennial and shorter timescales, warm climate periods are more stable than colder climate periods. In comparison to the D-O cycles of the last glaciation, the warming and cooling cycles of the Holocene climate record are slight and slow:
IACP 🡕 RWP 🡖 DACP 🡕 MWP 🡖 LIA 🡕 Modern Optimum
The Hockey Team is trying diligently to erase even those small climate cycles from history — even while, contradictorily, claiming that global warming will make the Earth’s climate less stable. It’s almost as if they don’t know what they’re doing.
Oh, I believe they know exactly what they are doing.
I do wonder if our sun is as constant as we think. We observe repeating micro nova’sof various frequencies in other stars. The geologic record does contain magnetic anomalies that could be tied to solar outbursts. Given that in the modern record we have observed things like the Carrington Event, I don’t see how we can rule out events orders of magnitude larger that would send tremendous energy into our atmosphere and likely have major climate effects. I wish we had an accepted explanation for the Younger Dryas. This period sticks out like a sore thumb. Climate models have no clue about such events.
Pushing the earth’s climate away from a stable state? How about possibly giving it just enough push for it to transition from one stable state to another — i.e. something like a phase transition? Or even pushing it out of a stable state onto a limit cycle? And there is nothing especially magical about using Kolmogorov-Smirnov (KS) test as it is simply more robust than other statistical tests by virtue of not being tied to a particular distribution. I am always bothered by the claim that something is less error-prone by way of being automatic. I’d really like more information on some of these “tipping points”. For example, the one that takes earth into an ice age. Can someone be more definitive about that one beyond the simplistic “solar insolation at 65 deg North” explanation? For example, how does this one work beyond simply saying that insolation decreases? What else has to happen? Why did this one change from 40kYr cycles to 100kyr cycles — or did it chnage? Did it simply transition into 40kyr cycles where one gets skipped occasionally?
abutting large changes in ice cores largely mean the scientists reading them simply don’t understand physics
the CO2 in them is only valid if they’ve been below -109°F their entire existence and have never been compressed… otherwise its an anecdotal proxy
“Tipping Point” is the most over-used expression of the 21st century. It is not formally defined. I’ve always considered it a catastrophic event, like a sailboat capsizing. The quoted statement above just suggests an accelerated change from which it might well recover naturally. It is another one of those invented terms to appeal to emotions rather than reason, such as “ocean acidification” and “global heating.”
No, its not evidence of bistability, as chaotic systems are not, in the normal sense, stable.
It is the evidence of (at least) two attractors.
Depending on which temperature index you choose (graph source), global temperatures are believed to have been rising at an average rate of between 0.06°C and 0.16°C per decade since 1958 (the start of the Mauna Loa CO2 measurement record), as atmospheric CO2 level rose from 315 ppmv to 416 ppmv.

Based on the trends in temperature and CO2 level, we could expect at most a little over 1°C of additional warming by 2100, and probably none at all after that.
That’s a small change, and a very slow rate of change, in comparison with past natural changes in the Earth’s temperatures. We know from ice core isotope analyses that over the last 100,000 years the Earth has experienced dozens of natural “Dansgaard-Oeschger events” (a/k/a “Greenland interstadials”) in which temperatures changed at rates as rapid as several degrees per decade. (Caveat: The most rapid changes are seen in Greenland ice cores, but Greenland’s temperature changes tend, in general, to be at least twice as rapid as globally averaged temperature changes, due to “Arctic amplification.”)
This graph is from an article on Dr. Curry’s “Climate etc.” site:
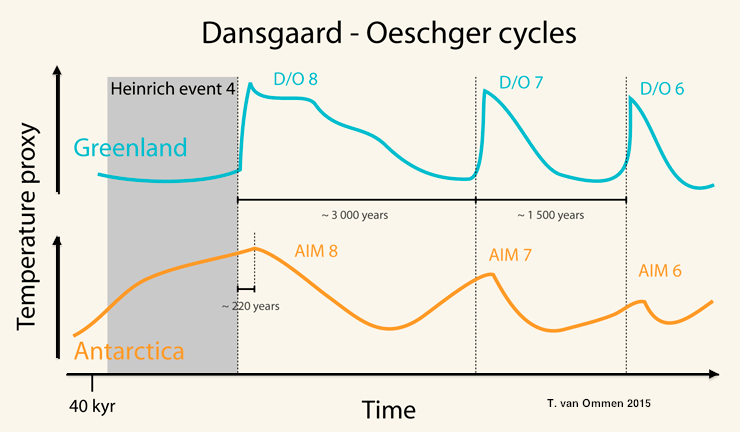
Those much larger and more rapid (but 100% natural!) temperature changes are known to have been globally synchronous, though much less abrupt in the southern hemisphere, and they persisted for hundreds or (more typically) thousands of years — and nobody knows with certainty why they occurred.
Fortunately, those very large, abrupt temperature changes apparently did not cause mass extinctions. Mankind, polar bears, pikas, coral, and nearly every other existing species of animal and plant all survived those sharp climate changes. That suggests we needn’t fear that the current (comparatively slight) warming trend could be catastrophic for them.