
Part 3 on controls on Arctic sea ice. Although sunspot cycles do not add enough energy to explain the Arctic’s warming, the sun and sunspot cycles do explain redistribution of heat from the Tropics to Arctic and resulting changes in sea ice and the resulting ventilation of subsurface Arctic ocean heat that has caused the Arctic air temperatures to rise greater than any place else on earth
Transcript of video available at:
https://perhapsallnatural.blogspot.com/2021/10/how-sun-controls-arctic-sea-ice-and.html
Jim Steele is Director emeritus of San Francisco State University’s Sierra Nevada Field Campus, authored Landscapes and Cycles: An Environmentalist’s Journey to Climate Skepticism, and proud member of the CO2 Coalition.
“the sun and sunspot cycles do explain redistribution of heat”
The Sun does not explain anything. Human beings do.
So, where is that explanation?
Correlation is not causation.
Human beings do what ? Even no correlation to see.
KG,
He is objecting to the anthropomorphization of the sun, as in Dr. Sol stood before his classroom and lectured on how he impacts the redistribution of heat through his spots. (It is people who do the explaining about what our indispensable but decidedly inanimate star is or is not causing in our climate).
It’s a debating tactic I suppose to state something that is true and implies something else provocative that your opponent will misconstrue.
I didn’t notice Jim say that the correlation was proof, but I’m not always observant enough. Dr. S didn’t say that only humans affect the climate, but he phrased his critique in a way that several people misinterpreted, which I doubt was due to clumsiness.
Semantic quibble?
n.n
I’m just interpreting what LS actually meant when he said:
“The Sun does not explain anything. Human beings do.”
If I’m wrong, then I’m wrong. But I believe that he was trying to be clever by correctly stating that “The Sun (being an inanimate object) does not (have the ability to vocalize and) explain anything. Human beings do (have the ability to give an explanation)”
Knowing that it is his position that the sun has not been responsible for our modern warm period, and therefore it must be CO2, he anticipated that everyone would interpret it as “The sun does not explain anything (about the recent warming). Human beings do (cause warming)”, as KG and others did.
After allowing them to misinterpret his actual words to a meaning that is aligned with his past claims, he can correctly state that he did not make any unsupported claims about anthropogenic global warming. And indeed he did not. Why play such games? I cannot say, that would “seem” to be my subjective opinion. There may be a correlation between objecting to an observation of a correlation and the degree to which that correlation would falsify a cherished theory.
Unless English is a second language for Leif, and he is grammatically dissecting the statement literally, then his remark doesn’t stand up to scrutiny. Someone might observe that they have a flat tire and that there is a nail sticking out of the sidewall. They might well exclaim colloquially, “Well, the nail explains why I have a flat!” Nobody would have any difficulty understanding what was meant, and wouldn’t complain that the nail didn’t expound on how it caused the flat.
Of course he understood the meaning. You don’t become a professor at Stanford by being illiterate, I dare say. It’s just word games.
Also, consider the next sentence:
“So, where is that explanation?”
“that explanation” refers back to the antecedent “human beings do (explain)”. It cannot refer to a sentence that should be interpreted as human beings do (cause climate change).
And the final sentence just refutes the idea that there is an explanation related to the sun, despite the admitted correlation.
English is a second language for Dr. S, but he now might speak it better than Danish.
Leif, If you watched the video before commenting you would not be asking,
“So, where is that explanation?”
Your objection seems entirely guided by your belief that only human actions explain climate change, which is laughable. Apparently you dont know much about paleoclimate change.
Besides, I have never claimed the sun is thee only factor. This is part 3 (part 4 coming soon) examining how ocean current redistribute warmth into the Arctic part 1 and how sea ice changes ventilate that heat in part 2.
“Your objection seems entirely guided by your belief that only human actions explain climate change”
Nonsense. “seems” is just your subjective opinion. You do not explain how the sun does it. It is that explanation I seek. But it is nowhere to be found in the video.
Hi doc
Nice to see you are in the combative form of the old days. Since Arctic Ocean is a near cull de sac of its bigger and much warmer relative the N. Atlantic, it’s not surprising that there is a direct thermal inter-relation.
N. Atlantic has its thermal and the sun has sunspot multi-decadal quasi-periodic oscillations. Some ‘experts’ claim they know direct cause of one or the other or even both, but I’m not so sure that they are correct.
When such oscillations coincide in phase (either rising or falling) then it can be said with a degree of certainty that a rise or fall in the temperature decadal trends will follow.
However, when two are out of phase, the ‘experts’ will dig out some other often dubious cause.
the above appears to be an incomplete graph, here is a longer version.
Vuk, the three coldest AMO anomalies in the mid 1970’s, mid 1980’s and early 1990’s were when the solar wind was the strongest in the space age. in 1969 and 1979-80 there were major lows in the solar wind, so the AMO anomalies were warmer then. From the 1990’s the major lows in the solar wind shifted to around a year past sunspot minimum, which accounts for the phase shifts between AMO anomalies and solar cycles. Note how the AMO anomalies are never the coldest around sunspot minimum during a warm AMO phase, but normally colder around sunspot minimum during a cold AMO phase. The AMO is a useful inverse proxy for the solar wind strength.
https://www.woodfortrees.org/graph/esrl-amo/mean:11/plot/sidc-ssn/from:1850/normalise
Vuk is correct. These attempts to find correlation with SSN always seem to blinker the data to a period where there is rough correlation and quietly ignore when it goes into anti-phase.
I usually appreciate Jim Steele’s work but his LOD claims are equally dubious:

There are three massive peaks in LOD and four clear and distinct peaks in SSN yet he still manages to see a correlation.
However, I’m grateful of his explanation of Arctic warming being faster than global average. I’ve been saying for years that increased convection and evaporation where a natural negative feedback which prevents the claimed “run away melting” from happening and the “less abdedo, more heating” claim was naively simplistic.
I had not made the connection to the anomalous, much faster atmospheric warming in the Arctic.
This is significant with alarmists using Cowtan and Way’s extension of NH into the Arctic to exaggerate overall global warming.
Jim’s interest in heat transport needs to consider changes in lunar tidal forces. Lunar apsidal precession is 8.85y .
Heat transport in and out of tropics depends on variations in the three main lunar cycles too. Probably why simplistic solar explanations fail like simplistic AGW ones.
Indeed there are many factors to consider regards heat transport,
One thing to consider regards the illustrations from Morner 2020’s showing the alternating inflows of warm water, is that changes in poleward heat happen all the way along the Gulf Stream too as vorticity continuously deflects flows eastward
Greg, indeed out of all the information in this video, I too think the sunspot-rotation link is the most questionable. But like many published reports I do think there is a sunspot factor, other than the lack of a significant change in irradiance. As I said at the video’s end, the sunspot predictions and changes inflows have failed just like the CO2 claims
I dont think the alternating shifts in Atlantic inflows is just a function of rotation speeds, but there are studies such as Ludecke (2020) stating “Previous studies have suggested a significant solar influence on the AMO and NAO. It is likely that the greatest impact of solar activity on European temperatures is of a non-linear, indirect nature by way of interaction with Atlantic cycles.” AMO and NAO are topics of part 4.
As Soon (2005) wrote, “The reconstructed Arctic SAT
time series based on the inverse wavelet transform,
which includes decadal (5–15 years) and multidecadal
(40–80 years) variations and a longer-term trend, contains
nonstationary but persistent features that are highly
correlated with the Sun’s intrinsic magnetic variability
especially on multidecadal time scales.”
Connolly (2021) in How much has the Sun influenced Northern Hemisphere temperature trends? An ongoing debate, offers a very in depth well balanced look at possible mechanisms to explain correlated solar effects. They mention Morner 2020 as a minor aside of mechanisms to be considered. So I added the claims of Morner(2020) and the Barents Sea Ice Edge project as one dynamic to stimulate more consideration
And as an aside, there has been media releases about the earth’s rotation speeding up due to melting glaciers, which seems to be backwards, but media blames everything on CO2. So other rotation explanations are needed to be public
Agree it is difficult to find correlation AMO vs sunspots. Actually AMO is departing so hard from “normal” numbers 1960-1980 that I suspect Mann-made intervention of the “adjustment” kind…
That said, as far as I remember my own results playing with algorithms, I believe I found that for certain timeframes averages versus previous periods averages, I was able to train my detrended calculations to show that their direction were actually reasonably in sync over time.
Oddgeir
Do a run on sunspots data with a 4010 days/11 years average (silso provides .txt data). We are back at ~1895-1905 levels…
Oddgeir
Yes, a juxtaposition of cause and effect, and a directed order underlies the anthropogenic explanation. Generally, the processes under consideration including sympathetic waves, correlation of phases, confluence of phenomena, among others terrestrial and extraterrestrial forcings, where even solar perturbations can have catastrophic effect over irregular intervals and span in time and space.
While I’m still here, just to mention a rather notable CME occurred couple of days ago, imminent arrival expected, with possibility of a good auroraal viewing in the northern latitudes. (short movie follows)
Leif, it also seems you are operating under a much more narrow definition of how the sun can affect climate, making you get all huffy.
Assuming you think the sun can only have a warming effect if its irradiance changes significantly, I the video at the onset states that measured changes in 1.3 W/m2 is cetrainly not enough to explain warming. As I have argued in past videos the keey is dynamic changes which the sun plays a role.
For whatever factors affect Milankovitch Cycles, it is the sun that exerts the ultimate effect. It would be very silly to argue changes in obliquity by itself alters the flow of warm Atlantic inflows even without the sun. Likewise the changes in the ITCZ.
“For whatever factors affect Milankovitch Cycles, it is the sun that exerts the ultimate effect. It would be very silly to argue changes in obliquity by itself alters the flow of warm Atlantic inflows even without the sun. Likewise the changes in the ITCZ.”
Without the sun there would be no effects, but the changes you are talking about are not due to changing solar activity, but to Earth orientation and distribution of land and ocean on time scales of tens of thousands to millions of years; not something we would associate with present day climate. The sun plays no role in any of this.
It is odd how the position of the barycenter of solar system corresponds to the minimums and maximums of sun spot activity (Maunder, Dalton, Spoorer,etc ) which in turn correspond to historically known eras of high and low temperatures, like the Roman Warm Period & Little Ice Age.
Apparently that may be do to the fact that the barycenter is not fixed, but alternates between trifolar and disordered patterns:
The Sun is not the Center of the Solar System
https://youtu.be/XxiQoanjvLE?t=2384
More on that here:
A phenomenological study of the timing of solar activity minima of the last millennium through a physical modeling of the Sun–Planets Interaction
https://www.sciencedirect.com/science/article/abs/pii/S1384107614000992
Likely just a coincidence… but at least it is falsifiable as the barycenter theory predicts an extended Modern Minimum occurring in the next few decades. So it won’t be long before we have an answer and there won’t be any series of interminable extensions.
Give it up Leif! All your bluster is about semantics. Clearly the video states its about the sun’s role is in relationship to changes by “Earth orientation and distribution of land ” but It is NOT just thousands and millions of years, as you claim in your obsessive attempt to make the sun irrelevant!. The sun’s effect of the ITCZ is seasonal, decadal centennial and millennial. Plus many studies find sunspot cycles correlating with warm inflows. It is a correlation worth examining further.
Jim Steele:
There is another reason for the accelerated warming at the poles, which you haven’t mentioned as yet.
The Earth’s atmosphere is loaded with millions of tons of industrial SO2 aerosol emissions which reflect sunlight and cool the Earth’s surface. These emissions have been falling as a result of targeted Clean Air efforts, and the climate has warmed because of the less polluted air.
At this point, their presence over the poles is very low, so that their cooling effect is almost absent, allowing increased warming. This is shown in the NASA image below:
.
My investments has done miserably the last few months. I probably have an unrealized loss of ~10 percent in Aker Biomarine which core business is fishing krill in the Antarctic.
It’s all blamed on to much sea ice which renders fishing fields inaccessible.
Sigh…
Oddgeir
My suggestion for an explanation has been published here:
https://www.newclimatemodel.com/is-the-sun-driving-ozone-and-changing-the-climate/
Leif must have seen it many times but has never pointed to any contradictory observational evidence. If he has any then I would like to see it in case my hypothesis needs refinement.
your so-called ‘explanation’ is too vague to comment on. I would classify it as ‘not even wrong’.
Yes, but see also the cosmic ray / cloud connection here:
https://notrickszone.com/2021/10/25/in-a-few-days-clouds-affect-earths-radiation-budget-by-more-than-co2-does-in-270-years/
I prefer the idea that longer lines of air mass mixing from wavier jet stream tracks cause the cloudiness changes rather than more cosmic rays.
Either way the changes in cloud cover do track solar variations.
As far as I know there is no shortage of condensation nuclei so I cannot see more cosmic rays as having much effect.
Two of those “oscillations” were due to El Chichon and Mt.Pinatubo which annoying were timed close to solar maxima. Both events lead to a temporary bump in lower stratospheric temperatures followed by a persistent downstep of about 0.5 deg C.
These events are also recognised to have reduced ozone levels. ( 5%-8% for Mt P according to NASA ).
This means a more transparent stratosphere and more solar radiation entering the lower atmosphere.
Greg:
I need to point out that the initial effect of a volcanic eruption will NEVER be warming, only cooling.(any warming normally occurs 18-36 months later, after its SO2 aerosol pollution has settled out of the atmosphere).
Regarding El Chichon,(Apr 1982), it erupted during the Mar 1982 Jul–1983 El Nino, so warming had already begun before it erupted.
For Pinatubo,(Jun 1991), it erupted during the El Nino of Apr 1991–Jul 1992, so, again, warming had begun before the eruption).
El Ninos are always caused by periods of cleaner, more transparent air, which causes more surface warming
,
The irony is that many of us geoscientists would actually prefer that humans were in control of global temperature because then we might be able to avert the onset of the next glacial period.
Arctic sea ice fluctuated both higher and lower than now before H. sapiens sapiens evolved.
In the timescales under consideration Leif is right. But over geologically short times milankovitch cycles are there. 10,000 years ago we had an ice cap over much of the northern hemisphere, and it wasn’t changes to CO2 that made it retreat.
What climate models now cannot do is to say with certainty that in X years time the temperature will be Y. That’s because volcanism could completely change sunlight penetration to the surface. As we know this is unpredictable. A major volcanic eruption will happen again, and all bets will be off when it does.
The “milankovitch” cycles are not caused by the Sun, but by Jupiter changing the Earth’s orbit.
Not completely correct, Leif. The Milankovitch cycles are not just changes in Earth’s orbit (which is mainly caused by Jupiter but also by other planets) but also changes in obliquity and precession of the Earth’s axis caused by the moon and sun through tidal forces. You should know that.
You still haven’t addressed your phony statement that Be-10 shows solar activity to have been constant since the LIA when the data actually shows that it has dropped by almost a factor of two.
A good explanation can be found here:
Evolution of the Sunspot Number and Solar Wind B Time SeriesShow affiliations
Abstract
The past two decades have witnessed significant changes in our knowledge of long-term solar and solar wind activity. The sunspot number time series (1700-present) developed by Rudolf Wolf during the second half of the 19th century was revised and extended by the group sunspot number series (1610-1995) of Hoyt and Schatten during the 1990s. The group sunspot number is significantly lower than the Wolf series before ∼1885. An effort from 2011-2015 to understand and remove differences between these two series via a series of workshops had the unintended consequence of prompting several alternative constructions of the sunspot number. Thus it has been necessary to expand and extend the sunspot number reconciliation process. On the solar wind side, after a decade of controversy, an ISSI International Team used geomagnetic and sunspot data to obtain a high-confidence time series of the solar wind magnetic field strength (B) from 1750-present that can be compared with two independent long-term (> ∼600 year) series of annual B-values based on cosmogenic nuclides. In this paper, we trace the twists and turns leading to our current understanding of long-term solar and solar wind activity.
Publication: Space Science Reviews, Volume 214, Issue 2, article id. 56, 31 pp.
I show here one of their figures
Looks an awful lot like B has varied a whole lot. A factor of almost 2. How in the world do you get a constant solar output out of that?
I don’t say that B is constant [it varies from minute to minute]. What we observe st that there has been no long-term trend over the last 300+ years.
“The sunspot number time series (1700-present) developed by Rudolf Wolf during the second half of the 19th century was revised and extended by the group sunspot number series (1610-1995) of Hoyt and Schatten during the 1990s.”
1990’s “revised” 1610 data… Doesn’t this sound like a “guilty” plea from data manipulators?
Oddgeir
Indeed, I assume across recent geological time Solar Insolation is constant, and is effective constant regarding all current climate models outside the minor change with solar activity?
Oops I meant irradiance, not Insolation, which will vary with precession at higher latitudes.
Tilt (obliquity) is probably more important than eccentricity or precession.
Yes, of course the sun is not a being with rational thought, capable of presenting an explanation. But that’s a bit pedantic, isn’t it? I think that you’re well aware that the figure of speech is short for “we can explain the redistribution of heat by reference to the sun and sunspot cycles”.
Clearly
From my fig.2 it is not the CO2 that did it.. .
https://breadonthewater.co.za/2021/04/05/unexpected-ice/
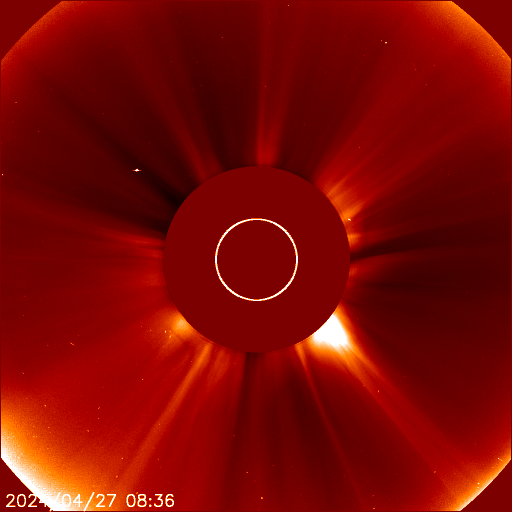
The heat is coming from the top if the world.
Here comes the sun!
Whoops!
Jim, thumbs up for the transcript.
In Hubert Lamb’s classic 1972 book “Climate Present, Past and Future Volume 1 page 324 he makes some comments about the possible changes to the rivers of the then Soviet Union to the effects on salinity and consequently ice cover. I quote the bottom part of the top paragraph of the page mentioned as follows:” Should it ever become necessary to tap off any large proportion of the flow of the Siberian rivers to irrigate the arid lands in central Asia, where increasing population, cotton growing and industrialisation demand more water than is currently available, such action might therefore lead to a significant increase in the salinity of the surface water in parts of the Arctic Ocean and reduce the ice cover there, since the water vapour evaporated in central Asia would presumably be carried away to the Pacific by the upper westerly winds.” I have no idea what has changed in the flows of the Yenisei, Ob etc but perhaps someone else here can help.
Peter F. Gill: “I have no idea what has changed in the flows of the Yenisei, Ob etc”
WR: Probably not so much: plans became stalled. Some more info here: https://en.wikipedia.org/wiki/Northern_river_reversal
Has there been any change in the salinity of surface water in the Arctic?
It seems , if anything, salinity may have decreased
https://www.pmel.noaa.gov/arctic-zone/detect/climate-ocean.shtml
This ties in quite well with my work involving solar variations altering jet stream meridionality which affects global cloudiness and the proportion of solar energy able to enter the oceans.
The climate system then swings between warming periods of El Nino dominance and cooling periods of La Nina dominance.
Depending on which is dominant the heat flowing through all the ocean basin circulations will then vary too.
I have noticed that alarmists accept that La Nina has a cooling effect but they still resist El Ninos as a primary cause of warming.
Now that the cost of net zero is becoming apparent one can only hope that people in power will start to question that so called ‘consensus’ which readers here know to be completely false.
El Nino conditions normally increase during centennial solar minima because of an increase in negative North Atlantic Oscillation conditions, And El Nino episodes are teleconnected to major warm pulses of the AMO with an 8 month lag. E.g. in Aug 1998, Aug 2010, and Aug 2016:
https://psl.noaa.gov/data/correlation/amon.us.data
So they are sometimes in phase and sometimes out of phase but over long periods of several solar cycles solar minima shift ENSO in favour of La Niña dominance.
It is no coincidence that we are now seeing a second La Niña in two years.
There is typically an increase in El Nino conditions during each centennial solar minimum, because negative NAO is directly associated with slower trade winds. That increases major warm pulses to the AMO.
Note the frequency of El Nino episodes 1807-1821:
https://sites.google.com/site/medievalwarmperiod/Home/historic-el-nino-events
The NAO, AMO, El Nino and La Nina, and the sun all have different periodicities so one can pick out periods where your observation is accurate but that does not alter the underlying reality of active sun resulting in warming and inactive resulting in cooling.
By your account the El Ninos during solar minima would offset any cooling and that is not what we observe.
Note that I am not saying anything about the timing of either El Ninos or La Ninas. My point is that solar variations alter the balance between them within the overarching ENSO cycle.
Thus it is possible for us both to be right.
“the underlying reality of active sun resulting in warming and inactive resulting in cooling”
That’s backwards globally. There was rapid AMO and Arctic warming from 1995 because of weaker solar wind states since then. The cooling of the 1970’s was due to stronger solar wind states driving colder ocean phases.
“By your account the El Ninos during solar minima would offset any cooling and that is not what we observe.”
No it drives warming, which is what we observe in the current and in the previous centennial solar minimum.
Stephen Wilde:
All La Ninas are caused by the volcanic injection of SO2 aerosols into the stratosphere, which cools the Earth’s surface
All El Ninos are caused by decreased amounts of SO2 aerosols in the atmosphere, as when a volcanoes SO2 pollution settles out of the atmosphere, cleansing the air..
El Ninos are temporary events, and NOT a primary cause of warming…
However, the primary cause of warming is the reduction in the amount of Industrial SO2 aerosol pollution in the Troposphere, due to global Clean Air efforts
Net Zero will cause temperatures to rise, because the abandonment of the burning of fossil fuels will remove their cooling SO2 aerosol emissions from the atmosphere.
Stephen Wilde.
For how the our climate ACTUALLY works, you (and the moderator) need to read my peer reviewed article “A Graphical Explanation of Climate Change”
http://www.skepticmedpublishers.com/article-in-press-journal-of-earth-science-and-climatic-change/
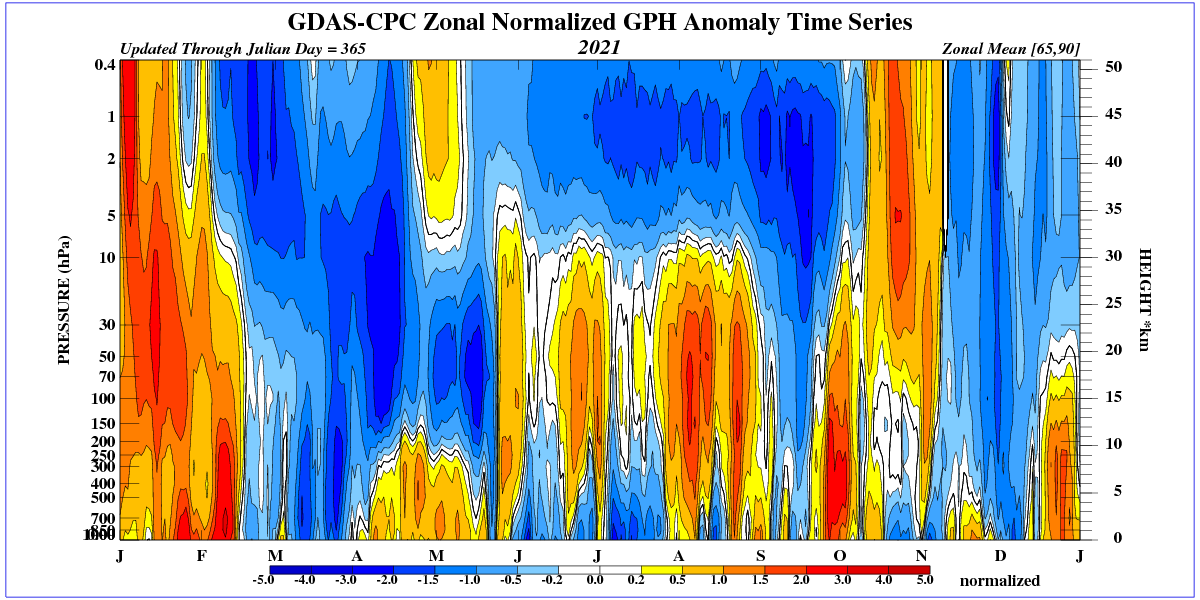
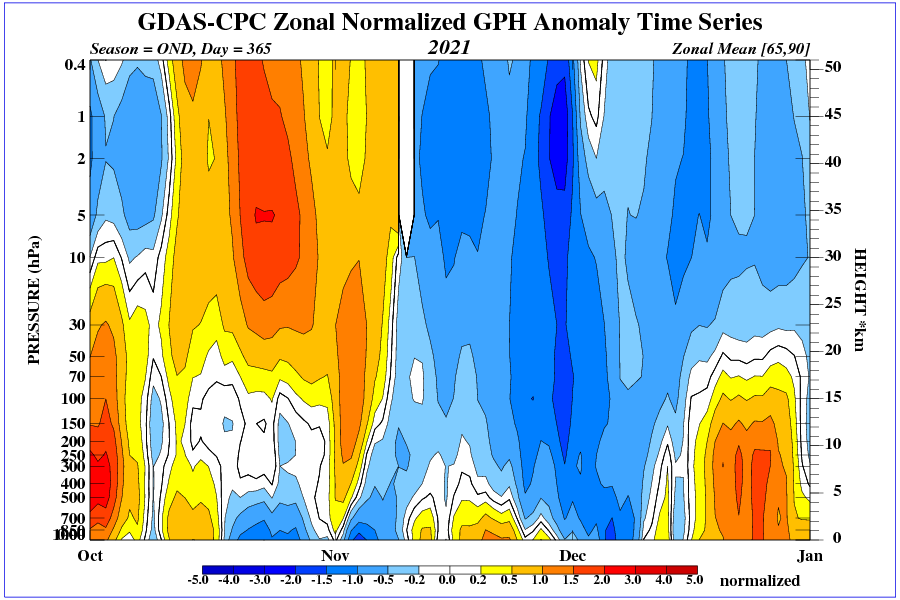
The next graph shows a clear increase in the geopotential height above the Arctic Circle at 500 hPa also since 2006.

https://psl.noaa.gov/cgi-bin/data/timeseries/timeseries1.pl
“…The next graph shows a clear increase in the geopotential height…”
Hmmm….on a more practical scale of sea level to top of Troposphere, it’s a 70 year horizontal flat line…..
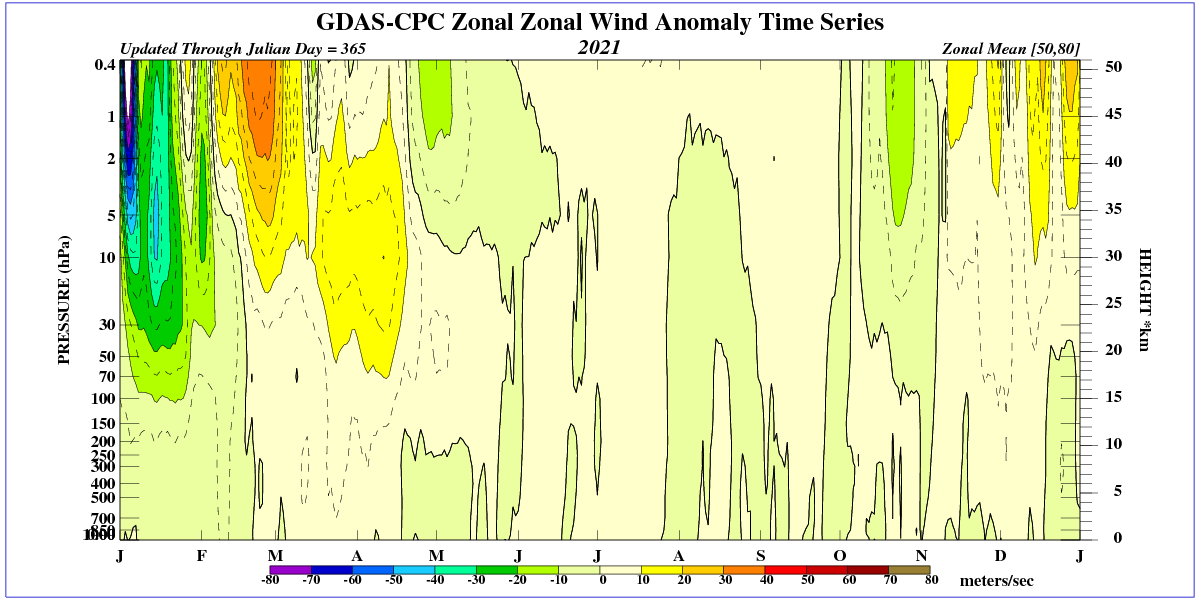
During periods of low solar activity, the specific humidity over the Arctic Circle increases. There has been a marked decline since the 1950s, a halt in the decline in the 1970s, another decline until 2000, from which the increase began.
This is the result of the weakening of the polar vortex as moist air from the south passes the polar vortex barrier.
That would be the more meridional jet stream tracks. As I have said many times, I first noted increasing meridionality around 2000.
Negative NAO since 1995, while Jim thinks that positive AO warms the Arctic.
Plot of 5S-5N specific humidity at 300 hPa from 0 to 360 degrees.
https://psl.noaa.gov/cgi-bin/data/timeseries/timeseries1.pl
Graph of geopotential height above the Arctic Circle at 500 hPa.
The presence of water vapor at the top of the troposphere evidently has a cooling effect under strong sunlight. Therefore, a drop in humidity at 300 hPa may have the effect of causing the temperature of the continents to rise during the summer season. The opposite effect will occur in winter. Therefore, a period of very low solar activity can result in extreme summer and winter temperatures.
The plot of relative humidity over the equator (5S-5N) (300 hPa) shows a sharp decline in 2006. In the same year there was a deep decline in the Ap index.
The increase in geopotential height over the Arctic Circle since 2006 is very pronounced at 250 hPa (jet stream).
https://psl.noaa.gov/tmp/climindex.217.96.140.193.302.5.15.9.pn
From the transcript. “….Stronger magnetic fields slow the rotation of the earth, which then affects the eastward momentum of the oceans current. During low sunspot periods, such as the Dalton minimum in the early 1800s, the Earth’s rotation sped up….”
That’s a pile of pooHaw, Jim. Better so some calcs on that! The change in rotational speed of the planet is calculated out by scientists and incorporated when necessary by adding “leap seconds” to our clocks, approximately one every 1.5 years. 1 second in 5×10^7 just makes no difference at all to the momentum of an ocean current that is measured in meters per second, even if it might have accidentally occurred at the Dalton minimum.
I agree that Jim’s speculation on that point seems unlikely.
Instead of a change in rotational speed for the entire planet one just needs a change in density differentials within the length of the ocean circulation. My proposed changes in jet stream meridionality and global cloudiness would be enough to achieve those density changes which would start at the equatorial water surfaces and then flow through the thermohaline circulation.
Those changes in the speed of the thermohaline circulation would explain what happens to any excess heat whilst Willis’s thermostat hypothesis is in progress. His thunderstorms do not eject it all to space because faster upward convection also leads to faster downward convection and that extra energy emanating from enhanced downward convection gets subducted into the body of the ocean to energise the thermohaline circulation, in particular the ENSO aspect.
Looking for a way to ask what is admittedly mostly off topic, but speaking of ENSO…
Does anybody know if the ENSO meter is working properly? Today it shows about -0.55, slightly into the Nina zone. I recall that very recently it was showing positive but still slightly in the neutral range.
…
Thanks. Seems that the ENSO meter was on the fritz for a good long while then.
https://earth.nullschool.net/#current/ocean/surface/currents/overlay=sea_surface_temp_anomaly/orthographic=214.79,-5.50,371/loc=-42.852,73.441
Seeing big areas of pacific that are a bit below average SST.
It is not an argument that a small change in momentum is the sole cause. As I said in the video its not wise to base predictions on a single variable for such a complex issue as climate. I am presenting arguments by other that have detected correlations with sunspots max and mins, and the earth’s rotation LOD and climate change. The illustrations are from Morner 2020 who does not argue that sunspots are the only factor.
Mazzarella and Scafetta come to similar conclusions in their 2018 paper The Little Ice Age was 1.0–1.5 °C cooler than current warm period according to LOD and NAO.
There are others that detect a relationship between NAO and sunspots and rotation.
There are many studies that finding changes in rotation must be accounted for.
In Mitrovica’s 2015 paper Reconciling past changes in Earth’s rotation with 20th century global sea-level rise: Resolving Munk’s enigma after accounting for changes in rotation and Glacial Isostatic Adjustments they found 20th century seea level rise was only 1 mm/year, Similar to what Morner had been claiming.
So I suggest looking into the studies regards changes in rotation because several great minds of science do not consider effects from rotational changes a “pile of pooHaw”
I think rotational changes might well contribute to long term climate variations but not the current issue of concern which is variability on the scale of a few decades or so.
I would think it more likely that changes in ocean local depth or density due to temperature or thermohaline profile might cause a slight change in the planet’s rotational velocity to conserve angular momentum. I did no calcs…it’s easier to get a ton of speculation out of hardly an ounce of thought that way….
The negative North Atlantic Oscillation conditions of the LIA centennial solar minima drove a warmer AMO and Arctic.
Question: if sunspot number had an influence on the Earth’s rotational speed, wouldn’t that show up as deviations of the length of days and nights. Wouldn’t that have major effects on our timing, clocks and so on?
Sunspot number is correlated with solar magnetic field strength and the solar wind. The influence of this on the Earth’s rotation must be, if any, extremely small… I would then think Swensmark’s hypothesis of cosmic rays on cloud formation would have a greater effect.
Here the scary truth, it’s climate change, of course 😀
As ocean water gets warmer due to climate, seawater expands thereby raising sea levels and changing the ocean’s circulation and even exerting more pressure on the ocean floor below in some areas, explained Jochem Marotzke of the Max Planck Institute in Germany.
Global Warming to Change Day’s Length
That seems unlikely because while the total column of water increases, the expanded water has a lower density. Thus, the total force is constant.
Don’t US scientists see a connection between winter ozone distribution and weakening of the geomagnetic field over North America (and South America)?
http://www.geomag.bgs.ac.uk/images/charts/jpg/polar_n_df.jpg
Ozone is diamagnetic and as such is repelled by a stronger geomagnetic field. It similarly responds to stronger solar wind. This distribution of ozone guarantees an influx of arctic air deep into the US.
While a “stronger geomagnetic field” can have have a repulsive effect on diamagnetic materials, more importantly it must be a non-uniform field. That is, the magnetic flux lines must be converging, which happens primarily at the poles. However, most of the ozone is generated in the tropics and moved pole-wards by the Brewer-Dobson Circulation. The non-uniform geomagnetic field may assist in that, but I’d be surprised if it was as important as density and temperature differences.
https://agupubs.onlinelibrary.wiley.com/doi/full/10.1002/2013RG000448
What is happening to the north polar vortex?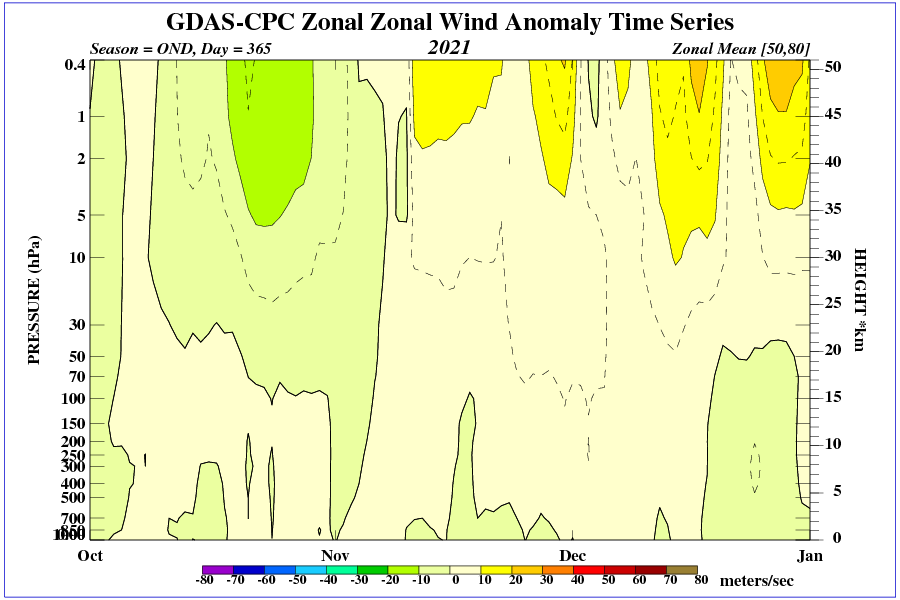
Because of the elliptical orbit the solar non-constant swings 90 W/m^2 from parhelion to aphelion.
Because of the tilted axis 40 N latitude TOA sees a 700 W/m^2 swing from summer to winter.
The poles spend weeks with negative W/m^2 and weeks of a several hundred 24/7.
A few W/m^2 variation from the sun is trivial.
As is 2 to 8.5 from GHG “radiative forcing” a term akin to caloric and phlogiston.
I have a hypothesis that changes in ozone production will have a large impact on the circulation in the stratosphere, especially in winter at high latitudes.
https://www.iup.uni-bremen.de/gome/gomemgii.html
“If energy from the Sun decreased only slightly, why did temperatures drop so severely in the Northern Hemisphere? Climate scientist Drew Shindell and colleagues at the NASA Goddard Institute for Space Studies tackled that question by combining temperature records gleaned from tree rings, ice cores, corals, and the few measurements recorded in the historical record, with an advanced computer model of the Earth’s climate. The group first calculated the amount of energy coming from the Sun during the Maunder Minimum and entered the information into a general circulation model. The model is a mathematical representation of the way various Earth systems—ocean surface temperatures, different layers of the atmosphere, energy reflected and absorbed from land, and so forth—interact to produce the climate.
When the model started with the decreased solar energy and returned temperatures that matched the paleoclimate record, Shindell and his colleagues knew that the model was showing how the Maunder Minimum could have caused the extreme drop in temperatures. The model showed that the drop in temperature was related to ozone in the stratosphere, the layer of the atmosphere that is between 10 and 50 kilometers from the Earth’s surface. Ozone is created when high-energy ultraviolet light from the Sun interacts with oxygen. During the Maunder Minimum, the Sun emitted less strong ultraviolet light, and so less ozone formed. The decrease in ozone affected planetary waves, the giant wiggles in the jet stream that we are used to seeing on television weather reports.
The change to the planetary waves kicked the North Atlantic Oscillation (NAO)—the balance between a permanent low-pressure system near Greenland and a permanent high-pressure system to its south—into a negative phase. When the NAO is negative, both pressure systems are relatively weak. Under these conditions, winter storms crossing the Atlantic generally head eastward toward Europe, which experiences a more severe winter. (When the NAO is positive, winter storms track farther north, making winters in Europe milder.) The model results, shown above, illustrate that the NAO was more negative on average during the Maunder Minimum, and Europe remained unusually cold. These results matched the paleoclimate record.”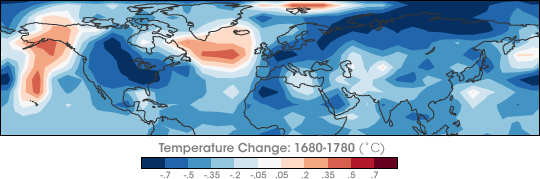
https://earthobservatory.nasa.gov/images/7122/chilly-temperatures-during-the-maunder-minimum
The same circulation as in the graphic above (Maunder’s Minimum) is currently observed over North America.
A lot of snow will fall in Europe this winter.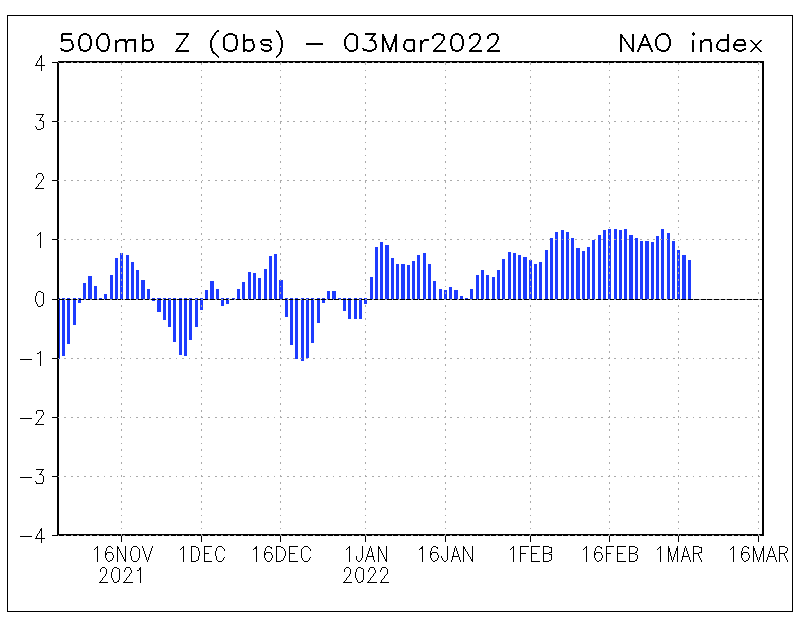

Hopelessly backwards.
The reason for rising CO2 levels during the LIA is a warmer North Atlantic reducing the CO2 uptake there.
The idea that increased sunspot activity also increases solar wind effects is thoroughly misleading. The solar wind was the strongest in the space age during the early to mid 1970’s in a smaller sunspot cycle, and which drove a colder AMO and Arctic. Solar wind strength does not follow sunspot numbers, there were major lows in the solar wind in 1969 and 1979-80 at sunspot maximum, and the major lows then shifted to around a year after sunspot minimum since the 1990’s. Which is why AMO anomalies shift in and out of phase with sunspot cycles:
https://www.woodfortrees.org/graph/esrl-amo/mean:11/plot/sidc-ssn/from:1850/normalise
The idea that the Arctic cooled during the Dalton Minimum is false, British naval ships observed a large loss of sea ice 1815-1817.
The AMO and Arctic are normally warmer during each centennial solar minimum.
Perhaps this foreshadows a very snowy winter in Western Europe.
The Danish Maritime Institute data on 140 years of Arctic Sea Ice Extent shows clearly an approximately 75 year return cycle with a maximum at approx. 1975, which I remember as a cool time. It has always been my considered, and maybe expert, opinion, that 75 years must be the natural return cycle time resulting from the ocean channel dimensions, water level and cosmic excitation forces.
What is the CAGW that the world fears?
A ice free arctic polar sea ice arctic in winter.
But first we have to get ice free arctic polar sea ice arctic in summer.
And it looks like we aren’t going to get an ice free arctic polar sea ice arctic in summer
anytime soon.
But earlier in our Holocene in period called the Holocene climate optimum we probably had ice free arctic polar sea ice arctic in summer and the sandy hot Sahara desert had rivers, and forests and grasslands. And frozen tree stumps in arctic region were growing trees.
CAGW is deserts becoming forests and grasslands.
Or CAGW is having higher global water vapor- because we have less arctic sea ice.
One has to go to Antarctica to get colder the -50 C, weather.
The Horror!
Arctic max sea ice extent from the NSIDC in miliion square kilometers.
2015 14.51
2016 14.52
2017 14.42
2018 14.48
2019 14.78
2020 15.05
2021 14.77
The decade 2021-30 is liable to average higher than 2011-20, which saw the record low summer minimum of 2012, plus other late summer cyclone-induced low minima in 2011, 2016, 2019 and 2020. Higher years occurred in 2013 and 2014, with 2015, 2017 and 2018 medium.
There is a very unfortunate consensus among many popular sceptics, that lower solar activity leads to a colder phase of the North Atlantic. And no amount of data or logic seems to make them change their minds. Not even the most obvious fact that the AMO is warmer in this centennial solar minimum, and was also warmer in the late 1800’s centennial solar minimum.
Getting the plot backwards hands it on a plate to the alarmists for their fake narrative of how the Arctic warmed so rapidly from 1995, even though the IPCC circulation models failed to predict such rapid Arctic warming, primarily because they don’t model the AMO. It’s the worst possible own goal for scepticism.
https://www.woodfortrees.org/graph/hadcrut4gl/mean:11/plot/esrl-amo/mean:11/detrend:-0.95/offset:-0.4
In fact knowing that the AMO is warmer during each centennial solar minimum, and given an additional warm AMO phase between centennial solar minima, the mean AMO envelope frequency over millennia can be calculated at 54 years. Several papers estimate 55 years from AMO proxies.
SC25 is slowly progressing up the scale, but at this rate it appears that this minimum is slightly weaker than the one hundred years ago, considerably weaker than the Dalton minimum, and it is unlikely to make strong impact either on the Artic, N. Atlantic or global temperatures as did two previous Grand minima.
Correction: this is up to date graph
It has always seemed to me when looking at this issue that Arctic Ice extent and thickness conditions are “sticky”. A loss of ice increases solar absorption which prolongs and increases ice loss. This also creates more open water for wind to prevent ice formation and break up ice that does form as the wind increases mixing. Open water actually loses heat faster than ice covered water so the Arctic ocean cools. Once ice gets to some minimum condition and the ocean has cooled sufficiently, an actual tipping point occurs, whereby a tiny reduction in solar input or a series of colder than average winters or greater than average cloud cover will begin the process of increasing ice extent. This reduces the effect of wind on break up of the ice and so multi-year ice increases as albedo does likewise. Ice grows like this until the ocean is sufficiently covered that it stops losing heat at the relatively high rate.
This “stickyness” causes the Arctic ocean ice cycle to be significantly out of phase with whatever it’s initial switching mechanisms may be.
This is also what happens when we enter a period of renewed glaciation. A minor change in axial tilt puts the Earth into a condition where the Arctic ocean is covered and the summer heat input is at a steep enough angle that the albedo is greater than the insolation and the sea ice becomes year round, significantly reducing albedo in summer and allowing the ice margin to grow each winter more than is lost in summer.
The Earth’s Northern geography at present places us in this permanent tipping point position by making the Arctic into a somewhat isolated basin.
Alarmists must be laughing their butts off at this. Solar activity is now lower than in the 1970’s, but the AMO and Arctic are currently in a warm phase. The AMO is warmer when the solar wind is weaker, not when solar irradiance is higher.
1 W/m-2 is 1/1000th of the energy bombarding the surface of earth every hour (1 kW/h, earth seen as a disc from the sun). With a diameter of 12750 km, the bombardement amounts to 21 million barrels (1700 kWh/bbl) of oil worth of energy per SECOND.
1 per mille over 350 years amounts to 232 million million (232e12, trillion, not billion) barrels of oil worth of energy.
That amount of energy sure is enough to do something to the climate. It might be enough to take us from LIA to today.
Oddgeir