By Kirye
and Pierre Gosselin
Has anyone ever wondered why many Swedes like going south for their summer holidays?
Today to answer that question, we look at the July, 2021, mean temperature data for the stations in northern Europe for which the Japan Meteorological Agency (JMA) have enough data.
Remember, global warming is said to be most visible at the far northern and Arctic regions, so northern Europe in places like Scandinavia should be showing signs of warming over the past 2 decades. But that isn’t the case.
All the plotted data below are from the Japan Meteorological Agency.
Sweden
First we look at the mean July temperatures at 6 stations in Sweden, home of global warming alarmist teenager, Greta Thunberg:
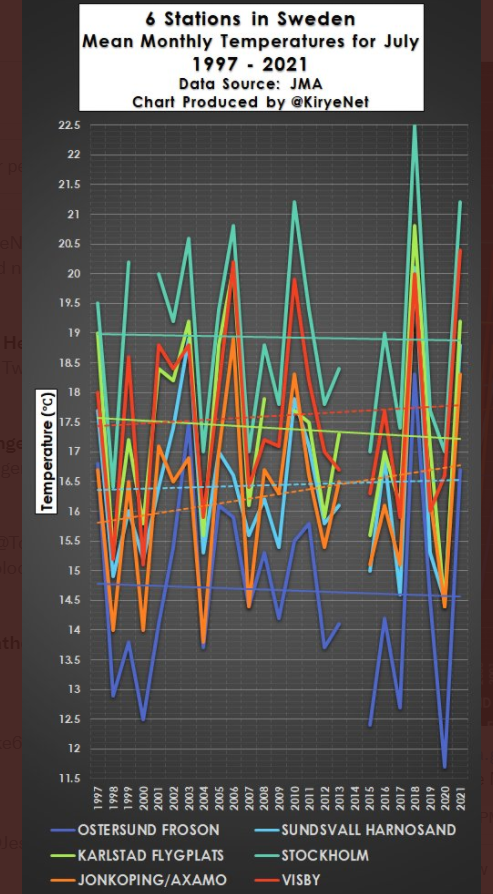
Since July 1997, three of 6 stations have shown no warming. Taken altogether, midsummer in Sweden is showing nothing unusual happening in terms of mean temperature.
Norway
The JMA has sufficient data for meaningful plots for 11 stations in Norway, Greta Thunberg’s neighbor to the west, which is located next to the far northern Atlantic and Arctic oceans:
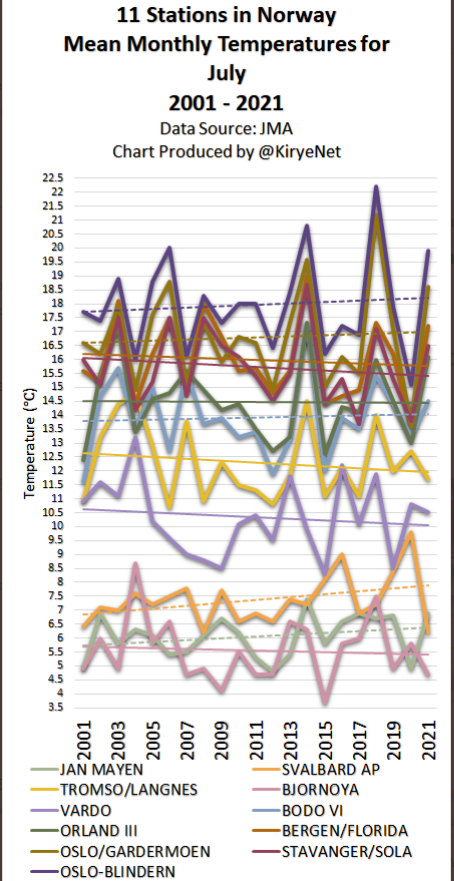
Here as well we see nothing unusual going on, except that it is not warming up as predicted.
Six of 11 stations saw no July warming in Norway in 2021, going back 20 years. There is no reason to panic. Panic, by the way, is what lets them control populations. By not panicking, you’ll get the alarmists to panic about losing hold on their panic-based power.
Finland
Tabulating the data from the 6 stations for which the JMA has sufficient data for meaningful plots, Finland also has seen no notable mid-summer warming in almost a quarter century:
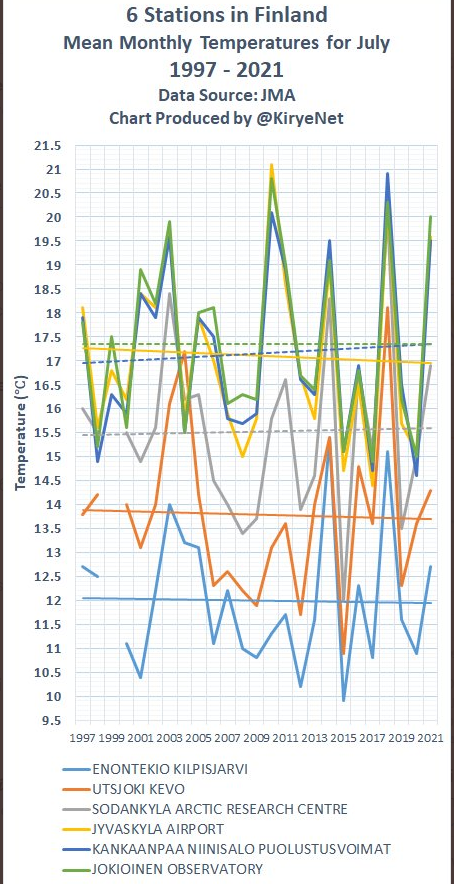
Four of 6 stations in Finland show cooling or no meaningful July warming at all. Taken altogether, there’s probably in fact a slight amount of cooling in July.
As readers will note, mean July temperatures over northern Europe are usually deep into the teens Celsius, meaning Greta can expect having to always keep warm clothing at hand year-round – for the rest of her life.
I smile when I see British news sites calling 25 C “a heat wave”.
I live in central Texas.
They have to keep the narrative going somehow
The BBC defined a heat wave of temp of 25 to 28 deg C for 3 consecutive days. They didn’t describe what 29 and above was. Currently in the East of England 20 deg C but feels like 17.
Oh for 25 deg.
Currently 19°C in East Anglia outside of towns
Its comfortably cool.
19 deg, light rain : typical English summer.
29 deg C and above in UK is ” unprecedented is all of human history ” !!
Unless you’re standing on a runway at Heathrow!
Where the official thermometer for London resides.
The dictionary definition of a heat wave is “two plus days above normal”. What is normal?
I guess “normal” is what some senior citizen remembers it being.
“normal” is two plus days below today’s temperature.
Normal in the UK seems to be 20c to 23c depending on which baseline years you use.
That’s an extremely wimpy definition. Using that definition there will be a dozen or so heat waves every single year.
If the “average” is 80F, and for two days in a row you hit 81F, that’s a heat wave?????????
Easy to claim “unprecedented numbers of heat waves” if you change the definition.
TWO days above normal?
Wasn’t it more like 5 days in the 80’s or so?
Central USA is looking at highs of 34C for this week
That will be the high Tuesday through Friday of this week in Northern Virginia. That’s fairly mild for this time of year.
Most of August has been mild to cold in Virginia. Hitting 85°F a number of days was only possible by misplaced thermistors at the local airport.
When predictions announced that Virginia would have over 100°F days, it ended up one day barely reached 100°F. So, the news stations focused telling people what the “feels like” temperatures were doing.
Besides, NWS’s temperature forecast have frequently been for “hot weather” that fails to materialize this year.
thats 93 degrees F
Tomorrow I’m moving to a new house in calgary
And the predicted high is 11C
16 degrees below normal
Granted we had some nice hot weather in western canada, nicest summer in 2 decades, other that the fires in BC, which are above average this year (not abnormal or extreme Griff).
Above average, without such years the average decreases
We had some lovely summer weather in BC for a about a month. The media was determined that all of it was a “heatwave” but it was summer- been happening every year for many many many years.
As to the the forest fires, they are a direct result of the pine beetle we had a few years ago along with no forest management in the interim other than harvesting the financially viable deadfall.
Of course that never gets mentioned because now there is the boogeyman of CC that governments everywhere can blame all their woes on AND try to use to control us.
Summer temps well over 40C are normal in many parts of Oz. Call 25 a heat wave? That’s not a heat wave. 40+ is a heat wave!
(Apologies to the Croc.)
“They didn’t describe what 29 and above was”
Heat tsunami?
Scots folk (as in Edinburgh last year) definitely think it is a heatwave over 20C…
White is a Scot’s suntan. Their normal colour is blue.
An old Connolly joke if I’m not mistaken 😉
As my wife says, you spelled “Connolly” correctly. 🙂
Dude, so do we, sitting in Britain!
Heat wave us over 30°C for several days…
But its possibly more humid than Texas
Lol more humid then Texas!
Depends on what part of Texas.
Houston is not the place to be in August unless you are a masochist.
I was warned about prickly heat by the holiday reps. when I went on holiday to Florida a decade ago so the climate is a bit different to the Mediterranean
Presuming you are referring to Houston… Or communities on the Louisiana border?
A place where one looks up to see where birds and dragonflies are flying above the thick layer?
A place where you are tempted to start using a breast stroke and kick instead of walking to make progress on the ground?
Where breathing itself is a strenuous exercise?
Where sweat soaks one’s clothes while standing still?
All unlike the rest of Texas;
Where sweat evaporates quick enough to chill a person?
Where one learns to keep one’s mouth shut to save moisture?
Where all lakes and ponds are artificial because natural ones dried up long ago?
Where cooking good chili and drinking beer are valid outside exercises?
It’s 27C bright and early this morning in East Texas. The expected high is 35C. I will be looking forward to tomorrows low temp of 23C. Of course, the humidity is 97% so, add a few degrees for the wet bulb temp.
Kind of funny considering the ambient temperature in IUPAC’s SATP is 77d F (25d C) though I suppose they consider their climate’s standard. to be NTP (68d F) and they’re happy you folks down Texas’ way stream weather to them or they’d be relating everything to STP (32d F).
We have not seen 25C for about a month now, even 20C would do and probably declared as ‘scorchio’
Tom
The planet’s average surface temperature about 59 F or 15 C, therefore 25C would qualify as a heatwave /sc
Comparing an average to a temperature actually measured at fixed points in time and space?
Just as bogus as the IPCC’s comparisons.
Earth started natural cooling circa 2020. Told you so, 19 years ago.
Global warming alarmism is a 50-year-old fraud – wolves stampeding the sheep.
Regards, Allan
In 2002, co-authors Dr Sallie Baliunas, Astrophysicist, Harvard-Smithsonian, Dr Tim Patterson, Paleoclimatologist, Carleton U, Ottawa and Allan MacRae, P.Eng. (now retired), McGill, Queens, U of Alberta, published:
https://friendsofscience.org/assets/documents/KyotoAPEGA2002REV1.pdf
1. “Climate science does not support the theory of catastrophic human-made global warming – the alleged warming crisis does not exist.”
2. “The ultimate agenda of pro-Kyoto advocates is to eliminate fossil fuels, but this would result in a catastrophic shortfall in global energy supply – the wasteful, inefficient energy solutions proposed by Kyoto advocates simply cannot replace fossil fuels.”
Allan MacRae published in the Calgary Herald on September 1, 2002, based on communication with Dr Tim Patterson:
https://wattsupwiththat.com/2009/01/10/polar-sea-ice-changes-are-having-a-net-cooling-effect-on-the-climate/#comment-63579
3. “If [as we believe] solar activity is the main driver of surface temperature rather than CO2, we should begin the next cooling period by 2020 to 2030.”
MacRae updated his global cooling prediction in 2013, based on cold events that occurred starting circa 2008 near the end of Solar Cycle 23:
https://wattsupwiththat.com/2013/12/02/study-predicts-the-sun-is-headed-for-a-dalton-like-solar-minimum-around-2050/#comment-1147149
3a. “I suggest global cooling starts by 2020 or sooner. Bundle up.”
________________
THE REAL CLIMATE CRISIS IS NOT GLOBAL WARMING, IT IS COOLING, AND IT MAY HAVE ALREADY STARTED
By Allan M.R. MacRae and Joseph D’Aleo, October 27, 2019
https://wattsupwiththat.com/2019/10/27/the-real-climate-crisis-is-not-global-warming-it-is-cooling-and-it-may-have-already-started/
Let’s contrast our successful predictive track record to the colossal predictive failures of the global warming fraudsters:
Earth started a new cooling period circa 2020, as we predicted in 2002.
See hundreds of extreme-cold events at electroverse.net
Big fail for the phony global warming alarmists. Bundle up!
NEW ZEALAND SEES 1+ METER (3.3 FEET) OF SNOW IN 24 HOURS, SUMMER FLURRIES HIT ALBERTA, AS “WILDFIRE SEASON-CHANGING” STORMS AND RECORD COLD SWEEP THE U.S.
August 19, 2021 Cap Allon
“The significant rain and cold temperatures over a prolonged period will do wonders for the fires … this was a knockdown blow.”
FALL-LIKE ARCTIC FRONT TO GRIP MUCH OF NORTH AMERICA: SNOW FORECAST FOR MONTANA, WYOMING, UTAH AND COLORADO
August 18, 2021 Cap Allon
This is something of ‘summer spanner’ in the AGW works. The MSM has been milking the Pacific Northwest’s heat for all it’s worth in recent weeks. But now, we get to sit back and enjoy them squirm and obfuscate their way through a record-breaking bout of August cold.
“UNSEASONAL” SNOW BLASTS KASHMIR, SOUTH AFRICA’S FOOD PRICES SOAR DUE TO EXTREME FREEZE, EUROPEAN CROP WOES, + RARE LOW-LEVEL SNOW HITS TASMANIA
August 17, 2021 Cap Allon
According to Strategie Grains, global crop failures are threatening “explosive situations for barley and wheat” markets. #CropLoss
Excerpt from my recent paper
CLIMATE CHANGE, COVID-19, AND THE GREAT RESET Update 1d
“Rode and Fischbeck, professor of Social & Decision Sciences and Engineering & Public Policy, collected 79 predictions of climate-caused apocalypse going back to the first Earth Day in 1970. With the passage of time, many of these forecasts have since expired; the dates have come and gone uneventfully. In fact, 48 (61%) of the predictions have already expired as of the end of 2020.”
Climate doomsters have a perfect NEGATIVE predictive track record – every very-scary climate prediction, of the ~80 they have made since 1970, has FAILED TO HAPPEN.
Fully 48 of these predictions expired at the end of 2020. Never happened! Never will!
What are the odds at 50:50 per prediction?
3.6*10^-15 = 0.0000000000000036
That is one in 281 Trillion!
There is a powerful logic that says no rational person or group could be this wrong, this utterly obtuse, for this long; they followed a corrupt agenda, and they lied again and again.
The ability to predict is the best objective means of assessing scientific competence, and the global warming alarmists have NO predictive track record – they have been 100% wrong about everything and nobody should believe these fraudsters – about anything!
The plural of anecdote is not data. Depite all the cherry picking on this site, the world keeps warming. I tells ya, reality is a liberal conspiracy.
Phony Tony – innumerate troll.
Earth has cooled since Feb 2020 (UAH LT).
La Nina looks more and more probable – more cooling to follow.
.
It hasn’t been warming for the last 10 years or so.
And since most of the small and entirely beneficial 1C or so of warming that has been seen over the last 150 is entirely natural, so what?
PS: So every heat wave and every flood is not proof of global warming?
Well of course – it’s a matter of relativity.
The average maximum temp in the UK is near 22C in England and 18C or less in Scotland.
In Texas it’s 35C.
Couple that with our houses not having air conditioning and the fact that they are all made of brick.
Which absorbs daytime solar heat and acts as a storage radiator at night to allow no relief.
Oh, I’m so sorry Mr. Banton, I was under the impression that we were discussing outside temperatures, I had no idea the Met Office figures were for the temperatures inside our houses.
good point! 48 C in Italy makes Texas look like pussies!
Tom,
I have just come home after spending a month near Dallas. I now know what you are talking about. The usual afternoon temperatures were in the low to mid 30s and the night-time 4 am lows were typically an impressive 28 C.
British news sites calling 25 C “a heat wave”.
Only because they change the goal posts-
The incredible heat-wave of 23rd June/8th July 1976. After a hot day on 22nd June 1976 (maximum temperature 26.3°C) a remarkable heat-wave commenced in Royston during which the temperature reached or exceeded 30°C every day from 23rd June to 8th July (i.e. a consecutive 16 day period). The sequence was broken on 9th July when a temperature of ‘only’ 25.6°C was attained
http://www.iceni.org.uk/index/heatwave.htm
Anyway it’s all relative –
At the south pole -15°C is regarded as “a heat wave”
My friends in Sweden have been complaining about how warm it is, high teens to 20s. Heat is all relative to what you are used to. In the dead of winter when there is a thaw in Wisconsin, everyone breaks out their short and sandals to cavort in above freezing temps of 10-12C!
The Weather Channel is yapping about “Potential disruption due to extreme high temperatures.” The predicted high temperature for northern Portugal today is 25C. My friends and neighbors have been complaining bitterly about how cold it has been this summer….
And afternoon heat in the Eastern United States has been on the decline since the 19th century:
It snowed in Colorado when a cold front came through this past Friday evening.
https://www.9news.com/video/weather/weather-colorado/snow-fell-eisenhower-tunnel/73-6d7dc5d5-f7c7-4a4d-b995-e7e6c88cb818
An early winter. The Colorado mountains have 2 seasons, July/August and winter.
Now July and Winter.
When I lived in Colorado Springs in 2001, we got four inches of snow on May 21 and the peaks were white before Labor Day with snow on the ground in the Springs in August!
There is a definite decline in Silicon Valley. 25 years ago, Summer temps were routinely in the high 80s to low 90s with excursions to high 90s. The last 15 years typical Summer temps have been in the 80s. This year so far has been high 70s to mid 80s. Very noticable. Most people living here moved here in the last 20 years and don’t believe it when I tell them so.
That’s an important point. It’s hard to claim that global warming is going to be catastrophic when all the warming is at night and in the winter. link
That’s well before people rarely saw the distant mountains clearly.
We see the other main effect of climate change: increased rainfall…
No, we don’t. Stop lying, griff.
According to NOAA’s Climate at a Glance it is:
https://postimg.cc/K4206fL5
Just so you know, Tony Heller uses the same image.
[ Hmmmm, maybe images don’t show on replies. ]
Eventually, NOAA may learn more in Excel than “best fit line.”
Or their use of averages where averages are improper and result in a false context.
They also do LOESS
This is a very bog standard summer, just like the ones in the 60s and 70s – in short cool, wet and disappointing.
UK Extreme Rainfall Trends
…a quick look at some of the other long running stations elsewhere in the country appear to show no significant trends either.
https://notalotofpeopleknowthat.wordpress.com/2021/06/07/uk-extreme-rainfall-trends/
NOAA is somewhat dodgy to say the least. Our Met Office is beyond the pale.
“This is a very bog standard summer, just like the ones in the 60s and 70s – in short cool, wet and disappointing.”
Nope:
https://www.metoffice.gov.uk/research/climate/maps-and-data/summaries/index
“The provisional UK mean temperature in June was 14.2 °C, which is 1.2 °C above the 1981-2010 long-term average. Mean maximum temperatures were up to 2 °C above normal in some northern areas, while mean minimum temperatures were similarly high in parts of eastern England. Most areas from Wales and the Midlands northwards had a dry month, with less than a third of the usual rainfall in some areas, but south-east England was very wet with more than double the average rainfall for some locations. The UK overall had 59% of average June rainfall. Sunshine was above average for northern and eastern areas, but just below average for some western fringes, with 107% of average overall.”
“The provisional UK mean temperature in July was 16.6 °C, which is 1.5 °C above the 1981-2010 long-term average. It was provisionally the equal fifth warmest July for the UK in a series from 1884. Mean maximum temperatures were up to 3 °C above normal in western Scotland and Northern Ireland, but close to normal in easternmost counties of England, while mean minimum temperatures were between 0.5 and 2 °C above normal generally. Many parts of England and parts of the Scottish Highlands had a wet month, with double the average rainfall amount in numerous places, but Northern Ireland, south-west Scotland and the far north of Scotland had a dry month. The UK overall had 93% of average July rainfall. “
1981-2010 ? What time the MET Office live ?
And you, to take it into account ? 😀
Compared with the 1961 – 1981 period June was 1.5°C above average and July 2.5°C above. As the comment was saying this summer was like the ones in the 60s and 70s that seems a better comparison.
I suspect August will bring the summer average down a bit.
The reason why I agree that this summer is typical of a 60s and 70s winter is that we have had more high pressure to the north and no plumes coming from Africa or the Mediterranean. I grew up during 60s/70s and I did not know that having sand deposited on your vehicle from the Sahara was even a thing, I was amazed when this happened.
For comparison with this article, July mean temperatures in the UK have been rising at a rate of 0.39°C / decade since 1997.
Not a statistically significant rise of course, but that’s waht you get if you look at one month in a small region over a short period.
And before a certain someone comes in to tell me that Mean temperatures tell you absolutely nothing; max temperatures over the same period have been rising at 0.5°C / decade.
And how much of that is due to UHI?
I couldn’t say, I’m just using the data the MO provide, but I expect it to be very little, or none at all.
a) These are maximum temperatures in the middle of summer. You would expect UHI to have the biggest impact on minima. The fact that max is warming faster than min over this period suggests something other than UHI is causing it.
b) These are UK total values, and the urban areas, even in the UK, make up only a small fraction of the area.
c) We are only looking at just over 20 years of data, and I doubt the urbanization of the UK has changed that much in that time.
d) I may be wrong, but I think the MO regional averages already take into account the effects of urban areas on temperature.
If you look at the MO maps for maximum temperatures in July 2021 there is no noticeable urban effect, whereas if you look at minimum temperatures, London can clearly be seen as warmer.
However if you look at the anomaly maps there is no indication even for the minimum that urban areas were warmer than during the 1981-2010 period.
What is causing the rapid warming in max temperatures I don’t know. It’s a lot faster than global warming, and you would expect the greenhouse effect to be stronger at night than during the day. It might be due to the increase in sunshine, or it might just be chance, given we are only looking at 25 very variable data points.
The US has yet to exceed precipitation in 1974. Recent wet years were due to Los Niños.
No he’s not. Now we see rain on the peaks of Greenland which is UNPRECEDENTED (on record, in modern times, since they have been watching).
https://www.irishtimes.com/news/environment/rain-falls-on-peak-of-greenland-ice-cap-for-first-time-on-record-1.4653124
The record barely goes back 40 years. Doesn’t take much to impress you. Not even a full AMO cycle.
And they installed a weather station there for the first time in 1984.
That was UNPRECEDENTED too.
T0sser.
Don’t call me a tosser you twat. There now we all feel better.
Rain?
You mean the white stuff that increased the Surface Mass Balance this year?
No…. rain.
Absolutely anything is due to CAGW for you, isn’t it Griff?
Hot, cold, dry, wet, calm, windy.
Has it ever occured to you that it’s all just regular weather?
You shouldn’t mock a man’s religion…
Why not?
True, providing of course that his religion isn’t any denomination of Christianity, in which case ridicule is sanctioned, if not required.
Yeah, but don’t forget it is deserved for creating the Enlightenment, the Industrial revolution and other crimes against humanity.
Such petty crimes against humanity as you mentioned could be forgiven perhaps, but the original sin, the creation of Science, can never be forgiven . . and salvation can only come from utterly destroying it.
So true
That’s the beauty of the beast. No matter what happens, they can’t be wrong!
Climate change decimated the Anasazi, and it wasn’t due to increased rainfall.
We see the other main effect of climate change: increased rainfall
And as ever you pop up with a nonsensical statement with no source, link or reference to back it up.
Let’s just say it doesn’t help with your utter lack of credibility.
Griff
So no draughts then, that’s good.
No draughts? Is the beer all gone?
The beer ran out in 1976 That was a dry year.
No. chess only.
The 2011 documentary “How Beer Saved the World” makes the case that fermented malt beverages are the greatest invention of all time.
A case for beer and a case of beer, sounds good.
The two are fungible commodities.
Well, it saved Europe…
The rest of the world got by without daily tankards of beer as food.
“Nothing so lonesome, morbid, or drear, than to stand in the bar of a pub with no beer.”
No year in this century has yet exceeded UK rainfall in AD 2000.
The actual records show no such increase, at least not when the whole record is examined.
Nor does it show any increase in extreme weather.
But when the real world contradicts the models, always go with the models.
Well great, we will need that to water the plants that are now growing faster due to 405 ppm C02.
Good to know that more CO2 doesn’t cause droughts.
At the same time, you frequently claim that global warming causes drought. So who in their right mind would take your fantasies seriously?
In which time period would you prefer to live your life?
[__] Benign low CO2 1675-1750
[__] “Dangerous” CO2 1950-2025
Maybe you could give some examples of the kinds of weather events nature inflicted during the “ideal” climates we had when CO2 was “safe”, vs what the “climate emergency” events are these days.
A suggestion to start the list –
the protracted heat wave in Australia in 1896 that saw over 400 deaths.
I suppose I could add the Dust Bowl of the 1930s in the western US, crop failures in France that played a role in the French Revolution, Frost Fairs on the Thames, the Irish Potato Famine. See how much better things were before the current dangerous CO2 levels?
This comparison would make for quite an informative article to contribute to the climate science literature.
What chance it would get published?
Yeah, yeah, yeah, … How far back do we have to look for you saying the other main effect is increased drought?
In North America, colder is wetter, warmer is dryer.
Where is the warming?
We ??? 😀
You only imagine to see what ever.
“We see the other main effect of climate change: increased rainfall…”
How is increased rainfall an effect of climate change? Where? How much over what period?
I’m still waiting for an answer to the questions; which climates are changing and if so, in what way are they changing. There are climates on this planet that have had no change for millennia.
griff has once again, accidentally discredited the whole global warming myth.
According to him, global warming increases the hydrological cycle.
According to griff:
1) Warmer oceans mean more evaporation and more water vapor in the air.
2) More water vapor in the air means more rain
More evaporation and more rain, means more energy being pulled from the water and released into the atmosphere high above almost all of the CO2 and water vapor. This means it’s easy for this energy to escape into space.
IE, it’s the strongest possible negative feedback. Making the claims of 3 to 5C worth of warming from CO2 utterly impossible.
He’s proven that the skeptics who have been claiming that climate sensitivity to CO2 is less than 0.5C were right all along.
We should all be praising griff for being willing to stand up for skeptics everywhere.
That would be good insight if it wasn’t for the fact that Griff has no clue what he’s talking about. He just makes random comments he believes conform to the AGW religion.
What ever period is choosen, always someone isn’t satisfied – mostly alarmists…. 😀
The issue of course is the possibility of cherry picking. Many of these stations have longer records, but the author chose, deliberately, not to use the full records in her analysis. I took just one of the stations showing a cooling trend over the period 1997-2021 from the JMO website and plotted the entire available record:
So of course this is painting a different picture.
But even then it is not enough, since neither of these periods show trends that pass statistical significance tests:
So the questions I ask are completely germane and important.
You don’t cherry pick 😀
A climate period is 30 years.
The author is using 23 years, so clearly that is not the explanation, here.
You are the one who is cherrypicking by moving the goalpost, here is the title of the article again:
Strong Demand For Jackets…Northern Europe Sees Very Little Midsummer Warming Over Past 2 Decades
Since you didn’t address the article claims as it is, you have nothing to complain about.
In fact very hot record breaking summer days seem to be all last century:
June
38.0 ° Målilla June 29, 1947 (Götaland)
35.3 ° Bromma June 30, 1947 (Svealand)
36.4 ° Gävle June 30, 1947 (Norrland)
July
36.0 ° Borås July 20, 1901 (Götaland)
38.0 ° Ultuna July 9, 1933 (Svealand)
36.9 ° Harads July 17, 1945 (Norrland)
August
36.8 ° Holma August 9, 1975 (Götaland)
36.0 ° Örebro August 7, 1975 and Sala August 6, 1975 (Svealand)
34.6 ° Fränsta-Emnäs August 16, 1947 (Norrland)
A decade is ten years, is it not? So why the choice to use 23 years? Why not 24, 22, 21, 20, or any other arbitrary length of time? Why would two decades be a climatologically relevant period for this region?
I accept your failure to address the article itself, it is apparently too much for you to handle.
Cheers
The questions I’ve posed should not be difficult ones to answer if there are legitimate reasons behind the decisions made in this analysis. The fact that everyone in this thread is waffling around and deflecting instead of actually addressing them speaks volumes. I accept that my suspicions about the analysis are correct and it is a flagrant exercise in cherry picking, meant to mislead.
Er, wtf? The title to the whole article refers to no warming in the last 2 decades. If you want to include a longer period then the whole point of the article is null and void. Imagine there was an article in a magazine saying that dogs make the best pets, would you email the writer to demand that he included cats in his article? Your post is completely pointless and I can only imagine your lack of education and possibly intelligence may be entirely to blame.
But the author is using 23 years, not two decades. They’ve deliberately truncated these series, which often extend much further back, to an arbitrary extension of an arbitrary 20-year period, with not an ounce of justification offered. Why not 22 years? Why not 24? Why not 30? Why not provide us with the results of statistical significance testing of the calculated trends?
The author is drawing our attention to a specific period and showing that there has been very little warming. Are you seriously suggesting that the reverse should happen? That whenever someone mentions that there was some warming in the 1981-2010 period we should immediately jump on them and say that they MUST take into account the long term cooling trend from the Holocene climactic optimum to the present day? This is not cherry picking, it is a legitimate article looking at a significant period of activity. If it was a small 2 year window in an otherwise different trend, I might agree with your claim of cherry picking, just as I would call out those looking at weather for a single year, or even a couple of months, and extrapolating that as typical for the next 100 years. Get a grip.
I think the author needs to justify her choices for us. She’s showing individual station records rather than a regional average, which can potentially mask any long term behavior given the noisiness of individual station records, she is omitting parts of the station records and choosing a specific yet arbitrary interval without justifying why this is an appropriate interval to look for “very little warming” in (northern Europe shows very little warming between the hours of 4:00pm and midnight, yet most of us will agree this is not a climatologically meaningful time period), and she offers no description of any non-climatological effects that might be present in these station records.
So what I’m asking is that all of these items be addressed. This is not at all unreasonable, and is something that should have been included in the original writeup.
You’ve completely missed the point of the article, as everyone has pointed out to you.
Are are you able to address the questions I’ve asked? Perhaps you can explain why you feel they’re not relevant?
Just because someone chooses a specific period to discuss doesn’t make it cherry picking. The past two decades seems to be a reasonable period to look at, especially considering “that’s the period in which “climate change” equivocation is most pronounced. The location was clearly chosen for its proximity to Miss. Climate Hysterics home … Scandinavia, as well as the other reasons given by the author.
You people have been trying to sell a false narrative for close to forty years. You have no evidence, little valid science and you’ve made a large number of unfruitful “predictions” (actually shotgun like projections). Clearly you missed the point of the article and have equally failed to fathom the arguments against your attempts at non sequitur. You don’t even seen to know when you’re defeated intellectually and scientifically.
Choosing a time period at all is not necessarily cherry picking, but cherry picking is the act of deliberately choosing a time period to yield specific results. You or the author could provide justification for their choices that might put to bed any accusation of cherry picking, but no one here seems willing or able to do that.
You seem to be reading impaired. Perhaps that’s why you’re still unable to get beyond believing in AGW. Your complaints have been answered several times in many ways.
ROTFLMAO!
No, you don’t actually. You are simply throwing any specious thought at the wall and hoping something sticks.
You want to see a full record of a very pristine Finnish station? Your 1980 is nothing, here’s 1900 to 2017 in Sodankylä. Check out 1930s to 1950s, can you spell AMO?
It’s not clear to me how you think this helps your case. The series shows an undeniable warming trend.
Stokes, is that you?
Absolutely blind to cycles are you?
It also shows the 1930’s were just as warm or warmer than today.
There is no unprecedented warming in Sodankylä. That’s the important part.
Flgyplats is an airport, will you prove warming with airport data, really ? 😀
I’m not trying to prove warming, I’m trying to get some justification for the choices made in this analysis, which do not seem to be justifiable. Tamino has an analysis of central European summer trends that seems much more robust to me.
Weekly Rise – This is the whole Pierre Gosselin/Notrickszone method, now being continued by Kirye, who I believe is Mrs Tony Heller.
Locate a subset of stations or studies that show little or no warming, publish a post that says ‘No global warming in <insert region>’. Repeat. The aim being to show that if there is no warming in all these places then there cannot be any warming globally, right? What Pierre will never do is take a representative sample of global stations over a statistically significant time period and calculate an average. Because we know what that would show.
1998 was the year of the strongest El Nino of the last century, so of course having that at the start of your trend may well have an impact. A twenty-something year trend is unlikely to achieve statistical significance but it does enable an arresting headline. Why JMA? Other agencies have more stations in the region. And why July? I went and got the January data for the first Swedish station and I plotted it up. If you use all the available data – from 1983 – there’s a warming trend of around 1C/decade. But deleting everything before 1997 reverses the sign of that trend. Usually more data is better, but not here.
I wonder how many regions and time period combination Kirye looked at before she found the one she liked?
PS
PPS Oestersond Annual Mean from NASA
PPPS And Stockholm
“1998 was the year of the strongest El Nino of the last century, so of course having that at the start of your trend may well have an impact.”
Agree with most of this comment, but I don’t think the El Niño had much of an effect on Scandinavia. As far as I can tell from the spaghetti graphs, 1998 was quite a cold July in Sweden.
You posted the data of the Karstad airport as graph, so, without reason ?
Also, why does the period change to 2001 for Norway?
Why indeed. If we plot the July station data for Vardo (which goes back to 1982) from 1997, the trend is positive:
Though not statistically significant. If we extend the record back to 1982, the trend is still positive and statistically significant:
So, again, we can only wonder why the author of this piece has been so deliberate in her choices without offering any justification. It seems clear that she suddenly switched to 2001 because using 1997 wouldn’t give the trends she wanted to show. Is there a term for that? Maybe something related to harvesting fruit?
Why all the negatives on this site?
[Please fix your incorrect email you keep posting with comments-mod]
The arctic sea ice extent is slowly getting back to normal levels, and summer temperatures
also below normal. The Antarctic sea ice is also well above normal, and these were the areas
the IPCC said would be effected the most. It seems air temperatures stopped rising 20 years
ago and the arctic is now catching up.
“It seems air temperatures stopped rising 20 years
ago and the arctic is now catching up.”
Nope:
Air temperatures are rising in winter only as the Arctic is ice covered (mostly still) and the LH take-up in summer keeps temperatures near ZeroC
 ?itok=V9wA5N5U
http://ocean.dmi.dk/arctic/plots/meanTarchive/meanT_2021.png
https://sites.uci.edu/zlabe/arctic-temperatures/

“the IPCC said would be effected the most”.
It is.
It’s warming twice as fast ( but only in winter ) …. because melting ice.
What melting ice ?
Again, wtf? Melting ice causes the temperature to increase? In what universe, pray tell?
Here is the UAH sat tropospheric temp trend confirming the Arctic anomaly trends ….
 ?w=800&ssl=1
The arctic sea ice extent is slowly getting back to normal levels.
I admire your optimism.
I wonder if North Face is producing their fossil fuel-free jackets yet.
It’s always their abject hypocrisy that makes warm-mogers look like charlatans, isn’t it?
And there are so, so many examples.
I live at 45.4N 86.9W, moderated by Lake Michigan. The duvet is still on the bed. First time this year. We are getting older.
Our wooden cottage has not dried out for years, enough to be painted. Moss and mildew are growing everywhere.
Two years now with no zero NONE mice in the house, not even in the dead of winter.
Things are a changing. Now off to ride HPV tricycle for 25 miles two hours.
All the plotted data below are from
Not seeing any graphs !
Not seeing any graphs !
I don’t see any graphs, either, and I checked it with an iPad to see if maybe my computer was blocking some script or other.
How’s the transitioning going in Blighty?
Eco-friendly heat pumps do not work as well as gas boilers (msn.com)
Down under we’re into managing solar which basically means your neighbours don’t want your midday glut anymore than you want theirs but everyone wants their FIT to keep their bills down. Naturally them technickle infrastructure dudes are supposed to manage all that at no extra cost cos it’s Green power-
Call for crackdown before new solar rules (msn.com)
How’s the transitioning going in Blighty?
Currently, their preferred alternatives like heat pumps are unaffordable – the vast majority of the housing stock is pretty old and will need retrofitting. Got up to £100K or more to spare?? Me neither.
Wait for the prediction of snap warming.
Autumn weather in Northern and Central Europe.
https://earth.nullschool.net/#2021/08/26/0800Z/wind/isobaric/700hPa/overlay=temp/orthographic=-340.15,59.15,1183
Fresh and rainy 😀
Maximum temperature around 17 degrees C, minimum temperature below 10 C.
There will be snow in the high mountains.
Snow started much earlier this year, better, did never end 😀 😀
Living around Denver in summer, we normally start the day between 12 – 18 C or 55 – 65 F. Highs range 35 – 40 F above that for the day, or 30 – 37 C.
Not sure what abnormal temps would really look like with such a large range.
If the climate pattern persists, the next anthropogenic conflict will be in Europe, perhaps central Asia, which will force immigration reform back to Africa and warmer properties, or Europe and colder properties, respectively.
The northern (arctic) warming is not during summer, but during winter. Which is quite funny, since in theory inversion, as is typical high latitude cold regions, should invert the warming effect of CO2 – and make it cooling. Of course the inversion occurs in winter, not during summer.
So theoretically summers should turn warmer and winters colder. In reality the opposite happens. Why would that be???
Why would that be???
Because we have had nearly 50 years of politically driven scientific gobbledygook forced on us by unethical “scientists”, way out of their depths, and immoral politicians padding their personal bank accounts with “climate pork”. There are bound to be truck loads of inconsistencies when the “science” is largely made up out of whole cloth for a credulous public.
How did we let ourselves get this way? In the mid 1960s. I was mapping geology in northwestern Nigeria for the Geo Survey. On a week’s (in-country) holiday, I took my wife and two children up to Yelwa on Niger River hoping to take the steamboat trip to Timbuktu (IIRC it was 3days upriver, 2days back).
I don’t know what the temperature was that day, but our two tropical clinical (mercury) thermometers broke in our luggage – I believe they were good for 113°F (45°C).The boat was being repaired, so I missed the chance for the fabled trip (forever).
Even growing up on the Canadian prairies we could expect 105°F a couple of times a year and -40 in winter.
The 70s were awful on the prairies
I had a paper route for 5 years, cold as heck and mountains of snow to struggle over.
Or as Griff says, paradise
I go to the Iceland volcano site every day to see how big Geldigadalir has grown. Appears to have a smaller cone now growing behind it, too.
Everyone who goes there to visit the volcano is wearing cold weather clothing. It’s either raining or very foggy (or both), and occasionally, I see on the cameras what appears to be snow but it melts quickly so it’s difficult to tell if that is snow.
The eruptions are very, very gassy, producing a high volume of gases as well as lava flows, and where there is grass in the valleys, it is stunted by cold weather. Idelanders are used to cold weather. We’re starting to get chilly nights again down here in the sticks, but the humidity level is fierce.
I do not expect a “mature” viewpoint from weather guessers any more, for the most part, and the most accurate local weatherman is nearing retirement. I do expect bad weather this fall and winter, and as I said elsewhere, even the local geese are taking notice of something. Cicadas only lasted a couple of days. No mosquitoes to speak of.
I don’t know what to expect for winter this time, so I will do what I always do: stock up and prep for the worst. Just glad I have a new (and efficient) furnace.
“I go to the Iceland volcano site every day to see how big Geldigadalir has grown. Appears to have a smaller cone now growing behind it, too.
Everyone who goes there to visit the volcano is wearing cold weather clothing.”
I saw a neat overhead view of the volcano a day or two ago, and the reporter was remarking on how close all the tourists could get to the volcano, and the picture showed the tourists, dozens of them, right up next to the lava flows. I think the picture was in this month’s Atlantic magazine. If you have an Apple+ subscription, you can look at it.
I moved to the PNW from San Diego County 6 years ago and they freak out about temperatures in the 90’s up here. Makes me laugh.
We are used to people moving up to the PNW and having one of two reaction. Reaction #1: Love it, never going to leave. Reaction #2: Freak out about all the rain and days of gloom we see. Reaction #1 people stay, Reaction #2 people don’t last long before moving out again.
Fastest I’ve seen is a guy we hired out of Texas, his wife and him moved up during winter. His wife gave him an ultimatum after just 2 weeks. Move back to Texas with me or get served divorce papers because I’m leaving no matter what you say. He was with us two weeks then gave his two week notice. My company didn’t make him work for those two weeks, just gave him a paycheck and told him to enjoy his life.
Most of the land area covered by the Scandanavian countries mentioned lies above latitude 60 degrees north. The UAH satellite lower troposphere temperature data set covers land areas above that latitude (NoPol 60N-90N_Land). According to UAH, the trend in average July temperatures in this region over the past 20 years is 0.12C per decade warming. If the Scandanavian land areas above 60 deg N haven’t been warming in July over the past 20 years, then that’s been more than offset by other land areas across the region – according to UAH.
https://www.nsstc.uah.edu/data/msu/v6.0/tlt/uahncdc_lt_6.0.txt
cherry picking: (a) select a small subset of countries in a small area of the world with a small population, then (b) pick a short time span, and (c) ignore other elements of climate change – positive and negative (rainfall, air pollution, flooding, etc.) And by ALL MEANS, do NOT mention Siberia, Greenland, Italy, the middle East, …
Is it possible that these countries have done something that is slowing warming? sorry, impertinent question. My bad.
sheesh. Its come to this. The carbon corporations should ask for their money back; denial hasn’t worked for 20 years.
This from the guys who proclaim every heat wave as proof positive of global warming.
”ignore other elements of climate change…..
And by ALL MEANS, do NOT mention Siberia, Greenland, Italy, the middle East, …”
Allow me to mention Italy…
It was warmer there a hundred years ago. Is this climate change too? Or will you just ”ignore it”
https://www.smithsonianmag.com/smart-news/melting-glacier-italian-alps-reveals-world-war-i-artifacts-180977703/
Some people probably don’t know that warming in winter in the Arctic means more snow in high latitudes and polar vortex intrusions in middle latitudes. What is this intrusion? It’s a drop in tropopause height to just 6 km. Higher up is the stratosphere.
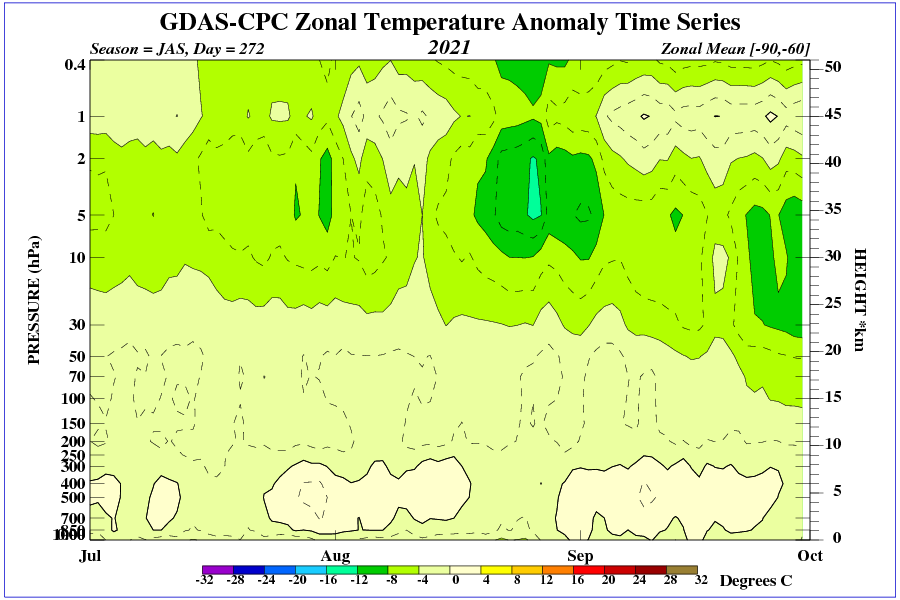
https://www.cpc.ncep.noaa.gov/products/stratosphere/strat_int/
Let’s say the temperature in the Arctic will rise to 260 degrees K in the winter, which is about -13 degrees C.
Such an increase is only possible with the intrusion of a low from the south. What will it rain in Greenland? Probably rain?
Even fewer people realize that winter weather is governed by the stratospheric polar vortex and the temperature in the stratosphere at high latitudes.
“Even fewer people realize that winter weather is governed by the stratospheric polar vortex and the temperature in the stratosphere at high latitudes.”
Nope:
Not “governed”.
Rather it affects the troposphere when it spits/disrupts (sudden stratospheric warming).
“Major SSWs occur in the Northern Hemisphere winter about six times per decade…..”
https://eos.org/features/how-sudden-stratospheric-warming-affects-the-whole-atmosphere
I’m of a different opinion because the stratospheric polar vortex in full winter drops at the pole almost to the Earth’s surface, as you can see in the graphic above. SSW is a disturbance of the polar vortex.
If you look at the winter temperature in Antarctica, which drops below -70 degrees C, you will recognize that this is a temperature that occurs in the tropopause.
See what the temperature is now in Antarctica.
The conclusion is that cave lions in Siberia may have gone extinct in a single winter.
This article seem to be missing graphics.
But not missing illustrating street view of a Stockholm, Sweden… It’s from the Old City, “Gamla stan” , Själagårdsgatan seen from Köpmangatan. I delivered the morning papers there 1988 until august 1990…”Soul Garden Street” In those years, there was perhaps an article about climate once a month… The evening tabloids being obsessed by our sex lifes…
Were there supposed to be some graphs in the article?
Well I guess that helps explain why Greta is so angry all the time 🙂
Typical summer here in the UK midlands. Beautiful warm but not hot days on occasion followed by lots of cloudy cool days and sometimes a bit of too persistent rain.
That is what weather is here in the UK.
As a beekeeper and an owner of broadleaf woodlands, and having now lived long enough to experience two whole periods of climate, I see no change in my lifetime and have experienced no change, in the way the weather patters present themselves here in the UK.
Global Warming should be global??