Reposted from NOT A LOT OF PEOPLE KNOW THAT
By Paul Homewood
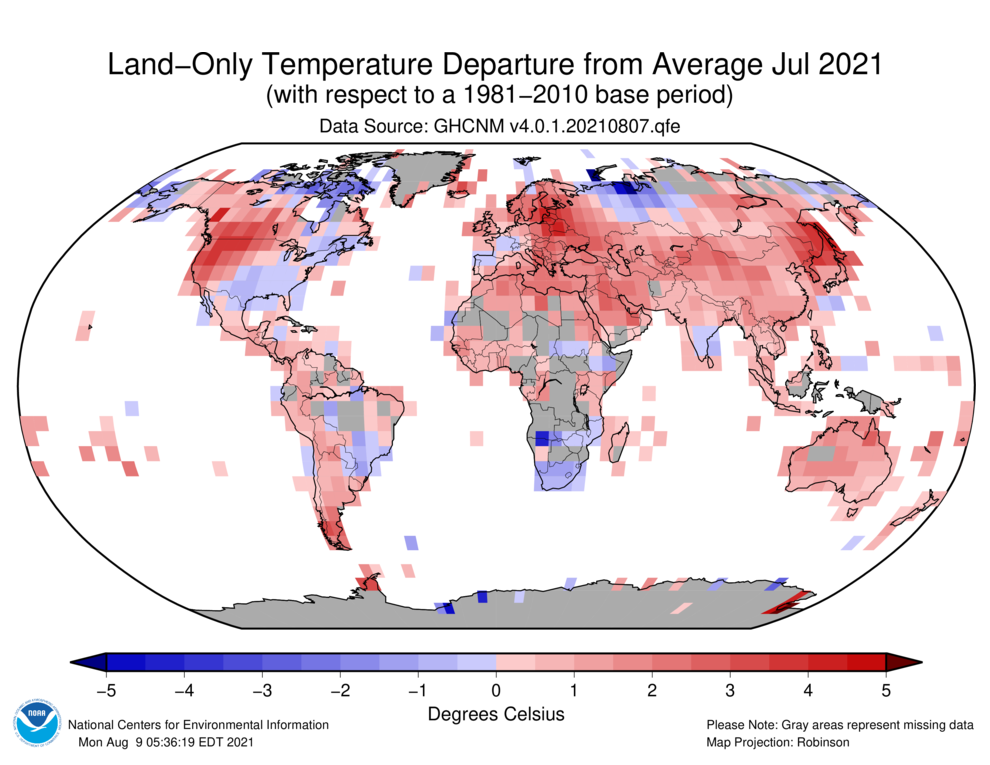
More, disgraceful reporting by the BBC (complete with a disgusting use of a photo of the Turkish wildfires):

July was the world’s hottest month ever recorded, a US federal scientific and regulatory agency has reported.
The data shows that the combined land and ocean-surface temperature was 0.93C (1.68F) above the 20th Century average of 15.8C (60.4F).
It is the highest temperature since record-keeping began 142 years ago. The previous record, set in July 2016, was equalled in 2019 and 2020.
Experts believe this is due to the long-term impact of climate change.
In a statement, the National Oceanic and Atmospheric Administration (NOAA) said that July’s “unenviable distinction” was a cause for concern.
“In this case, first place is the worst place to be,” NOAA administrator Rick Spinrad said in a statement.
“This new record adds to the disturbing and disruptive path that climate change has set for the globe.”
The combined land and ocean-surface temperature was 0.01C higher than the 2016 record.
In the Northern Hemisphere, land-surface temperature reached an “unprecedented” 1.54C higher than average, surpassing a previous record set in 2012.

https://www.bbc.co.uk/news/world-us-canada-58208792
Meanwhile, back in the real world, July temperature anomalies even according to NOAA themselves are well below the peaks of 2015 and 2016, and barely higher than they were two decades ago:

https://www.ncdc.noaa.gov/cag/global/time-series/globe/land_ocean/all/7/1980-2021
And the claim that they know the world’s temperature to one hundredth of a degree is ridiculous. Far from the full global coverage implied by the BBC’s map above, below is the actual coverage:

Large parts of the world have no coverage at all, and much of the rest is affected by UHI. In contrast, satellites offer virtually 100% coverage, other around the poles, and are not corrupted by UHI. Data from these satellites indicate that atmospheric temperatures are no higher now than in 2002:

https://www.nsstc.uah.edu/climate/
Nice perversion of Australia data on that map, July for Western Australia and South Australia was 2 degree colder than average which magically became 1 to 2 degree warmer. The Northern Territory and East Coast did have warmer than average temperatures but given the distortion I am surprised they didn’t go for a bright pink … if you are going to doctor data you might as well go big.
Apparently a thermometer reading today of 124F is greater than 131F because they didn’t know how to read thermometers before new math.
I don’t know how right I am but I have thought more than once that using anomalies rather than actual temperatures and “updating” the base period as and when necessary (however you define ‘necessary’) could in theory lead to record highs that were in reality cooler than previous record highs.
The same could apply to record colds as well, I suppose.
The data shows that the combined land and ocean-surface temperature
Huh? I thought NOAA routinely ignored ocean surface temps, as that usually makes the temps look more scary without it?
just as a fella said long ago, there are 3 kinds of liars, liars, damned liars and statistics.
Stop feeding the trolls.
Are you lost?
It’s hard to read temperatures when you have your head where the thermometer is supposed to go.
“July for Western Australia and South Australia was 2 degree colder than average ”
No it wasn’t ….
http://www.bom.gov.au/web03/ncc/www/awap/temperature/meandecile/month/colour/history/nat/2021070120210731.gif
http://www.bom.gov.au/climate/current/month/aus/summary.shtml
South Australia +1.97C
Western Australia +1.67C
Temperatures : The national mean temperature for July was 1.77 °C warmer than the 1961–1990 average for Australia as a whole…
…1961-1990 …
You left off some important (inconvenient ? ) info …
“You left off some important (inconvenient ? ) info …”
No.
I merely responded to ….
““July for Western Australia and South Australia was 2 degree colder than average ””
It wasn’t (whatever the baseline)
Okay I had to look this up
https://www.abc.net.au/news/2021-07-31/is-it-really-that-cold-or-are-we-just-getting-soft-/100334946
I can even buy the state average was higher because of heat in the North as per the ABC article. However that does not explain how the whole of the State suddenly gets an hotter anomoly graph you show or the grids show above and there is definitely something weird going on with BOM baselines. I won’t get time to look at this week but that will prompt me to see what is going on.
I will add a couple degrees warmer next year would be nice as it was uncomfortable this year.
Before anyone takes seriously what you say and more importantly BOM
Heres how BOM themselves admit to adjusting temperature/ weather data
http://www.bom.gov.au/climate/change/hqsites/about-hq-site-data.shtml
And here’s a outside source that investigated BOM
https://joannenova.com.au/2017/08/another-bom-scandal-australian-climate-data-is-being-destroyed-as-routine-practice/
ANYONE reading Anthony Barton posts should read the above in my post to make a considered opinion. In a knutshell the data is highly questionable.
Of course they adjust – when necessary.
People here would be the first to complain for they didn’t when a suspicious temp were reported today.
If there are known reasons for a discontinuity (as compared to surrounding stns) in past data.
And then read this as regards BOM homogenisation.
https://moyhu.blogspot.com/2009/12/darwin-and-ghcn-adjustments-willis.html
“GHCN homogenization adjustments are often misunderstood. They are trying to detect and adjust for discrete changes. A station gets moved – a screen replaced – a nearby tree removed. Plus the more widespread changes, such as the 1990’s move toward thermistor MMTS. They don’t correct for UHI.
They do have a reason. The reassuring consequence of GG’s analysis is that, while they can be large (as with Darwin), they do not, as often alleged, dominate the warming signal in their nett effect. There is no reason to believe that their scatter is designed by someone to advance an AGW agenda.”
In the interests of science and understanding, you did not state in your post BOM adjust their data , ” when necessary ” thats so ambiguous its laughable, the second link i gave and its comments which you don’t refute shows the manipulation for what it is.
Any data BOM produce particularly in comparison temperature data when so much past data is not retrievable can not be taken seriously
The BOM is corrupted.
“you did not state in your post BOM adjust their data , ” when necessary ” thats so ambiguous its laughable, ”
And what post would that be?
Other than the one I responded to accusing BOM of fraud.
Laughable?
– what’s laughable is the belief that the odd station that has it’s record changed due to known causes interrupting the data homogeneity, should morph into fraud perpetrated on an ongoing a monthly basis, by several degrees it seems.
Is it like a belief in Qanon and the pizza paedophiles?
Because without a world-shattering disclosure it might as well be as far down the “rabbit-hole” as is that.
Mind you, if you need your bias confirmed so desperately badly enough – seems there is indeed a baby eating cabal.
geek response
Yes you have
Qanon?
Is this like ALAnon?
Do you believe there have never been corrupt regimes in power on this planet? None that conspired to deceive, and propagate false narratives to justify agendas the public would otherwise not likely support?
This is very difficult for me to believe, and you acting like it’s absurd to suspect such a mundane thing as governmental corruption might be going on, leaves me with little choice but to suspect you are part of just such a propaganda campaign . . (I mean, you don’t seem like a complete ignoramus ; )
As every good socialist knows, if the regime is bad, then it is by definition a right wing one.
Socialists only care about the people and are never bad.
I respectfully suggest that those who are involved in the sort of governmental corruption I was alluding to, and/or use the kind of -It’s absurd to even suspect such things could be going on- techniques we see being deployed here by Mr. (if I may be so bold ; ) Banton, would much rather have the discussion drift into the realms of political ideologies . . precisely because so much “ground work” has been done to convince young folks that what is needed to curtail corruption is more “good socialists” in power.
Therefore, I suggest we keep it simple, and point out that governmental corruption, and propaganda campaigns designed to influence the public into supporting agendas that serve the interests of those in power (and not the public in general) are nothing new, or absurd to suspect might be going on at any time. So even the well indoctrinated young can see through the charade by otherwise intelligent people pretending it’s absurd to think it might be happening now.
Have you heard of Wikileaks? Half of the government is in fact, pedos.
But you don’t care about facts.
Answer this dude! Why are there multiple changes to the same station. Historical data doesn’t change so ONE adjustment would take care of “correcting” any suspect data for all time. Any further adjustments are only necessary in order to obtain a specific outcome, not to correct the measurement.
That’s who NO adjustment is justified. Once the fraud begins (like any lie) it must be continued or get caught.
Any data BOM produce particularly in comparison temperature data when so much past data is not retrievable can not be taken seriously
What data is not retrievable? What do you want that you cannot get?
Perhaps a simple Internet search is clearly beyond your ability you certainly haven’t read the links I already supplied heres a bit more for you.
https://jennifermarohasy.com/2015/09/you-dont-know-the-half-of-it-temperature-adjustments-and-the-australian-bureau-of-meteorology/
https://joannenova.com.au/2014/08/hiding-something-bom-throws-out-bourkes-hot-historic-data-changes-long-cooling-trend-to-warming/
Neither of those blog posts answers my question. You’ve alleged large quantites of past data is irretrievable.Surely you can provide a single valid example?
First paragraph in one of the links your either a dick head or completely stupid
Hello Soviet style weather service? On January 3, 1909, an extremely hot 51.7C (125F) was recorded at Bourke. It’s possibly the hottest ever temperature recorded in a Stevenson Screen in Australia, but the BOM has removed it as a clerical error.
The data for Bourke, Jan 3rd/4th 1903 is not ‘irretrievable’. I retrieved it. Here it is.
It shows that the observed figure of 51.2C has been adjusted to 49.7. They did this because it was an extreme outlier, an implausible 6C warmer than surrounding stations.
So when you say ‘so much past data is irretrievable’ you actually meant one century old daily reading was adjusted by 1.5C?
irretrievable”.Surely you can provide a single valid example? “So I did when you claimed there was not one .so your lying or not reading what I produce till I call you out, you need to up your game philips .
Were is it retrievable?
And see my post below
You do realize that there must a valid, factual, demonstrable reason for declaring a measurement to be an outlier and not valid.
If it is an outlier, you then don’t modify it, you simply throw it out. My God son, you have no idea about what the actual measurement should be. Any calculation, windage determination, guess is not a real measurement and should have no weight at all.
The unhomogenized/raw mean annual minimum temperature trend for Rutherglen for the 100-year period from January 1913 through to December 2013 shows a slight cooling trend of 0.35 degree C per 100 years, see Figure 1. After homogenization there is a warming trend of 1.73 degree C per 100 years. This warming trend is essentially achieved by progressively dropping down the temperatures from 1973 back through to 1913. For the year of 1913 the difference between the raw temperature and the ACORN-SAT temperature is a massive 1.8 degree C.
Again taken from the article you clearly failed to read or ignore the data
When something happens to a station that introduces a non-climatic bias, such as a change of instrumentation or a move, the data must be corrected to compensate. That’s just a fact of life. Jennifer Marohasy claims the Rutherglen station was never moved, the BOM have photos, maps and other documents that prove she is wrong.
The analysis of data for Rutherglen has been carried out in the same, consistent and objective manner as the analysis for all other ACORN-SAT sites, using our standard and published methods.
The need for the adjustment made to Rutherglen data for the period prior to 1966 was determined from an objective statistical test that showed an artificial jump in the data during this period.
While it is not necessary to have supporting documentation to justify correcting a statistically determined artificial jump in the data, it is of interest that the change at Rutherglen is very likely associated with a change in the location of the weather station.
The Bureau’s site catalogue for ACORN-SAT sites does not list a site move for Rutherglen, since there is no firm documentation for this change. The site catalogue provides a brief overview of weather stations, including the main points that can be found in historical documentation.
There is, however, evidence beyond the statistical test indicating that the site at Rutherglen has moved at least once. The Bureau has located 12 documents, covering a period from 1939 and 1978 that provide various pieces of information suggesting a site move.
So the data for Bourke and Rutherglen is clearly not ‘irretrievable’. Still waiting for that single valid example …’
You really are dense arent you , the graph and corresponding data I provided shows the manipulation of hundreds of temperature readings, I shall be watching you philips global warmests like you defending temperature manipulation are scum .
You’re arguing that BOM should only ever use raw data? They should ignore the effects that station moves, instrument changes, change in observation time etc. have on the trend?
I feel you are in a small minority.
I do argue and I also answer questions put to me unlike you,
You don’t even read the links provided till you are called out.
Your a bit of a joke aren’t you.
Hahahahahahaha!
Delusional to the last, eh?
You feel? Right…? All fantasies and beliefs, not actual data.
ACORN2 is a national joke there is no justification for what they have done.
Why?
Because it is NEVER justified to alter data, regardless what your handlers tell you. Data is sacrosanct. Too badly corrupted data can be discarded and duly noted. If the problem is demonstrably slanted due to some discovered error, that’s what error bars are for. All adjustments must be explained and will NEVER result in a trend, unlike those made by the BoM. Theirs all seem to cool the past and warm the present.
Know your adjustments.
So if I discover that the elevation of a station changed by -100 meters in an already dry environment I should not worry about the +1.0 C bias (using the dry adiabatic lapse rate) that it would cause?
If you “discovered” a geological event of that magnitude, I should think it wouldn’t be the climate we need to worry about. Learn some perspective.
Otherwise … reread the post you responded to. You’ll find your answer there.
I’m not talking about geological events. I’m talking station moves in which elevation changes are significant. Are you really arguing that we should just pretend like that never happened?
I’ve often wondered what it would be like having to go through life as dull witted as you. A station can’t just be “discovered” to have fallen into a 300 foot hole … or climb 300 feet up a nearby hill (a case you people would ignore).
Yeah, you were talking nonsense. No, I’m arguing that you need to read what I wrote or find a literate grownup to help you follow the dots.
Fall into a hole? Climb a hill? I honestly have no idea what you are talking about. I’m trying to have a serious conversation regarding the relocation of stations in which elevation changes are significant (USC00411250 would be an example of a 100m change in elevation). If you’re wanting to make a joke of it all and resort to ad-hominem attacks I think I’ll respectfully bow out.
Nonsense!. I provided you with all the information you needed in my original response. Then you offered a bizarre hypothetical where the station was moved into a 100 meter deep hole. You are a joke, so why can’t we appreciate the joke as we choose?
There is NEVER reason to “adjust” data in the way being done. It’s simple, or garden variety fraud intended to obscure actual temperatures. You had no reason to respond in the 1st place with your silly example.
Elimination of stations at ‘altitude’ or worse out in the cooler rural areas is a typical Hansen obsession.
Hansen purged thousands of stations looking for warmer temperatures through adjusting the remaining stations endlessly.
Years ago over at Jo Nova she did a great article on The Great Dying of Thermometers, showing how huge numbers of stations simply disappeared over time, simply to ‘customize’ the temperature records to suit the scam artists.
https://joannenova.com.au/2010/05/the-great-dying-of-thermometers/
Smart people at the BOM who can calculate the effect of a tree being there or not then ‘adjusting’ the actual recorded temperature to meet their idea of what it should be with/without the tree.
What ‘adjustments’ do they make for the summer/winter difference in grass height?
Let me see if I have the details of this ‘scandal’ correct. In 2013 at Canberra airport they switched from a liquid in glass thermometer to an Automatic Weather Station (AWS) using a Platinum Resistance Thermometer. For a period they ran the two systems side-by-side and the AWS data was reported to BOM. A report was prepared and presumably the AWS trial was successful as it has continued being used as the instrument of record.
Some years later Bill Johnson apparently requested the data from the glass thermometer and it turned out this data for three of the months of the trial had been destroyed in line with retention policy. It is not clear if these records were the responsibility of BOM or the airport. The complete record for Canberra is available online, no missing months or even days, I checked.
Clearly it would be better if the trial data had been retained, but there is a wealth of calibration data on PRTs and they are widely used without controversy. Jumping up and down and shouting ‘scandal’ over three missing months of non-production data at one site is pretty silly in my view.
PS – I see a similar request was also made to Sydney airport, which did have the required data. It gets sillier.
Furthermore, at least for the ASOS and AWOS sites in the United States I believe they have to be inspected and calibrated at least once per year and possibly more often depending on level. I’m sure BOM has similar policies that would apply to their airport locations as well. The point being that those PRTs aren’t just calibrated once, but periodically.
I see that OZ was warm on UAH as well …
Warmer than any other region in the series, by a fair margin, so …
LdB of “Nice perversion of Australia data on that map, July for Western Australia and South Australia was 2 degree colder than average which magically became 1 to 2 degree warmer” comment.
Care to support with data?
or is Dr Roy committing ” Fraud” as well? (sarc)
The July UAH satellite data for the entire Australian continent that you show is not the July satellite data for Western and South Australia that you claim it to be.
When you make false claims that are easily exposed, you become the laughing stock.
Since you published the UAH record for the entire continent as meaningful, lets look at all of the UAH Australian satellite records for 2021 instead. Its -1.23 degrees for the year and that’s for the Australian summer.
Go ahead and claim fraud for that data that you referenced.
Out of interest, here’s the UAH graph for July 2021 in Australia. Most of the country was between 0.5 and 1.5°C above average. Only the southern tip was more than 0.5°C below average. Not all these averages are compare with the most recent baseline of 1991 – 2020.
That last sentence should read “Note, all of these averages are in comparison to the most recent baseline of 1991 – 2000.
Only July, 2021 was “Warmer than any other region in the series, by a fair margin, so …” Please note that for the vast majority of other months, Australia was cooler than any other region in the series, by a fair margin, so …
The East coast has also been colder than usual
The last 8 months in the Central Tablelands NSW, had recorded around -1C below the normal. I suspect that BOM will fix that in due course.
Good job Paul. Thanks for using “data science” versus “political science” as the BBC typically does.
DEFUND THE BBC NOW!
No, just stop funding it by a compulsory tax. Then see what happens.
Or fund the BBC better so as they don’t need to kowtow to the Government policy at all times.
“Or fund the BBC better so as they don’t need to kowtow to the Government policy at all times.”
You know that that is impossible… He who pays, rules.
In my country there is a contraption called “public service of televison”: it is the legal
excusechannel for the financing by the state. And there is another contraption, the system of governance: it is independent, but… (he who pays, rules!…) there are legal unbalances and unchecks to guaratee that those “freely chosen” actualy will do what the executive wants. And I must pay this system through a compulsory tax built-in in my electricity bills. The system is good for the bureaucraties of the main parties that share the parliament: either they are in power or will be, so they do not question the system: either they are profiting from it or they will profit when they will be in power.The only solution is complete privatization of the capital and complete independence of the bylaws from the government. Free market at work! And, of course, the end of state subsidies to mainstream media with financing dificulties: free market at work!
“He who pays, rules.”
Except at the United Nations.
Right!
Subscription service, sink or swim, might have to give Gary “£1.5 million” Lineker his P45 though, such a shame, worth every penny.
They don’t need to kowtow to the government, they are good socialists so they desperately want to kowtow to the government.
Beyond that, do you actually believe that if government were to start paying the BBC twice as much, the BBC will automatically become independent of the government?
If the license fee was such that they could afford to not fear the next review than yes, the BBC would be independent.
Because the BBC has it’s own political power – it has it’s own media.
“long-term impact of climate change”
Now, there is “long-term impact of climate change”, for sure there is also “short-term impact of climate change”.
As in COVID-19, there is “short-COVID” and “long-COVID”.
Whenever ignorant or superstitious people do not know the reason AND are lazzy (or stupid) enough to refuse to search for the reason, their magical way of “thinking” (if it may be called “thinking”) will define new “concepts”, absolutely void of any connection with the real world, only to appease their psychotic fears. (ironicaly, through nourishing them…)
MSM propaganda at work. Saw 3 articles yesterday claiming the hottest July ever. Now that NASA has lowered the number from 2016 to make this July hotter. Lets change reality to push the “HEAT” agenda. With the actual number for July being 0.2 above the 1979-2021 dates. UAH version 6.0. https://electroverse.net/polar-cold-blasts-australia-nz-and-sa-brazil-corn-output-slashed-portugal-suffered-a-cold-july/ There’s the warm July in EU. We know how accurate the BBC isn’t when it comes to the CC alarmism.
Not the hottest but the GREENEST!
It’s the ho ho impartial BBC
What does anyone [with a brain] expect?
Not the hottest but the GREENEST!
Death by GREENING!
https://www.marketforum.com/forum/topic/69258/
They should have a keg party in Kabul tonight. Oh wait.
… and taking potshots at the helicopters evacuating the U.S. Embassy.
The only good thing about this lieing reporting is, its having increasingly negative effects on the very people its aimed at, a greenie friend said on Saturday ” I just turn off when this comes on”
Its only activists and politicians who take notice ,the general population is bored, muttering it should of happened by now, as we go deeper in to what its really about people are waking up to the fact its going to really f–k up their lives.the real intentions that is.
The NOAA graph shown is for all months – and therefore, being an anomaly, does not show absolute temperatures – just relative to the norm for each month.
Here is the July (only) – the hottest month of any year – anomaly graph from NOAA
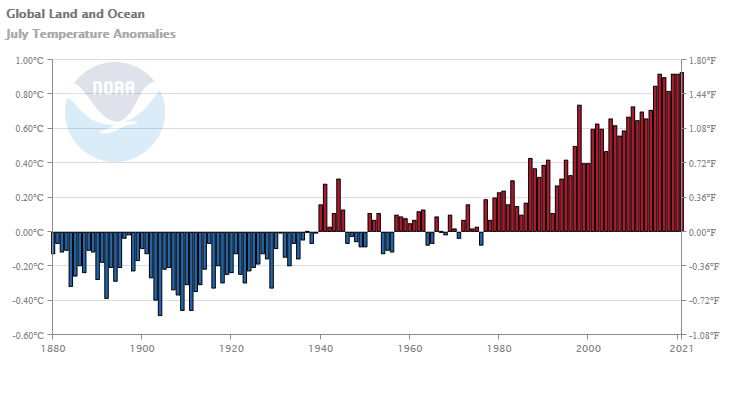
From….
https://www.ncdc.noaa.gov/sotc/global/202107
“and much of the rest is affected by UHI”
No it isn’t.
As repeated studies have shown.
For a start 73% of the Earth is ocean, which certainly isn’t affected by UHI.
“Data from these satellites indicate that atmospheric temperatures are no higher now than in 2002:”
No: “data” from UAH TLT v6 only.
It is the coldest atmospheric temp series by far – and they all use the same satellites.
We live on the surface and it’s here where most AGW is occurring.
Nocturnal land minima are rising under surface based inversions.
Satellites cannot see those.
Can’t get more “adjusted” than that. They must have a bunch of chiropractors up on Table Mesa.
The conclusion must be then, that “Anthony Banton” is YADA, yet another disinformation agent.
Yes him and bellman only comment on temperature articles ,in defence of said articles,
And we learn from this ,temperature is by far the most important part of cc in the climate church of misinformation, they will defend by lieing , showing proven minipulated temperature sets , who are they trying to convince? Certainly not the regulars , casual readers looking for some intelligent debate ,doubters who don’t believe in the climate lie who are looking for some balance.
They control the media ,most websites , so they infiltrate on the last islands of common sense and science,
“Yes him and bellman only comment on temperature articles ,in defence of said articles,”
I comment on them when they are wrong.
As this one is.
Try providing evidence rather than the “down-the-rabbit-hole” fraud argument.
For which no rational discussion can be had except among conspiracy theorists here (of which there are many).
BTW: you forgot Nick Stokes.
(who is taking a sabbatical ATM)
I’m not defending said article, I was questioning the language in the WUWT article.
There might be much to critise in the BBC article, though I’m not sure why they are bring attacked specifically and not say the Daily Mail who also repeated the NOAA claims.
But arguing whether this was the warmest, 2nd of 5th warmest, or what this might or might not mean for the state of the climate, Paul Homeward instead calls the claim that it was warmest, “poppycock” and tries to imply that NOAA are just making it up. Specifically he uses warmer anomalies for different months to claim that this wasn’t the warmest July in NOAA’s own data. Then he repeats the claim that UAH show temperatures are no warmer than in 2002 with no attempt to justify this. In fact July 2002 was 0.1°C compared with July 2021’s 0.2°C.
“In fact July 2002 was 0.1°C compared with July 2021’s 0.2°C.”
So, within the margin of error of the measuring instrument (0.1C).
Could you point me to this assessment of the uncertainty of satelitte measurements?
Here’s something:
https://www.drroyspencer.com/2017/01/global-satellites-2016-not-statistically-warmer-than-1998/
“The resulting 2016 annual average global temperature anomaly is +0.50 deg. C, which is (a statistically insignificant) 0.02 deg. C warmer than 1998 at +0.48 deg. C. We estimate that 2016 would have had to be 0.10 C warmer than 1998 to be significantly different at the 95% confidence level. Both 2016 and 1998 were strong El Nino years.”
end excerpt
Just correcting “alternative facts”
If the data I have corrected is wrong then please supply your own data.
Don’t just throw in the “and with one bound he was free” comment of certain denizens (and ex-presidents) that it’s a “scam”.
And show that NASSA GISS is any different in broad respects than Hadcrut, Berkley or the JMA series.
If you want to believe that it is fraudulent to that extent then there is no room for discussion, except for the usual echoes propping up confirmation bias here.
This Blog needs to decide if it’s science based – or a politics (US centric anti-science – “they’re out to get us” conspiracy theory) one.
The data YOU have corrected?
You’ll have to explain in a sentence that makes coherent sense.
Sounds like your getting religiously desperate Barton.
Wrong spelling, but hey, a religion requires no evidence.
Now, where is yours?
Direct quote from your post immediately above mine:
“If the data I have corrected is wrong then please supply your own data”
Why are YOU “correcting” data?
Oh FFS, do really think that?
But anyway
As Shakespeare said …
“Speak by the card, or equivocation will undo us”..
I corrected the incorrect data that is in the subject of my reply.
That clear your befuddlement?
Or anymore rabbit-hole type quips?
Perhaps you should not only be careful about what you say, but also how you say it because it reads like you didn’t like the data so you corrected it. But hey, that’s climate science..
You are correct.
As when I read it back, after I posted, I saw that the pedantic could use it as a strawman.
Yes Shakespeare was correct in many, many things.
Your such a jerk Barton
I’ve shown BOM DATA is corrupted and none existent
https://joannenova.com.au/2017/08/another-bom-scandal-australian-climate-data-is-being-destroyed-as-routine-practice/
“Your such a jerk Barton”
Any more ad homs — or is that the substance of your stance Mr Clarke?
Fine if you want to believe a conspiracy theory.
They require no evidence.
But science does – How about you, Nova or anybody else that isn’t up to their necks with ideological bias provide it, eh?
That any world Met organisation does such a thing is bizarre.
But then again, there are bizarre folk on here.
Around the world actually as the Trump thing shows.
Another sign of desperation banton a part quote and the rest a denial of whats writen ,you really do sound like one of the paid climate trolls on the guardian and BBC.
This is a classic even for you
” That any world Met organisation does such a thing is bizarre.”
The whole essence of climate deception and you think its bizarre,
Banton your sounding increasingly like one of greta’s fan club
“Banton your sounding increasingly like one of greta’s fan club”
No actually.
Sorry not to meet your stereo-type.
I voted Brexit you see.
I doubt Greta did.
Anthony Banton, are 73% of the temperature readings from the ocean? Didn’t think so. So UHI does affect temperature readings upwards.
Anthony Watts has lead the research on this over the years. Just type UHI in the WUWT search engine and you will see.
How about posting some of these “repeated studies” I’d like to take a look. I bet they’re all recent and the result of Anthony’s work. The question I have is: are they still bias?
“are 73% of the temperature readings from the ocean? Didn’t think so. So UHI does affect temperature readings upwards.”
No. 73% of the Earth’s surface temperature is made up of SST data….
https://www.metoffice.gov.uk/hadobs/hadcrut5/data/current/download.html
“The HadCRUT5 near surface temperature data set is produced by blending data from the CRUTEM5 surface air temperature dataset and the HadSST4 sea-surface temperature dataset. Gridded data and regional time series for HadCRUT5 can be downloaded from this page.”
Please provide one Global study that shows UHI affects it to any significant extent.
“Blending”! Now there’s a useful concept. I wonder what else we could apply it to ….
”I’m sorry your dinner’s burnt, sweetheart. I blended the temperature of the cooker with the rest of the kitchen.”
OK then, next time an all-time max temp is recorded shall we not insist on a full investigation of it (as is the norm now)?
Or shall we just let it go and it become mythical like the unfeasible DV temp record of 1913 (when it was just taken as read – literally).
Now would you like those apples v pears? (rhetorical/sarc)
Thanks Anthony
OK, so if I understand this correctly, if there are 5 sea-surface temperature readings and 100 land-surface readings, the 100 land readings will be weighted to account for only 27% of the final number.
So here’s my link supporting the UHI’s upward affect on temperatures.
https://agu.confex.com/agu/fm15/meetingapp.cgi/Paper/76932
Still waiting for yours.
“OK, so if I understand this correctly, if there are 5 sea-surface temperature readings and 100 land-surface readings, the 100 land readings will be weighted to account for only 27% of the final number.”
No, as I’ve said.
The Global Land+ Ocean is a blend of Land stns and the Global SST series.
https://www.metoffice.gov.uk/hadobs/hadsst4/
“HadSST.4.0.1.0The Met Office Hadley Centre’s sea surface temperature data set, HadSST.4.0.1.0 is a monthly global field of SST on a 5° latitude by 5° longitude grid from 1850 to date. The data have been adjusted to minimise the effects of changes in instrumentation throughout the record. The data set is presented as a set of interchangeable realisations that capture the temporal and spatial characteristics of the estimated uncertainties in the biases. In addition there are files providing the measurement and sampling uncertainties which must be used in addition to the ensemble to obtain a comprehensive estimate of the uncertainty. The data are not interpolated.
The data set initially runs from 1850 to presnet with regular monthly updates.
Brief description of the dataThe SST data are taken from release 3.0.0 of the International Comprehensive Ocean-Atmosphere Data Set, ICOADS (external web page), from 1850 to 2014 and from ICOADS release 3.0.1 from 2015 onwards. From January 2016, these are supplemented by drifting buoy observations “Generated using E.U. Copernicus Marine Service Information” from CMEMS (Copernicus Marine Environment Monitoring Service). HadSST.4.0.1.0 is produced by taking in situ measurements of SST from ships and buoys, rejecting measurements that fail quality checks, converting the measurements to anomalies by subtracting climatological values from the measurements, and calculating a robust average of the resulting anomalies on a 5° by 5° degree monthly grid. After gridding the anomalies, bias adjustments are applied to reduce the effects of changes in SST measuring practices. The uncertainties arising from under-sampling and measurement error have been calculated for the gridded monthly data as have the uncertainties on the bias adjustments following the procedures described in the paper.”
Any chance you can explain this to me in laymen’s terms? I’m trying to understand it, not just copy/paste.
I read the term “interchangeable” as “oh, that number doesn’t work for us. Let’s interchange it.”
So here’s my link supporting the UHI’s upward affect on temperatures.
https://agu.confex.com/agu/fm15/meetingapp.cgi/Paper/76932
Nitpicking, but that is not technically a paper, it was a poster presentation and so not peer-reviewed. Some of the same team, with the addition of John Christy and Steve McIntyre (although Mr mcIntyre described his involvement as ‘very last minute and limited.’) did produce a paper in 2012 with the same conclusions, promising to submit it to be published in a journal. Critics were quick to point out flaws, such as the use of unhomogenised data and the lack of an adjustment for Time of Observation bias. Apparently if you do correct for these factors the discrepency disappears.
It seems the paper did not pass review as we just passed the ninth anniversary of it being posted and no journal has taken it up.
Wickham et al (coauthors include Judith Curry), published under the imprimateur of the Berkeley Earth project examined data from 36,869 station records and found no signiicant warming influence from UHI.
John, do you really think a multi-trillion dollar cabal would support further research into anything that would remotely work against it?
What’s their battle cry? “The Science is Settled!”
Be serious anything before 1980’s can’t possibly be used to that level of accuracy.
I’m just reporting what’s done.
Folk on here will NEVER accept any evidence/measure by scientists unless by “people we trust” … and temps always have to go in one direction.
Just another example of we cant be sure.
Ergo it’s not happening.
No, we trust discrete measurements of temperature in a Stevenson screen at a single location and at a single time, NOT averaged, gridded, blended or adjusted data.
In that case the human race will get nowhere with knowing the direction of travel of climate.
The likes of most denizens will never accept the science.
That is not because of the science.
SO makes no odds does it?
Mind – you could always see what nature is doing.
Like this FI ….
https://esajournals.onlinelibrary.wiley.com/doi/full/10.1002/ecs2.1465
On the contrary, if we go back to using empirical physical quantities rather than statistical fantasies like “adjusted” temperatures we will start to learn something about Climate.
I don’t need any of this expensive twaddle of “human race will get nowhere with knowing the direction of travel of climate.”
I am old enough to know a fraud when I see it.
In my lifetime I have seen hot, cold, miserable, very hot, and plain poor and boring summers.
I take it,- that’s weather.
I also don’t see a fat lot of difference between a snowless Baltic states, then another which is frozen over and snowed out.
IDEM in Ural Russia, and certainly killed off 2 invading armies, one from France & the other from Germany.
They both got the weather and general trends totally wrong!
What really gets up my nose is some snotty nosed academic who tells me what I can and can’t do based on garbage spat out by a computer..(or some specialised weather service!)
..and how I am unlikely to believe forecasts which floored both Bonaparte and Adolf.
The same computers that stated millions of dead in the UK from a virus which is known to kill maximum of 2.5% of its victims no matter whether they had the shot or not.
Someone is telling porkies, or somebody who has to make a living (like me) from knowing how the weather will be in the next 2-3 days doesn’t know by now what he is on about.
Banton you are wasting your time.
Problem is credibility and I don’t believe a word you write, just like I don’t believe the French President even when he calls himself Mr Jupiter!
Dude, you can’t tell the weather accurately past three days and you have the arrogance to pretend you could predict the direction of the climate. I can understand your petty swindle of posing as the holder of “the Science” to make an easy living out of taxpayers, but give it break, you’re not special and you don’t see what other people cannot see.
“… you’re not special and you don’t see what other people cannot see”
He’s not seeing anything others don’t. He’s seeing what those who are wilfully blind don’t want to see. Take the point he makes that this July is actually the highest ever recorded, contradicting (with evidence ) what the post says. And he gets downvoted for it. Now either those people didn’t understand him, or they just don’t want to believe, or they know he’s right, but want to still mislead. I suspect it is the later.
You mean contradicting with manufactured evidence
If you think the evidence is being distorted or falsified then you need to say how, otherwise you are just blowing hot air.
As far as I can see it’s you blowing hot air.
I really don’t give a damn about “temperature records”, I work outside all summer, and I plan my work / holidays according to the weather.
(planning much better than the UK MO and their ilk can ever do).
I left central Europe at the end of June for the precise reason I could see July was going to be catastrophically cold & wet, and that the weather would “sort of” come back to “normal” ie. very hot in as per normal about 10th August.
There is a basic rule of thumb in France.
It is “canicule” until 15th August, followed by a few days of storms, then the big heat is over.
The “heatwave of 10-15th august is therefore absolutely normal, but my money is on generally colder and wetter, with an unseasonably sharp drop in temps mid September with snow 1 month early in Russia.
We had an extremely cold spring, lasting until very late.
The summer is already over after the July heat, in pretty much all over Scandinavia/northern Russia, Baltic states, and by next week it’s basically AUTUMN.
You wanna tell me this year was HOT???
You are absolutely KIDDING!
It’s cold, cold tendency, and that is born out by the closure of my friendly wine coop in the Loire valley 2 years ago after 100 years….
Why??
LATER and later frosts destroyed the harvest, just as it did over most of France this spring!
Nice try, but you just showed that there’s an inconsistency between the anomalies on the plot that shows all months vs. just July. On the plot that shows all months there’s not one single month in two different periods >1 year in duration with an anomaly less than July 2021. Therefore, at least one July in each of those periods had an anomaly greater than July 2021. July 2021 can’t possibly be higher than third place. The two plots are inconsistent, so at least one of them must be wrong (maybe both). The July-only plot should have been produced by computer from all months, but clearly wasn’t – so at least one of the two plots was fudged (maybe both). The July-only plot was used to make an alarmist claim – which couldn’t be made looking at all the data so it was, undoubtedly, fudged.
“On the plot that shows all months there’s not one single month in two different periods >1 year in duration with an anomaly less than July 2021.”
Eh?????
Just confusing word-salad.
Look it’s quite simple.
An anomaly of all Julys shows 2021 to be the warmest (GISS).
July is the warmest month of the year globally.
ERGO July 2021 is the warmest month on record.
And the plot was CLEARLY fudged. Anyone with half a brain can see this.
If a whole year was warmer than July 2021, the July in that year was warmer than July 2021, too. DUH.
It’s disgusting that you Alarmists feel you have to defend the narrative no matter how provably false that narrative is.
But most of all other July temperature readings in earlier years for Australia are lower than the the various other global temperatures. Had one taken those readings into account, they would assume Australia was cooling in July in relation to the rest of the world. Cherry pick one July in Australia and you get burnt cherry pie.
so kindly tell me W(hy)TF are French people all moaning that July was one of the wettest coldest months they had in years????
The weather was terrible in Germany, France, Italy with constant rain, cold and floods!
By contrast it was really hot in Baltic states, and a good deal of Russia, where the heatwave from the south moved north.
While I am prepared to admit June was unusually HOT (caused not by climate change!), but by an effect of low pressure over northern Europe and high pressure over Africa, bringing an airstream for weeks of very hot air (and sand) up all over southern Europe!
It often happens btw!
In short, July weather in June, and October weather in July…
You work(ed) for UK MO?
Wow I am not suprised, the most inept and overpaid service ever not “the HOTTEST JULY EVAH!! huh!
No, about 70% is ocean and about 1% is freshwater.
Yes, and therefore if we are talking about how hot the month is, we should really be talking about the average Max’ temperatures and not the average mid-range temperatures. Where did you get the idea that “surface based inversions” are responsible for increasing minima? What is happening is that the rate of radiative cooling of the surface is slowing.
They use just single month as their anomaly base and all the way back to 1880, when the article used the ALL months setting that goes back to 1980, which is why they made a misleading claim and you fell for it.
The article was honest and the NOAA wasn’t.
Shame on you.
“They use just single month as their anomaly base and all the way back to 1880, WHEN THE ARTICLE USED ALL THE MONTHS SETTING THAT GOES BACK TO 1980, which is why they made a misleading claim and you fell for it.”
“It is the highest temperature since record-keeping began 142 years ago. The previous record, set in July 2016, was equalled in 2019 and 2020.”
Question: why do those two statements not tally Sun?
Actually the whole comment is muddled to me.
Is it what you meant to say?
2021 – 142 ~= 1880.
July is always the hottest month of the year globally.
Therefor a record anomaly for July this year makes it the hottest month for the period 1880 to 2021. Period.
A. B.
Thanks, I followed your link, went down a couple tabs to the: year to date comparison to 20thC avg. Irrespective of July’s figures, the seven months combined gives a view that this year’s anomaly, is rather unremarkable.
I would not have guessed that otherwise.
https://www.ncdc.noaa.gov/sotc/global/202107/supplemental/page-1
Please show maximum temperatures only. Then show minimum temperatures. Also split out land from ocean. This jumbling of data in a blender hides interesting truths.
Averages hide a multitude of sins. And, when you mix apples and oranges you get a Waldorf salad, not orange juice.
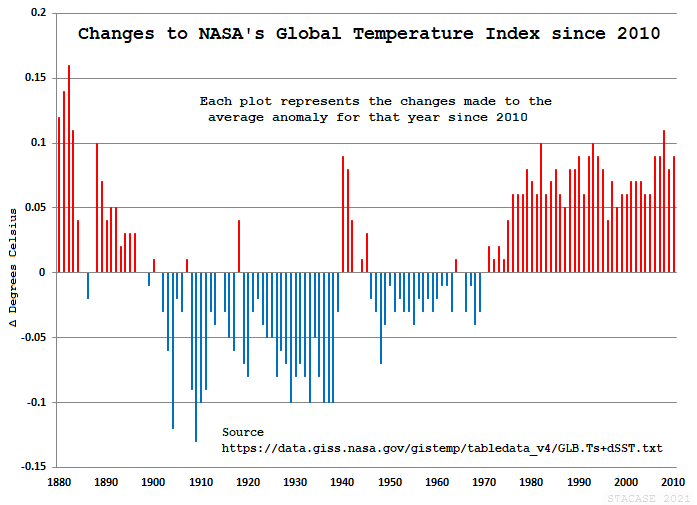
So far this year NASA’s Land Ocean Temperature Index [LOTI] has been altered every month January through July by an average of 358 changes to all those monthly values since January 1880. Over the years those changes add up. Here’s what those changes look like since 2010:
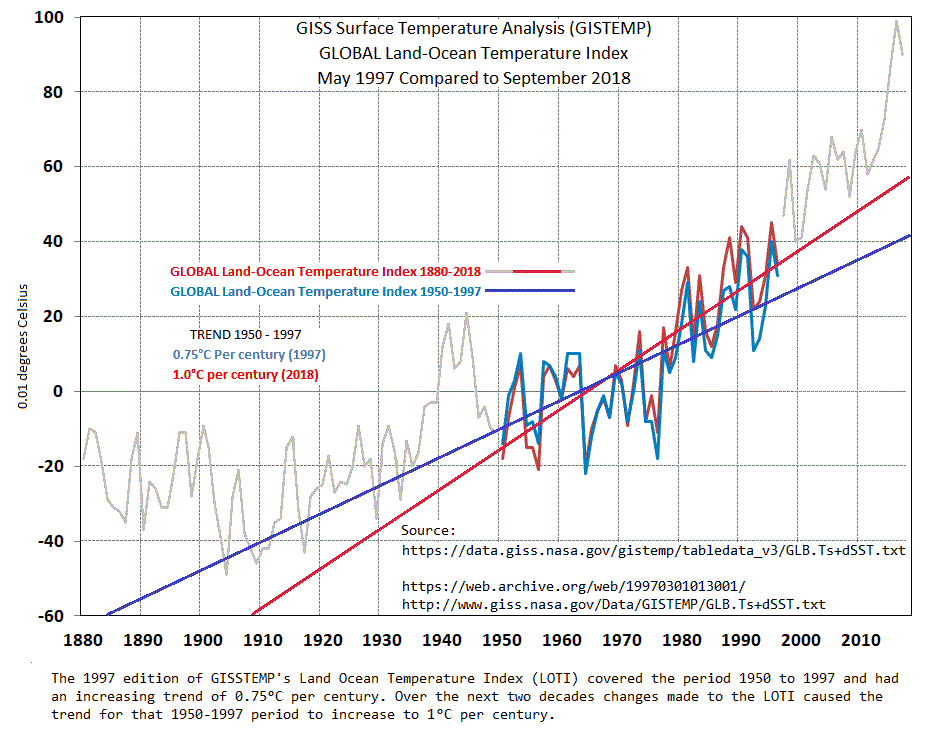
Here’s a graph that shows how those changes since 1997 have changed the rate of temperature increase from 3/4° to 1°C per century.
The red adjustments in the early 1940s is quite interesting, as it should be well known that the winters of 1940-1944 were quite severe in Europe.
I’m sorry, but your mean squares line drawing is by eye a long way from statistically meaningful.
It looks alarming at the extremes but a little more data – I don’t know – maybe 20 odd years after the red/blue trends finish would narrow it enormously.
Would you care to provide same?
And here are adjustments to GISS in comparison to the Sat top series ….

From:
https://moyhu.blogspot.com/2018/01/satellite-temperatures-are-adjusted.html
Ergo the Adjustocene.
The linear trend lines were derived by Microsoft’s Excel. Each trend is for the period 1950-1997. The gray line merely shows you what the time series was in September 2018 when the graph was created. Nothing was eyeballed.
UAH reported 2021 as being the =5th warmest July on record, Joe Bastardi said it was the 2nd warmest. Why does it only become disgraceful when it’s reported as the 1st warmest?
Because it’s not.
And it all depends on where you happen to be in the world when taking its temperature. This year in northern Portugal, it has been quite cool. July was in the low 20s on average. This is NOT a hot month. Alarmists really do need to stop talking about average global temperatures because it is a meaningless metric.
“Alarmists really do need to stop talking about average global temperatures because it is a meaningless metric.”
It’s call Anthroprogenic GLOBAL warming.
Do you have a better one?
Yes, simple admit the the average global temperatures is a sad joke on the world. It a meaningless number because other than satellite measurements, we cannot measure all of the surface in any meaningful way with our present technology. As to what the past measurements are just as bad.
All one can say is with the measurement system we use today we have a patchy track record as to what going on. and we only have that for around 30 years we have no idea how today equipment works in reference to the old equipment since no one bothered to make those studies.
The girding system they climate scientist use is to large and change data because some reading in a said grid are different and so they may be wrong is pure BS temperature differences occur in as little as a few miles apart for very good reason you cannot average them out. The county I grew up in Minnesota had a very different temperature and rainfall pattern than any of the sounding counties due to it typography. Not it measurement are no longer in the record(station closed down) and even if it was it would get change since it would be very different at time from the surrounding stations.
The only thing one can say about climate is local changes and only on short time scales since we do a very poor job on keeping equipment working and reporting going through out the weather data collection system. If the climate scientist ran a bank they would have been shut down years ago. It very sad that the nation weather service which was created to help out farmers in information of what to plant and when to plant can no longer be used by our farmers since they predictions are wrong more off than right and said farmer have to pay for accurate prediction from private firms in this day and age. This came about due to the “Anthroprogenic GLOBAL warming” hoax
“Yes, simple admit the the average global temperatures is a sad joke on the world. It a meaningless number because other than satellite measurements, we cannot measure all of the surface in any meaningful way with our present technology. As to what the past measurements are just as bad.”
So, OK – lets just give up, forget it and carry on.
By that measure (LOL) human kind would have got nowhere.
“the “Anthroprogenic GLOBAL warming” hoax”
Yes, yes, of course it is.
The Chinese made it up.
Just like COVID.
“the “Anthropogenic GLOBAL warming” hoax”
Yes, yes, of course it is.
“The Chinese made it up.”
Andy Barton gets something right for once.
Exactly correct! AGW is a hoax created by people to further their own agenda.
I live in Portugal, a small, narrow country on the Atlantic coast of the Iberian Peninsula. An average temperature here is totally worthless because along the ocean it is always cooler than just a few kilometers to the east. The southern part of Portugal is always much warmer and is a winter haven for people living in other parts of Europe. It can easily be 35C in the Algarve but only 25 in Porto in the north. And we have excellent weather stations all around the country. Unlike the entire world, which has very few and many are located at airports, really poor places to measure temperature.
The point of all this is that an average temperature for Portugal is totally worthless if you want to know if it is a good day for the beach or to go hiking. The only temperature that is useful is the one for where you live or plan to go. This is the same for the average Global Temperature, a made-up number that means nothing to anyone who is not in the business of spreading scary stories about Fireball Earth!
example = on our 7 acres of land the temperature can vary by 10 degrees from the north side to the south side, i CANT even tell you a single temperature that applies to our entire 7 acres, and any average would be WRONG almost anywhere i took the temperature….trying to do that for the globe is much more difficult than for our tiny part of it.
keep lying, no shame
All climate is local.
I shall cast no aspersions on how you were raised – I don’t know your parents, so shall assume that they did the very best they could.
But MY parents managed to drill into my head that a blatant self-serving LIE IS disgraceful!
So NOAA spews the lies and media just echoes them. Got it. I wonder, since they lie about everything else, will NOAA release a statement telling us American personnel are not being evaced by helicopter from the roof of the embassy in Kabul? When they lie they should go all the way!
It’s a shitshow. I wonder what NOAA thinks about biological sex. It’s embarrassing when the Taliban is more scientific than the American Medical Association.
Their mouthpiece in Qatar is prattling on about how peaceful their take over and how people cheering them in the streets all the while cnn has embedded reporters with the taliwackers. Wonder how much Soros is paying to keep those idiots heads attached to their shoulders.
I wonder if the Taliban will be invited to attend COP 26 and join the Paris Agreement.
Kamala Harris and AOC could be sent to Kabul to present the invitation.
I got no problem with shipping the entire US Democrat Congressional leadership to Talibanistan. The Taliwackers will have a ball with them.
“There are no tanks anywhere near Baghdad!”
They do and are: Creepy Joe and his junta are now blaming the fall of Afghanistan on DJ Trump.
It is happening on Biden’s watch. Therefore, he is responsible. He should have taken into account what he claims Trump did, and compensated for it. Biden is a whiner.
It is all he has in the gas tank, fumes.
When Trump started the troop reduction he also ordered DeptState to reduce its numbers of personnel. In January Biden reversed that, and bragged about it. Now they are being flown out off the roofs of buildings, just like Saigon.
Donald Trump has not been the Commander in Chief in seven months. Everything that happened in Afghanistan on Joe Biden’s watch is his responsibility. He owns it.
Blaming others for the results of your actions is disingenuous.
When Donald Trump took office, General Mattis, the Secretary of Defense, came to Trump and told him the U.S. military was critically short of ammunition. How would you like to hear that on your first days in Office?
That was the situation Obama and Biden left the U.S. in. In the lurch.
I’m betting when Biden took office again in 2021, his ammuniton stores were full, after Trump left.
Trump’s plan was to reduce troop numbers in Afghanistan, but not to the point where the Taliban could take back over. The NATO allies wanted to keep troops in Afghanistan and were lobbying for keeping about 7,000 total troops in Afghanistan. So a complete pullout was not in Trump’s cards.
Biden threw all those plans in the trash and just pulled out abruptly with no warning. And typically, he is blaming Trump for everything. It’s what Democrats do when they have no answers.
Biden screwed up royal this time. He’s going to have a hard time spinning this one positively, even with the help of the Leftwing Media. The stupidity is too obvious to hide.
“When Donald Trump took office, General Mattis, the Secretary of Defense, came to Trump and told him the U.S. military was critically short of ammunition. How would you like to hear that on your first days in Office?”
Except Mattis didn’t tell Trump that. It was another of Trumps untruths.
https://www.vox.com/policy-and-politics/2019/10/8/20904391/trump-military-ammunition-lie-explained
A l’Orange is now trying to delete a twitter post he made months ago, dissing Biden for keeping as many resources in Afghanistan for as long as he planned to. DJT wanted Biden to move even faster.
No white hats here. Since we didn’t plan for this, we didn’t effectively “chip” every Afghan helper for the last 15 years, and lay out terms and conditions all along. As in, “One spouse, and the kids that are either bio or formally adopted and depend on you.”. When you observe that how, in Saudi, every Bedouin who manages to secure ARAMCO employment ends up with over 60 “dependents” for ARAMCO health and ancillary services, you can see how out of hand such offers can get…
You are insane.
Apparently this post flew over your combover. I.e., “effectively “chip”” is a euphemism for:
Sorry you prefer to politicize the issue rather than to look for actual solutions….
CNN-Simon quotes another infamous communist source: Vox.
Biden also trashed the agreement with the May 1st time spot, arbitrarily changing it to Sept. 11. Obviously the Taliban felt that if the US was not going to uphold their side of the bargain, they were free to take over in the vacuum.
Giving him an additional 17+ weeks to prepare for a safe, orderly evacuation, which he didn’t take advantage of!
They had that teed up since November.
According to UAH to find a hotter July than 2021 you have to go all the way back to …
2020!
As posted a few weeks ago:
UAH Global Temperature Update for July, 2021: +0.20 deg. C – Watts Up With That?
“According to UAH to find a hotter July than 2021 you have to go all the way back to …
2020!”
But no-one’s saying it wasn’t.
It’s just that UAH isn’t the planet’s surface.
Where we all live.
And where the warming of night-time minima cannot be picked up by satellite.
Can you personally, physically discern a difference of 0.2K in the global average temperature?
What are you expecting in order for your bias that there is no such thing as AGW to be erased?
That a record month be some whole degrees outlying the previous record??
You are aware of the glacially slow temperature trends prior to the industrial period?
It is what we measure.
It is all we can measure.
That it is what it is, is no reason to argue that 0.2C or whatever is meaningless.
Yes it is 0.2 C is way below the errors bars, the error bars are at least 1C if not 5C. The infilled and change data make that certainty. Unless you can measure something day in day out with no failures of data changing the error bars are going to be huge. Climate scientist are no capable of fill a jet liner with fuel because the error bars they deal in would allow the plane to rune out a fuel many miles short of the runway. That the stupidity of this whole thing.
“Yes it is 0.2 C is way below the errors bars, the error bars are at least 1C if not 5C. “
Citation required.
If it were NOAA would have said “not significantly different”.
Did they?
Do you not expect that they would have knowing that the stats sleuths here would have rubbished it (sarc)
I’ll go ahead and assume your answer is ‘no’.
Bullshit. Because of the loss of frequency information, paleo proxies can’t tell anyone what the annual temperature change trends were. Since the advent of thermometers, earlier trends are on the order of recent trends. Even Climategate hero Phil Jones said there were warming trends in the late 19th Century and early 20th Century that were almost exactly the same rate as that of the late 20th Century. CliSciFi practitioners haven’t been able to erase all of history.
“You are aware of the glacially slow temperature trends prior to the industrial period?”
With the single brain cell you appear to have working.
Are you (at least) aware that there were no semi-accurate temperature measurements until about 30yrs ago.
Attempting to claim anything else is not science.
Are you attempting to claim that temperatures in the medieval warm period were also “glacially slow”, when it’s clear the world has:-
warmed to warmer temperatures, just as fast in the past, to higher temperatures than today, but we can’t actually get measurements at all on those periods, because the vikings didn’t have thermometers, the polar bears survived just fine, and civilisation in the 1st century AD allowed wine grapes to be grown on the Scottish borders???
All I can see you spouting in this p..ss.ng contest about “a hot July” is media hype and some old MO fogey who hasn’t a clue about anything outside bl…dy “royal” Berkshire!
Then why are you conflating ocean and land temperatures? You should focus on just the daytime land temperatures.
Why?
The higher minima at dawn over land that is being experienced in AGW is energy remaining in the climate system.
It is not trivial.
Again, as seems hard for denizens to realise.
It is the G in AGW.
That means all the globe. Al of the time.
Or at least as close an approximation of it as we can get with just max+min/2
The unstated assumption is that the residual energy automatically translates to increased maximum temperatures. However, if you plot the minimum and maximum diurnal temperatures, it becomes obvious that the minimum is increasing faster than the maximum. Therefore, the assumption is wrong.
Willis has demonstrated with his ’emergent phenomena’ that there are strong negative feedback loops that at least partially explains why the residual energy doesn’t automatically translate to increased max’ temps.
It seems hard for true believers to realize that things aren’t always as simple as they believe.
“It’s just that UAH isn’t the planet’s surface.
Where we all live.”
The satellite data correlates with the Weather Balloon data. Both the satellites and the Weather Balloons measure from the ground up.
Since the Weather Balloon data confirms the accuracy of the satellite data, it also shows that the NOAA and NASA temperature record is not accurate because it does not correlate with the satellite data or the Weather Balloon data.
NASA and NOAA’s temperature records are not fit for purpose.
Roy Spencer says the other competing temperature measurements are running too hot because they incorporate bad satellite data into their calculations.
One satellite Roy used to use for temperature readings started malfunctioning and Roy stopped using it, but NOAA and others continued to use this flawed satellite data which runs hot, so their calculations run hot.
CAGW is based on the assumptions that GHGs affect tropospheric temperatures (Remember the hot spot?) which are reflected to the surface. Don’t change horses in the middle of the raging river, Anthony.
The Associated Press newsroom can be contacted at:
https://www.ap.org/contact-us/
Corrections can be sent to NPR at:
https://help.npr.org/contact/s/contact?request=Submit-a-correction
It is a sample of things to come: More lies. More brazen.
“Two weeks to flatten the curve.”
Yeah, George, we are seeing a hysterical propaganda buildup for COP26. What lies are the lying liars going to fabricate when COP26 blows up because the West doesn’t have the money to bribe the majority of UN IPCC voting members? There never was any money and the imaginary annual $100 billion slush fund was a knowing lie by the West to get everyone signed-on to the 2015 Paris stupidity. At the UN IPCC love-fest, the Developing World warned the West there would be hell to pay if the money wasn’t forthcoming by the 5-year pledge renewal period (delayed one year by the ChiCom virus). The ChiCom virus world recession guaranteed that the earlier flimsy hope for more Western money would not materialize.
Too late now. News of the hottest month ever has traveled the world like a media pandemic and infected all of the masses.
There is no undoing the trouble we see.
Soldier on.
NOAA
No
Ordinary
Academic
Alteration
Notoriously Oversuspicious Anomaly Adjustments
hillbilly common sense = to get to hundredths of a degree precision requires extreme calculations with input from the entire globe and while you are making that calculation the numbers CHANGE before you can finish = claiming we have such precision in arriving at ONE temperature for the globe is INSANITY
“claiming we have such precision in arriving at ONE temperature for the globe is INSANITY”
Have you got a better way?

Maybe the sat TLT data.
The changes over time looking like this ….
https://moyhu.blogspot.com/2018/01/satellite-temperatures-are-adjusted.html
And how is it that such an “impossibility” shows such coherence of the record even paralleling the sat TLT record …

NO i do not have a better way because there is NO good way the point such precision does NOT exist
Bill what you say is true but the “true believer’s” will never accept that. My WAG on there error bars would be plus or minus 5 C at best 2 C?
Yes, I completely agree that you are a lot closer to the truth here.
“ My WAG on there error bars would be plus or minus 5 C at best 2 C?”
and the evidence is?
You don’t need to guess, NOAA publish the error margins every month and describe their calculation method in peer reviewed publication. (I wonder why so few self-proclaimed skeptics go to the trouble of checking simple things like this out before pronouncing on them?)
“NO i do not have a better way because there is NO good way the point such precision does NOT exist”
Look.
It comes out in the maths.
Lets give up then because we cannot know anything with 100% certainty.
If your employer has such a liberal view regarding your salary or wages as yourself you shouldn’t have 100% certainty you’d get paid for whatever you do
The precision is not derived from direct measurements, rather from the averaging process. Enter any random series of, say, 5 different single digit whole numbers, mixing odd and even, into a calculator and average them. They will produce a string of decimal places. That’s with just 5 single digit whole numbers. Even pre-digtal temperature data were often recorded to 1 decimal place, with thousands of meaurements used to produce the global average. The precision of an averaged value doesn’t mean that the input numbers are somehow ‘wrong’ or unrealistic; whether using temperature data or anything else.
Yes, don’t publish numbers with indefensible precision! Recent individual station temperatures are, at best, +/- 0.05 deg C. Taking into account the issues with sampling protocol and using mid-range diurnal temperatures as the raw data, the global average is probably no better than +/- 0.5 deg C. Again, if one is using increasing temperatures as a warning about possible consequences, then the focus should be on the daily maximum, not the mid-range temperature.
I would go even further than that. We should quit trying to calculate a global average but work on regional daily high and low anomalies. Pacific coast climate in the USA is nothing like the northern plains or Gulf of Mexico coastal climates. I live in a climate characterized by daily highs and lows not some contrived average. A daily average of 25 C could mean a climate with a daily high and low of 30 and 20 or one with a daily high of 40 and low of 10. Two vastly different climates can have the same average temperature.
indeed more water vapor in the air for an area the smaller the swings between high and low temperature, and the areas with very little water vapor in the air have HUGE swings in daily highs and lows…..
For some time I have advocated that instead of using global averages climatologists should be reporting the behavior of the Köppen climate zones. It would be much more informative. However, maybe the alarmist don’t really want the data to be informative. What with the Arctic, and probably the Sahara warming much faster than the mid-latitudes it would be less scary.
“then the focus should be on the daily maximum, not the mid-range temperature.”
That is not the measure of energy in the climate system.
And the Oceans?
where 93% of TSI is being absorbed?
Biological systems are stressed by temperature, not the energy in the system. With most of the energy going into the oceans, that means a minimal temperature change because of the high specific heat of water. And, because heat is transferred by conduction from the hot to cold, that energy is stuck in the oceans until the air gets below the temperature of the water. Thus, that energy primarily acts as a buffer to temperature changes rather than creating stressful temperatures.
There seems to be controversy about whether the Great Barrier Reef is being stressed as much as some claim. Corals have been around for hundreds of millions of years and didn’t become extinct during the Paleocene-Eocene Thermal Maximum. They appear to be more resilient than alarmists give them credit for.
“ Corals have been around for hundreds of millions of years and didn’t become extinct during the Paleocene-Eocene Thermal Maximum”
Actually, most of the corals that were around then did die off. The species around now are very different – and many are near the limit of their thermal stress tolerance.
Corals are 500 million years old, and date back to the late Cambrian period, during the Paleozoic era (Fig. 1). Evidence suggests that they started as simple, solitary organisms but, in response to changes in their environment, later evolved into the coral reefs we know today. It is also known that over the 500 million years, during which corals are known to have existed, they have experienced a number of extinction events. These extinction events were largely the result of dramatic changes in their environment, such as we are seeing today.
[…]
The climate of the globe is currently undergoing a rapid PETM-like event (a warming period), driven by greenhouse gases as in the PETM. Evidence now suggests that coral reefs will pass a point of no-return around 2040, and go into terminal decline, eventually disappearing at the end of this century. If so, based on past evidence, it is likely that many millions of years will pass before they return.
http://globalreefproject.com/coral-reef-history.php
”Evidence now suggests that coral reefs will pass a point of no-return around 2040, and go into terminal decline…”
That is simply BS. How do explain the healthy population of corals in the Red Sea where water temps go beyond 30 degrees C. Also corals would adjust by moving deeper and further than the tropics. ”Eventually disappearing at the end of this century” is absolute crap.
Rubbish; coral reefs are thriving.
There was a huge coral reef system found off the mouth of the Amazon river recently, which no one even anticipated was there.
Obviously, all the corals did not become extinct during the PETM. If they had, there would have been none to evolve, which is what life forms do then their environment changes. A changing climate, which it always is, can be dealt with either by migration or evolving to adapt to the changes. Extinction is not the only possible outcome. The Eocene was a period of rapid evolution for mammals. We humans might not be here had it not been for that ‘unprecedented’ warming which you claim was similar to what is happening today. Corals may have a few tricks up their mesenteries that we haven’t yet discovered.
There seems to be a certain mentality, exemplified by alarmists, that change is always bad, and has no positive outcomes.
Bill Taylor : “claiming we have such precision in arriving at ONE temperature for the globe is INSANITY”
Anthony Banton : “Have you got a better way?”
Logical fallacy – whether or not one can relate a “better way” is not justification that the “current way” is correct. If the “current way” produces incorrect answers, we need to call those out and stop promoting the method.
It has never been clear to me how attempting to produce a number called the Global Temperature is supposed to work given the irregular and often sparse data collection which historically was not designed for high accuracy.
It has never been clear to me why it is suddenly OK to mix air temperature data with water temperature data as if they are measured or behave in the same way.
It has never been clear to me how UHI is to be handled given it changes with every urban area and even within a single urban area in both location and time of day and changes over years of time.
It has never been clear to me why we would use the average of maximum temperatures for day and night instead of using the complete set of data for that day to determine an average temperature.
It has never been clear to me what a Global Temperature is supposed to be telling us given that it is affected by the Sun’s radiance, cloud formation which is impacted by cosmic rays, land use changes, soot and aerosols in the air, etc.
It has never been clear to me why people who know better continue to report temperatures using hundredths of a degree when the margin of error makes that precision laughable. Why not degrees, or tenths of a degree if you must?
It has never been clear to me why anyone thinks that a new high temperature is of any importance or somehow unexpected given what we already know about Natural temperature changes over decades and centuries. How does something that is already expected to happen Naturally become proof of some new and sinister effect, or support of a “greenhouse gas” driven forcing?
Well, UAH6 didn’t cool the past like the others. And Drs. Christy and Spencer fully documented their version 6 changes. You really should read their paper. RSS’s Mears mistakes on use of failing satellites and model-sourced satellite deviations rather than observations such as UAH to adhere more to reality.
Since 1997, the satellites have served to limit NASA data manipulations. Visit Tony Heller’s site to see what the data manipulators at NASA and NOAA have been up to over time. You won’t, but other readers might.
You trust Mr Heller? Wow.
https://moyhu.blogspot.com/2019/07/fake-charge-of-tampering-in-giss.html
“ to get to hundredths of a degree precision requires extreme calculations with input from the entire globe”
No it doesn’t, it just takes simple division.
It’s just the precision of the maths and not of the Global temp.
But anyone with unmotivated common-sense would know that.
you really dont understand you made my point? “It’s just the precision of the maths and not of the Global temp.”….that IS my point indeed you can do math to within hundredths of a degree but that IS NOT the global temperature…….
Right we cannot and do not know the global temperature we have a number some think it is! It not a mater what they think it is. The problem and what they will not accept is. There is just to much errors, biases and inability to measure the temperature accurately in the system to know what said number really is. They are not will to accept they are on a fools errand. It to bad most of the world do not understand that.
Global average temperature is an indicative figure only. Scientists know that too. Does this really need to be explained? As long as it is calculated in a consistent way which, yes, requires adjustments over time to maintain consistency (account for station moves, UHI, etc) it is a useable indicator of change over time; just as any other averaged time series can be.
“but that IS NOT the global temperature…….”
Intuitively obvious.
But that is the convention.
Apples to apples.
It is what it is.
Lies, Damned Lies and Statistics.
If you measure the heights of 30 people using laser precise instruments then average them, you will get a value to many decimal places that is different from any of the measurements you entered. That doesn’t mean that the values you entered are wrong or that the averaged value has no significance.
How many decimal places are there in the reading of a thermometer? Can you now see how ridiculous yor argument is??
Digital thermometers will report several digits. Most comply with IEEE 754 specification which I believe means 32-bit (single) and 64-bit (double) values have 7 and 16 significant digits respectively. Sometimes digital processing will only display 6 or 15 (or less) digits though. Anyway, my point in responding really is that the number decimals places reported by the thermometer is not the same thing as its assessed uncertainty. Just because a thermometer reports 16 significant digits does not mean its uncertainty is that low.
What you likely meant to ask was “What is the uncertainty on the reading of a thermometer?”. For thermometers placed into service prior to WWII it is likely no lower than ±1 C. For the higher quality instruments in the USCRN stations I believe it is mandated to be no higher than ±0.3 C.
How many Stevenson screens have digital thermometers???
I don’t know. I think all of the ASOS and AWOS sites in addition to the USCRN network are automated and utilize digital processing of the instrument. I’m not sure about stations outside of the United States, but I suspect a significant percentage of them utilize digital processing as well. Maybe the better question is how many stations still utilize the old non-digital MNMX style thermometers?
Showing your religious extremism Barton every one who’s replied to you disagrees with you ,yet you can’t admit to the shown fraud of BOM https://joannenova.com.au/2017/08/another-bom-scandal-australian-climate-data-is-being-destroyed-as-routine-practice/
Being in denial Barton contrary to the shown manipulation and removal of decades of data ,shows your a extremist who is dangerous to society.
“Showing your religious extremism Barton every one who’s replied to you disagrees with you ,yet you can’t admit to the shown fraud of BOM”
No.
Everyone has disagreed with the science.
Not me.
Show that what I posed is not from recognised science organisations.
With some data, showing they are wrong.
Ms Nova is not science and she nor anyone else has a gnats-piss of evidence that there is some kind of global, socialist scam going on.
“your a extremist who is dangerous to society.”
Eh??
I am a retired UKMO meteorologist who knows the science and is not motivated by ideology.
I could say the same of you.
But that would be an ad Hom now wouldn’t it?
Which is against Blog rules.
Do try to separate the science from the messenger.
And this is just a Blog of motivated people who think that they know better because they don’t like it.
In the scheme of things it matters not a jot.
It’s just an avenue where you can vent anger at the world.
I know. I know.
I expected a rabid type to attack me.
I come here to pass some time and correct fake news.
It’s easy you see.
Everyone has disagreed with the science.
Not me.”
Considering you have pasted links to corrupted data thats not science
As your the poster who presumably agrees with what you post, every one does disagree with you, what stupid statement to make in case you don’t understand what you said here it is again
“Everyone has disagreed with the science.
Not me.”
Show that what I posed is not from recognised science organisations.
With some data, showing they are wrong.”
I did you just don’t like it.
“I am a retired UKMO meteorologist who knows the science and is not motivated by ideology.”
I don’t believe you, but you have the opportunity to prove it.
“I come here to pass some time and correct fake news.
It’s easy you see.”
As I explained before why people like you come here, but you do feel the need to justify your reasons.
The reason religious cc nutters are allowed on this site is your so easy to be shown as false you have exactly convinced no-one
Well done.
“Considering you have pasted links to corrupted data thats not science”
I have pasted links to accepted science.
That you don’t like it is not their concern.
Nor mine actually.
Do you really think I think (or anyone) could change minds on here?
I may be a retired climate scientist but I’m not stupid.
The “with one bound he was free” “debating” tactic employed by many on here of “Scam” “Fraud” just makes things disappear down Lewis Carroll’s proverbial. There you leave me.
Now provide evidence of an ongoing large temp manipulation that makes even a ha’pth of difference to the GMST trend.
The odd justifiable adjustment to Darwin or any other single station on a planet of 510 million Km^2 of area, 73% of which is ocean, is just a strawman for you to obsess over.
Now have another go at me.
The whole site is full of data manipulation posts perhaps you need some one to hold your hand,
So are you going to take the opportunity to prove your credentials or not ?
YADA
If you say so
Anthony. Just like to say your posts here have made my day.
Thanks for the verifiable correction of this misleading article. And all without a single ad hom on your part.
CNN-Simon to the rescue!
Also YADA.
“I am a retired UKMO meteorologist who knows the science”
Wonderful, – the UK MO!
Ah, weren’t you in their service when they produced forecasts of stuff like BBQ summers, where for 6 years they managed to forecast the EXACT OPPOSITE of what actually happened with 100% precision??
Did you also get a golden handshake for abject failure???
And now you are giving people lectures in “fake news”, and “correcting their views?”
Surely you can’t be as brazen as that??
I presume you are referring to the misapplication of the technique of increasing precision by taking a large number of measurements of an unchanging parameter, with the same measuring device, to eliminate the random variations in the measurements.
Just as one only gets one chance to make a first good impression, one can’t make a second measurement of a non-stationary in situ temperature. Global temperatures don’t meet the requirements necessary for reducing measurement uncertainty. One can calculate the standard error of the mean, but it is inappropriate to do so for non-stationary time-series data.
Consider a time series that has a trend. That means that the mean and standard deviation changes over time. How can you logically claim a decrease in uncertainty when the mean value is changing with time?
Subtracting arbitrary averages from time-series averages does NOT reduce uncertainty, it increases it.
As Jed Clampett said, “They got more loose screws than a hardware store in an earthquake.”
That must get quote of the day award.
no el nino ; no record temps
Quite the opposite. Here is a record temp with no el nino.
Even today’s ENSO neutral years are way warmer than the El Nino years from only a couple of decades ago. This latest record warmest July temperature has come in ENSO neutral conditions and just off the back of a months-long La Nina. So, no.
Not Poppycock – shrivelled and wizenedcock making out it’s ‘something else’
Based on my little flock of English Wunderground Personal Weather Stations..
I too call ‘Bollox‘
The Data (God listen-up: I haz data. Do you trust me) ##
Average temps for July 2021 covering the last 20 years..
I tink that result from Lancs, rather suggests the The Heat is NOT accumulating in the sea. Certainly not the Irish Sea that’s fo’sure
## Am in da pub right now glugging Lime & Soda, I’ll be hit by lightning on my way home. Not for the 1st time in my life but wish me luck anyway, or not, as you feel appro
PS for God, its not NASA Fake Data I haz – so just a little tingle please if you feel you must
Paul, do not forget this site, Temperature Global – http://temperature.global/ – which takes over 60,000 stations all over the earth and runs the raw data to come to a global temperature reading.
Right now, TG is showing that the earth is -0.16 C below average.
Looking at their data, I think it shows July raw temp. to be -0.08F.
Forgot to mention they use the NBDC global Buoy report also.
I went to https://www.ncdc.noaa.gov/cag/global/time-series/globe/land_ocean/all/7/1980-2021 and saw a graph looking like the one shown above this link. Next, I tried changing the time scale from “all months” to “one month”. The results I got: The graph changed to indicate July 2021 was the warmest July on record. That would make this the warmest month on record even though previous months other than previous Julys have had higher temperature anomaly, because global absolute temperature is normally warmest in July, when the land-heavy northern hemisphere (which has greater seasonal variation than the ocean-heavy southern hemisphere) is warmest.
This sort of rubbish appears on many news outlets on a daily basis. You never see any data supporting their claims; it is all argument from authority. Scientists say, blah, blah, blah…
I don’t now how they are screwing around with that data but it shows mediterranian France “warmer than average”. It’s been the coolest summer I’ve seen in 25y down here.
So what average ? 20th c. average?
Of course it was!
and with record temperatures in Spain, Sicily and Athens over the last few weeks, indeed a new record for Europe, this is clearly climate change.
Without the extreme heat the fires wouldn’t be taking hold and spreading so fast.
We’ve now had heatwaves in E Europe/Russia (with tornado), 6 in the USA/Canada, including one setting record temperatures, heatwaves in Iran, right across the Med, Turkey, Lapland, Siberia and record temp in w Greenland.
not to mention flash floods in London, record flooding in Germany/Belgium/Netherlands, record flooding in China, new extremes of rain in India’s Western Ghats during the monsoon, and extreme rain and landslides across Japan
I don’t know how you have the bare faced gall to keep saying ‘it isn’t happening’ and/or ignoring this
Griff,
Human caused fires seem to be the main culprit. at least in Italy…
“ROME, August 14 (Reuters) – Italian police on Saturday arrested two farmers in Sicily on suspicion of starting recent forest fires to create pasture for their sheep, and said they were preparing another large and dangerous blaze .
Forest fires ravaged swathes of southern Italy this summer, aided by record temperatures, ravaging forests in Calabria and the islands of Sicily and Sardinia. Read more
Police in Syracuse, in southeastern Sicily, an area where temperatures reached nearly 49 degrees Celsius (120.2 degrees Fahrenheit) on Wednesday, said their investigations showed the men were responsible for at least two of a series of fires in the area in July.
“Their goal was to increase the grazing area for their animals with the stated intention of saving money on fodder,” police said in a statement.
Ecological Transition Minister Roberto Cingolani said at least 70% of forest fires this summer were started deliberately or recklessly. Police last week caught a man lighting a dry shrub in the countryside near Naples.
Authorities cite various grounds for arson involving forest fires, ranging from clearing land for grazing or construction, to insurance claims and even creating overtime for firefighters.
Police said their tapes of the two men’s conversations showed they were planning another fire on Sunday to clear a much larger area of land “with unimaginable consequences for the environment, public order and safety.”
From:
https://www.fr24news.com/a/2021/08/italy-arrests-two-sicilian-sheep-herders-for-starting-forest-fires.html
Strange that I could not find the story on BBC even though it came from Reuters!
TY for that now i understand why there is NEVER any fires in alaska, it is just too cold there for fire!
You dumb kluck, what you keep going on and on about like a broken record is clearly weather.
griff, the always “more warming” Artic and Greenland show an other behaviour:
Arctic seaice extend seems to be at it’s turning point:
https://seaice.uni-bremen.de/data/amsr2/today/extent_n_2021_amsr2_smooth.txt
ftp://sidads,colorado,edu/DATASETS/NOAA/G02135/north/daily/data/N_seaice_extent_daily_v3,0,csv
Not to speak about coming La Niña 😀
If you take a look at all years on the DMI site of Arctic temps, summer temps always remain hovering around 0C.
Do you know why?
How about a largely ice surface …. at OC – that is using up energy at 79x the rate that it takes to warm water by 1C.
It’s called a heat-sink.
Summer temps will not get above 0C until much less ice is there.
Now look at the winter temps this last 15 years.
Your Greenland graph Is the surface mass balance.
Not TOTAL mass balance.
It does not take into account melt/calving from glacier tongues.
Also you do know that for every 1C of temp rise an additional 6-7% of WV can be held in it?
So for the Greenland Plateaux, even in summer, that means (on ave) more snow.
More at the top. Melt at the bottom.
Yes, the Artic heat was unbelievable during 2021 I have to confess. 😀
Summer temps will not get above 0C until much less ice is there.
Not ? Look closer….. 😀
NASA’s Oceans Melting Greenland (OMG) project has revealed Greenland’s Jakobshavn Glacier, the island’s biggest, is actually growing, at least at its edge. In research published Monday in Nature Geoscience, researchers report that since 2016, Jakobshavn’s ice has thickened slightly, thanks to relatively cool ocean waters at its base—which have caused the glacier to slow down its melt
Source, despite further fearmongering
Gaia giveth and Gaia taketh!
Look at the July temperature plot above provided by Banton. See what is happening in Spain and France, and NW and NE Siberia, and Eastern US!