Guest “For once it’s not worse than previously thought” by David Middleton
But it’s still catastrophic… Because models…
Some Past Sea Levels May Not Have Been as High as Thought, Says Study of Rising and Sinking Landmasses
But Even Reduced Estimates, If Applied to Today, Would Be CatastrophicBY KEVIN KRAJICK | AUGUST 9, 2021
One of the current mysteries of climate science surrounds the widely accepted evidence that during the planet’s most recent past natural warm period, about 128,000 to 117,000 years ago, global sea levels peaked as high as 6 to 9 meters (20 or 30 feet) higher than today. And, during that so-called last interglacial, temperatures were just 1or 2 degrees C (1.8 to 3.6 F) warmer than those of preindustrial times—marks we may surpass by century’s end, if not sooner. Such a deluge could have been produced only by collapses of the Greenland and/or Antarctic ice sheets. If that happens now, it will drown much of the human world. Yet, at least so far, models of future sea level rise generally hover around a meter or so within the next 100 years. What are we missing, and how much should it scare us?
In a new study, a team at Columbia University’s Lamont-Doherty Earth Observatory believes they have an answer: They say that researchers examining signs of past sea levels along various coasts may have failed to accurately correct for long-term ups and downs of the land itself. Based on newly sophisticated measurements made across the Bahamas along with new methods of analyzing data, the researchers produced lower—though still daunting—estimates for the last interglacial. They say seas peaked at least 1.2 meters (4 feet) higher than today—roughly in line with most current models for the next 100 years of so.
[…]
They combined these findings with hundreds of different models of how glacial isostatic rebound could have traveled through the Earth, and converted the calculations into global sea levels. This produced the new, lower estimates.
[…]
Columbia Climate School
This is unmitigted horst schist:
They say seas peaked at least 1.2 meters (4 feet) higher than today—roughly in line with most current models for the next 100 years of so.
Sea level reconstructions over the past 100-200 years show sea level rising at 1.6-1.9 mm/yr.

Total sea level rise over that period of time is about the length of an Estwing rock pick

J14 starts 60 years earlier than CW11, capturing the falling sea level at the end of neoglaciation and the Little Ice Age. We can see that J14 and CW11 match up pretty well from 1880-1930 and then again from about 1993 onward; but they are very different from 1930-1993. J14 exhibits an acceleration to 3.2 mm/yr from 1929-1963 and then a deceleration to less than 1 mm/yr from 1963-1993, after which it accelerates back to about 3.2 mm/yr.

Jevrejeva et al., 2008 (J08) and Jevrejeva et al., 2014 (J14) indicate that the acceleration, to the extent there is one, started 150-200 years ago, consistent with the end of neoglaciation and that a quasi-periodic fluctuation (~60-yr cycle) is present. Church & White, 2006 (CW06) and Church & White, 2011 (CW11) also note the 19th Century acceleration; but also assert a more recent acceleration, presumably due to anthropogenic global warming. This SLR acceleration is, at worst, innocuous.
If this acceleration was maintained through the 21st century, sea level in 2100 would be 310 ± 30 mm higher than in 1990, overlapping with the central range of projections in the Intergovernmental Panel on Climate Change Third Assessment Report (IPCC TAR) [Church et al., 2001].
CW06
310 mm from 1990-2100 is less than 3 mm/yr… Not much of an acceleration and a far cry from being 1.2 m and “roughly in line with most current models for the next 100 years of so.”
Short of Doctor Evil suddenly melting the Greenland ice sheet with a “space laser,” it would be physically impossible for sea level to rise another 1.2 m over “the next 100 years of so.”
For sea level to rise by 850 mm by the end of this century, it would have to accelerate to a rate of ~20 mm/yr from 2081-2100. This is nearly twice the rate of the Holocene Transgression.

Sea level rose by about 100 m during the Holocene Trangression.

(Siddall et al., 2003)
That catastrophic sea level rise, including the Meltwater Pulse 1A boogieman, occurred at a time when Earth had a lot more ice to melt than it does now.

Fun with sea level
Here’s J14 plotted at the same vertical scale as the Statue of Liberty…

References
Church, J. A., and White, N. J. ( 2006). “A 20th century acceleration in global sea‐level rise”. Geophys. Res. Lett., 33, L01602, doi:10.1029/2005GL024826.
Church, J.A., White, N.J., 2011. “Sea-level rise from the late 19th to the early 21st Century”. Surv. Geophys. http://dx.doi.org/10.1007/s10712-011-9119-1.
Jevrejeva, S., J. C. Moore, A. Grinsted, and P. L. Woodworth (2008). “Recent global sea level acceleration started over 200 years ago?”. Geophys. Res. Lett., 35, L08715, doi:10.1029/2008GL033611.
Jevrejeva, S. , J.C. Moore, A. Grinsted, A.P. Matthews, G. Spada. 2014. “Trends and acceleration in global and regional sea levels since 1807”. Global and Planetary Change. %vol 113, 10.1016/j.gloplacha.2013.12.004 https://www.psmsl.org/products/reconstructions/jevrejevaetal2014.php
Siddall M, Rohling EJ, Almogi-Labin A, Hemleben C, Meischner D, Scmelzer I, Smeed DA (2003). “Sea-level fluctuations during the last glacial cycle”. Nature 423:853–858
Uh Oh….
SMB is surface mass balance. It is different than total mass balance which includes calving and melting on the perimeter which is not included in the surface mass balance. Since 2002 Greenland’s TMB has declined at a rate of 293 Gt/yr.
Source: GRACE & GRACE-FO
The surface mass balance data for the Greenland Ice Sheet from the Danish Meteorological Institute shows that over the past five years, the surface of Greenland has averaged a gain of about 400 billion tons per year, which is slightly above the 1981-2010 mean.
https://realclimatescience.com/2021/02/greenland-a-new-study-says/
Surface Mass Balance is just the difference between precipitaion and runoff. Warmer atmosphere means more precipitable water = more snowfall. bdgwx’s graph is for the Total Mass = a steady total loss for decades now. So no, Greenland is not gaining ice mass its losing ice mass.
With that zombie myth smote for the hundredth time this where the goal posts usually get shifted to: “so”.
Nope. You’re always wrong.
Your source says MB = SMB – D where MB is the total mass balance, SMB is the surface mass balance, and D is the discharge across the grounding line.
You’re still deluded. The planet is doing just fine. We don’t need you.
A record of wrongness almost sufficient to rival Joe Biden!
Biden is a damned hard act to follow … “Myassiswiped!”
With regard to ALL ice mass gains/losses, so f***ing what? We have been here before, even if the Arctic goes completely ice free for several years on end, again, this Earth has already done that, came through it and out the other side just fine, what’s the problem?
That’s right. SMB is about +400 Gt/yr. That means D, the ice discharge across the grounding line, is about -660 Gt/yr. Note that MB (mass balance) is equal to SMB (surface mass balance) minus D (discharge) or MB = SMB – D. Also note that D has increased faster than SMB in recent years meaning that MB has declined at an even faster rate. I recommend reading the publication cited in your link. The direct link is here. In addition to saying exactly what I just said above and corroborating the graph I posted it also says that in the not too distant future the ice sheet will become fully grounded (D = 0) while the surface mass balance will turn negative (SMB < 0). Under the RCP8.5 scenario this could occur as soon as 2055.
I disagree.
You disagree because CO2.
You disagree with your own source?
Not much better than the ‘Central Park’ metric. It would be more informative if it showed the percentage of total ice mass compared to 2002.
Central Park? Another non sequitur statistic. They could have gotten a much bigger number if they had said something like “cover all the sidewalks in Central Park.”
Here we go, now that I have scrolled past the “Peak Oiler” (what’s the matter, afraid
Global Warming, Climate Change, Weather WeirdingCAGW is publicly dying a horrible death and test marketing new scares?) nonsense and the intelligent, accurate, but useless responses, let’s see if we actually have a discussion here!Being innumerate is a requirement for being a green, as well as buying into worst case scenarios.
Having Asperger’s isn’t a requirement either, but it certainly helps.
Ad Misericordiam (appeal to pity) … works every time, especially in a world dominated by intersectional politics. Being underage an female also helped.
Good posting of sea level reality, David. I’m still hoping that some black gold geologist adapts Exxon’s Sequence Stratigraphy to show world-wide mega sea level cycles, with the sea level extremes setting the standard for what the normal background is. Keep up the good work (and try to ignore “peak oil”).
Average Eemian temperature at its peak was more than 1.8 degree C higher than in AD 1850. Forests grew all the way to North Cape (above Lat 71 N), now tundra, and hippos swam in the Thames at London.
Is that where the name “Hippodrome” came from?
Well, no.
Hippo just means horse, potomus is a river (like Potomac). Hippopotamus is just a ‘river horse’.
TBH, whoever decided on that name either hadn’t seen a hippo, or hadn’t seen a horse.
I believe Michael was attempting a wee bit of English levity.
Do you have any idea how tiny the amount of CO2 used for EOR is compared to the total amount being emitted?
Innumerate as well as delusional.
Then again, what’s new.
Now that you showed the 2019 forecast, do 2021 and following.
One real chart, overlain by 5 imaginary ones.
That impresses you, but then everything you invent impresses you.
At 2018 consumption rates, the US has a proven 250 YEAR supply of oil.
Green river shale formation.
I guess that’s a peak, in a few centuries or so…
They are so depleted that they continue to pump out huge quantities of oil.
Earlier, actual:
It’s got tides, right?
Yes, that’s why the older picture has an higher level 😀
At least it seems to be so.
But on the other hand, there are so many pictures if you compare them, the differences are minimal, in both directions.
Looks to be a 5 foot maximum tidal movement. About the height of some of the people lining the shore fence.
So most pictures appear to be taken on a slack tide to keep the photographer from bouncing about from currents.
https://www.sciencedirect.com/science/article/pii/S2468013320300474
NYC is sinking due to Canada’s rebound from its lost ice sheets, so the Harbor’s real rate of sea level rise is minimal.
Been reading AR6 on and off throughout the day.
One of the weird disconnects is that they report that – worst case from the measurement errors – sea level would rise by a foot (30cm) in the next 100 years if the current trend continues.
But they predict at least 1m (over 3ft) in that time. Best case!
It looks like they have got their units muddled halfway through.
BTW, Am I the only person bothering to review these 4000 pages?
I’m only on page 120 (have a real job) yet no-one else seems to be posting anything on this thread:
Discussion thread: New IPCC AR6 report
Come on. Help out. At least read my comments and point out my mistakes.
Let’s crowd-source this.
You caught them out. There is a more basic problem in both the SPM and the TS. They manufactured SLR acceleration by splicing ‘not fit for purpose’ satalt onto tide gauges. I have done several posts here on SLR and the satalt problems and the closure issue, with references. The IPCC AR6 is just provable propaganda. And was so years before this new junk was published. They made no attempt at all to cover their previously exposed nonsense.
Dear Scar Filling-Cracker,
Oil has not peaked. Demand has fallen temporarily because of the pandemic. That’s all.
Besides, coal releases far more CO2 per joule. And there are lots of new coal plants being built by China, India and much of the developing world.
So this blog is not obsolete.
Best Regards,
M Courtney
Anthracite yields almost twice as many BTUs per pound than does lignite, the heat content of which is barely more than peat. Yet China is burning its crummy, soft brown, real polluting, low energy, high sulfur, high CO2 coal because the CCP is angry with Oz. And US Greenies won’t let them buy US hard black coal, because CO2!
Oregon stopped export of Rocky Mountain coal by banning “death trains” from Wyoming and Montana to the Columbia River.
The coal is transported to Canada, then shipped to China.
And it’s funny cuz Extinction Rebellion regularly shuts down Vancouver bridges while the US “death trains” go unimpeded some 20 minutes south, but a little out of range of the news cameras.
When they start to freeze, those will be called ‘life trains’….
Thanks to enhanced CO2 supplies, supplies of food are exploding.
And this just in, Mark:
The article, which was written by the Associated Press, appeared in scores of newspapers around the country in November of 1922.
“The Arctic Ocean is warming up, icebergs are growing scarcer and in some places the seals are finding the water too hot, according to a report to the Commerce Department yesterday from Consul Ifft, at Bergen, Norway.”
“Reports from fishermen, seal hunters and explorers, he declared, all point to a radical change in climate conditions and hitherto unheard-of temperatures in the Arctic zone. Exploration expeditions report that scarcely any ice has been met with as far north as 81 degrees 29 minutes. Soundings to a depth of 3,100 meters showed the gulf stream still very warm.”
“Great masses of ice have been replaced by moraines of earth and stones, the report continued, while at many points well known glaciers have entirely disappeared.”
“Very few seals and no white fish are found in the eastern Arctic, while vast shoals of herring and smelts, which have never before ventured so far north, are being encountered in the old seal fishing grounds.”
And yet, you are the only one who has noticed.
Are you ever going to explain that made up word of yours?
Don’t look now, but the number of wars is way down.
Food supply peaked in 2010. No it didn’t. From this page you can select any country on the right and then any crop from the list on the left.
https://www.indexmundi.com/agriculture/
You should check it out maybe you’ll learn something for once but I doubt it.
No they don’t, here are just three examples.
https://www.indexmundi.com/agriculture/?country=au&commodity=corn&graph=production
https://www.indexmundi.com/agriculture/?country=au&commodity=beef-and-veal-meat&graph=production
https://www.indexmundi.com/agriculture/?country=au&commodity=centrifugal-sugar&graph=production
Even if true, 2013 is after 2010, which would be enough to refute your claims.
Which I won’t read. I did a deep dive on peak oil in parts of now now three published books. I suggested you read them. You obviously haven’t.
Peak is before us, not behind us, thanks to fracking. And peak is a misnomer given the delta slope of the ‘peak’ production curve.
My own well documented peak estimate is about 2023-2025 or so. But it will hardly be noticed. ‘Peak’ is NOT a Cliff or even a log normal or a logistics curve (original Hubbert hypothesis) probability distribution event. It is a gamma distribution event with a long slow tail. As shown by illustrated North Slope and North Sea post peak production declines in the books you did not read. Be gone, please.
Name one year (other than wars) where living standards have not increased.
Why are oil businesses so poorly run that they make money off shale?
GOM must be a translation of “Whooooosh!” into Mark-speak, meaning “Goes Over Mark”.
Everyone else in the world see’s rising standards of living.
You see it falling.
Obviously, everyone else is wrong.
Yet another example of ingraham seeing what he wants to see, not what is there.
Small scale conflicts and growing standards of living are not incompatible.
If you think terrorism is caused by resource conflicts, then you have never left your mom’s basement.
Another made up chart, probably from his own blog that shows nothing whatsoever.
While the Hubert curve is technically correct, it can be and often is reset by new discoveries and improved technologies for drilling and extraction.
It’s possible to win an argument with someone who is smart, it’s impossible to win an argument with someone who is stupid.
I wasn’t talking to you, I was talking about you. I feel that if I communicate with you any further, my mental health will suffer.
He is quickly becoming as annoying as griff and Loydo of London, but for different reasons. I home he tires soon.
These people have few brains. They are fixated on one thing and won’t let it go. I had prepared my response to his comment at the same time I posted my comment. They are so predictable.
Mark I. isn’t even as coherent as ELIZA was. Someone needs to up their coding game.
I haven’t seen you do any physics whatsoever. Unless that’s what you call naked assertions.
Combining unrelated things into one master equation that explains everything.
Even if you could justify your assumptions, they still wouldn’t amount to an actual argument.
Here is your fail:
“The Permian basin produces five percent of global oil in 100,000 square miles. That implies 2 million miles or 2% of world land area is used for oil, and a similar amount for other energy. Furthermore, if we extrapolate first world living standards, that would require as much as 25% of the global land area just dedicated to oil wells.”
Because we don’t have offshore wells, and many places with big reserves need far less than 1% of the land dedicated to oil. For example, here in Ventura, Los Angeles, and Santa Barbara counties. Where we produce prodigious amounts of oil (more than Alaska) on something approaching 0.03% of the land (typical pad is around 1/2 acre, including tanks, and you’ll see a pad about ever 150 acres).
I just have to say:
What the F*&K are you smoking?
You do realize, don’t you, that about 80% of our total energy use is from oil and coal right now:
https://www.eia.gov/energyexplained/us-energy-facts/
And we’re not using 25% of our land for oil wells and coal; in fact we’re probably using hundredth of 1%, if that.
You’re just way out to lunch, making things up to push some insane, inane drivel.
i thought we hit peak oil back in 1970’s? Ingraham is a troll… like griff
I see you are still trying to convince yourself that the only thing that matters in terms of economic activity is how much oil is being produced.
It’s not accurate, but I can see that you desperately wish it to be.
If the only thing that drives prosperity is oil, what drove prosperity before oil?
So if products get more efficient and less energy is used, that proves that standards of living are falling? Pseudo intellectuals always use this type of one dimensional thinking.
I can’t think of any place in the world where food supply is falling.
For most of the world, over eating is the big problem.
Ah yes, shale is so useless that oil companies are making billions from oil plays.
A post from his blog, to prove that he agrees with himself.
Yea we know, there is so little oil there that they ran out years ago.
Instead of sniping, why not submit an article to WUWT detailing your hypotheses?
MI will not, because if he did, my three past ebooks on this topic (and others) would shoot him down in flames. In fact, I am almost motivated to do a guest post on this issue to preempt him and enlighten those here.
There are no such articles in the major media. Articles on your blog do not count.
Hahahahahahaha!
The real reason trollop-bot mingy haunts WUWT is because he is desperate for visitors to his irrational illogical delusional “blog”
Hahahahahahaha!
Pathetic sod.
But Ingraham has proven, using physics no less, that all the oil has already been used up.
Did someone say “peak oil”?
Canada posts surprise $3.2B trade surplus in June as oil exports surge
The moderator posted two of your “submissions”, they were just cut and pastes from two of your posts.
Neither made any sense.
4 articles, written by you, do not qualify as “many media articles”.
@Mark ingraham: “I gave my reserve estimate on my blog.”
–
Have you been banned there? Is that why you’re here?
If someone could be banned from their own blog… 😆
His mommy changed his password.
Gol-ol-lee Sar-gent Carter!
Yeah, and Malthus wrote an entire book on “…peak everything…” How did that turn out? Combine some fevered visions with a health dose of reality and get back to me when you got something that coincides with both.
“They say seas peaked at least 1.2 meters (4 feet) higher than today—roughly in line with most current models for the next 100 years of so.”
The up 9 meter was fairly new estimate. I believe as recall for a long time it considered to less 5 meters of sea level rise.
Then go away since you have deemed it irrelevant!
https://www.eia.gov/dnav/pet/hist/LeafHandler.ashx?n=PET&s=RCRR01R1901F_1&f=A
The R/P ratio is ~8 years. It goes up and down, but it’s averaged ~8 years since the early 1980’s.
> 50 billion is all that will fit.
(Assuming that’s barrels.) 50 billion barrels a cube less than 1-1/4ths miles on a side.
Of all the stupid things I have seen you write, that has got to be the stupidest.
You’ve been down there to check?
The oil was in the rock when it formed, it made it’s own space.
You can’t even keep your promises.
Basement dwelling lying delusional trollop-bot.
His respected career is in all facets of finding and drilling oil.
He’s earned real money for his education.
What have you got besides lies and BS?
Screaming you’re wrong, is not a refutation.
50 billion is all that will fit? Really, so you are an expert geology, as well as every other subject under the sun
So all rocks have the same pore space?
Of course none of those references actually reference the point you are making, much less prove it.
Ingraham invents new words and new concepts in order to find something that he can claim supports the voices in his head.
Up vote just for the Tombstone ref
Greatest movie ever made… I named a series of prospects in an old shelf field Wyatt, Curly Bill, Doc and Kate… Brought the production nearly back up to the field’s 1986 production rates… “I’m your huckleberry”… 😎
You do understand that if Shell divested its GOM assets, it would be the buying opportunity of a lifetime for us independents… Right? (Yes, asking a bot rhetorical questions is pointless).
Unfortunately for us, Shell still views most of its GOM portfolio as core assets.
In 25 years we’ve extracted more oil than was all of the “proven reserves” 25 years ago and now we have twice as much “proven reserves” as we had then.
If the oil companies are lying about their proven reserves, then somebody is going to jail.
Why don’t you take your “proof” to the justice department.
Projection alert.
1) That comment makes no sense.
2) That comment in no way addressed the point that I made.
“if he proves my GOM reserves wrong (which are the same as official)”
A) Official does not mean actual reserves or anywhere near actual oil deposits.
B) All of your specious bleating is because you ‘think‘ your official Gulf of Mexico reserves are accurate? Hahahahaha
a) An estimate that ignores a substantial portion of the Gulf of Mexico.
b) An estimate that ignores sedimentary basins worldwide.
c) An estimate, which is all the “official” reserves are. A statement that ignores the historical failure of estimated reserves over many decades.
Ingraham is the smartest person who has ever lived. If you don’t believe me, ask him, he’s already proven it.
Except for a little math error.
Made up numbers generated by made up theories.
You really do need to upgrade the voices in your head.
The climatariat myth that the Eemian highstand above today was caused by WAIS sudden collapse has been debunked several times before Dave Middleton did here. The most detailed study estimated about 3000 years, giving a SLR rate between 2 and 2.5mm/year, as now. And, the only two papers purporting to show ‘sudden’ are both gravely flawed. They also disagree with each other on ‘sudden’ timing by several thousand years. OOPS.
The Australian ‘sudden’ paper also comprises clearcut academic misconduct, provable from its own SI. All three references and the misconduct proof are contained in essay ‘By land or by sea’ in my ebook Blowing Smoke.
Wrong again!
https://www.reuters.com/business/energy/us-crude-output-decline-less-than-previously-forecast-2021-eia-2021-07-07/
“This blog is entirely obsolete because oil production is falling.”
You were saying how you could buy it yesterday. Changed your mind?
This blog should be obsolete, because there is no climate crisis, no climate emergency, no measurable increase of temperature or sea levels above the background slow increases from the Little Ice Age. This site, however, does have a part to play in correcting the lies of climate liars and other assorted climate crackpots, and other individuals who post strange stuff.
Just a few days ago, you declared that it’s conservatives who agree with you and only liberals disagree?
Did the voices in your head change their mind?
You can’t even remember what you said less than an hour ago, and is still on the screen in front of you.
Maybe we should treat him kindly, like a gentlemen holding the door open for an old woman with a walker. I’d be the first to run to the exit door to let him out.
It’s hard to follow your train of thought on base assumptions when you don’t say a) what they were and b) what they changed to.
The base assumptions of climate realists, who can understand data, are very different from those of the climate liars and climate crackpots and nitwits who can’t or don’t want to.
…. but do go on – two doublings of CO2 gets us to around 1700 ppm via one doubling to around 850 ppm. When are we going to see the Keeling Curve reverse?
OK, joke over. You reeled some of us in. Well done.
philincalifornia,
Markie’s train of thought is more like a pushcar with some of the gearing stripped out!
It’s more like a baby stroller, and somebody left the baby at home.
You know people like you told us older folk that we would be out of oil 30 years ago. Funny I was once able to buy gasoline at 25C a gallon. Yet that was not the cheapest gas I bought due to inflation and and increase of wages about every other decade the true cost of refined oil is lower than that. I may not live long enough to see that but my grand children will and they will have plenty of oil to burn. The world is coming to end idiot have been around as long as the human race has. You are no different that the snake oil salesmen of the past.
Most of the time, it’s been liberals annihilating others.
I can’t think of time when liberals have been annihilated. Unless it was by other liberals.
We knew this was coming. Rewrite sea level history just like they did 20th century weather history in the US. As with all history today it is being either altered or interpreted to suite a narrative. The “new” history will be Marxist written, controlled, and it won’t take many generations before it becomes ‘truth’.
Don’t be so pessimistic. They didn’t have the internet then. Screencap as much as you can be bothered to screencap. Whatever the climate liars, climate cretins and climate crackpots can choose to disappear will still exist on multiple thousands or more hard drives
Personally, based on my study since 2006 of this whole matter, I am far more worried about the coming ice age and associated eventual sea level fall than I am about sea level rise and further warming.
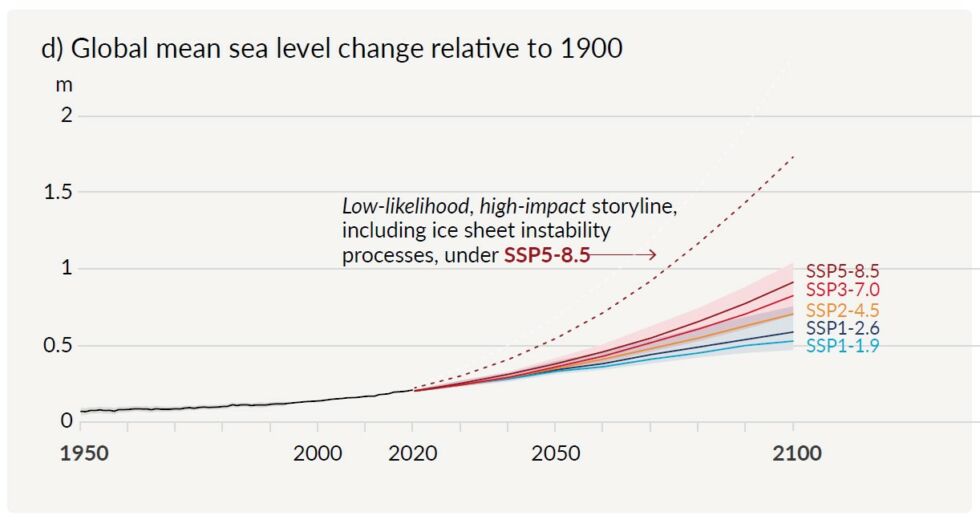
It is interesting to watch how the inflection point from linear to exponential on IPCC ‘scenario’ graphs (sea level) creeps along the time axis from report to report.
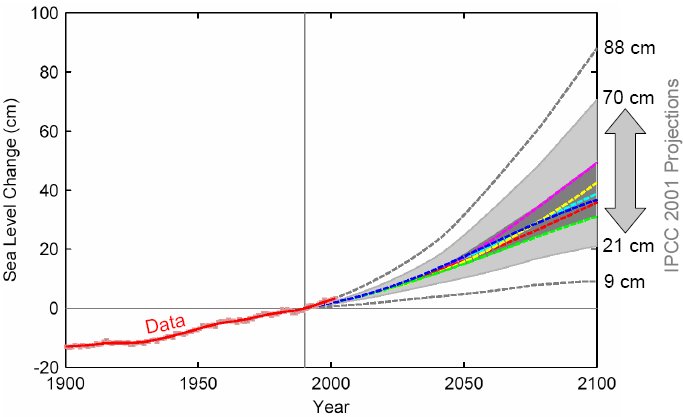
AR3 (2001):
AR6 (2021):
I don’t see that.
Especially considering the 2001 graph has the y-axis at more than twice the scale of the 2021.
Also, what do you consider as the “inflection point”, especially as the observations are already at a quadratic fit?
Objections addressed here ….
https://climatefeedback.org/claimreview/global-data-contradict-claim-of-no-acceleration-in-sea-level-rise/
Run away … this is indeed serious. They’re now forced to measure by the dreaded Estwing rock pick. How could it ever have come to this? Not a mere Vaughn, Fiskars or Allied, but they’ve gone straight to Estwing.
It’s a common measurement tool for geologists, almost a standard. Some even come with a striped handle to make it easier to identify inches.
That said, my sister, while still an undergraduate at NMIMT in the early ’80s, told the whole family of a photograph the TA showed them where he had taken a toothpick and something, made a miniature rock pick complete with stripes on the handle, and laid it next to a diminutive trilobite fossil he had recovered, making it look like a trilobite close to half a meter in diameter. He was very upfront about it being a faked photo, don’t take it seriously. He probably would be run off campus if he tried that maneuver today.
Arrrgh … killer trilobites! It’s worse than we thought.
It’s kind of funny that geologist’s rock pick measurement is actually a real thing (unlike Xs Olympic swimming pools).
I thought you said you wouldn’t mention peak oil until someone else did?
I guess that’s yet another thing you can’t get right.
He lied?
I am shocked.
This blog isn’t obsolete. It has only reached peak Mark Ingraham.
I gave that a like, even though I suspect it’s not true.
Oooops, I must have lied … (exaggerated?). Declaring peak anything without any evidence is usually a lie.
Mea culpa … wishful thinking.
But, it was funny anyway!
I’ve noted a coastal “bench and notch” in Dominican Republic that is 1.5 to 2m above mean sea level. I had assumed this was from the Holocene High Stand. An old coral reef up by my place is about 10m above present sea level. I had assumed this was an Eemian coral.
I notice that a lot of places, at varying distances above sea level. For example this http://a.abcnews.com/images/US/HT_HouseCliffs06_jrl_160126_12x5_1600.jpg (to find that pic I searched “California washing into the sea”) doesn’t that look like the kind of flat silt deposit that would indicate a previous river delta, where the flat is just slightly lower than the existing sea level at that time? In other words, the sea level rises, the sea level falls, about the only thing it doesn’t do is remain static for an extended period.
“This blog is entirely obsolete because oil production is falling…..”
Anthony and CTM:
This is just my opinion, but I think Ingraham has gone over the top here on two counts: (1) insulting the integrity of this blog and, (2) going off topic with his peak oil blather again.
Just my two cents worth.
More evidence that you either need to be SNIPPED or banned. Keep it up Ingraham and it might yet happen. What happens to CO2 levels isn’t so much the issue as is what happens to temperatures in the future.
If this is how your parents taught you to behave with others, they fell way short of their duty to raise you properly.
(1) As I understand it, the only place where CO2 drives temperature is in the computer models and in the minds of those who believe in them. The evidence does not exist in the real world,
(2) There are natural sources of CO2 over which we humans have no control. Not the least of them is the outgassing of the world’s oceans. The COVID lockdown did not produce even a blip in the CO2 level rise record.
Mark, oil consumption is not the only source of human CO2 emissions. Coal, natural gas, cement, etc., are others. The environmental movement will never be happy until ALL human fossil fuel use has ended and ALL human emissions have stopped.
Until ALL emissions from human activities have ended, the eco-warriors will never cease their attacks on human activities that they deem to be vices. As long as they have the mass media, corrupted science, the U.N. and domestic politicians under their thumb, they have no reason to give up “The Cause”.
Heck Mark, we even exhale CO2 when we breathe. Did you know that? Are going to have to wear carbon sequestration masks over our faces? I’m sure that idea will go over well.
Coal consumption barely growing?
Mark, if you’ve been following this blog for any length of time, you should know how many coal-fired power plants have been built throughout Asia (especially China) and elsewhere around the world in the last 10-20 years. And many more are in the pipeline.
Sorry Mark, but I am at a loss to understand where you are getting your information from.
Maybe from griff.
Ingrown, Coal consumption worldwide has been fairly flat for about 10 years. It has NOT dropped dramatically – IT IS HAS BEEN ABOUT THE SAME for the last decade. How could this be when Asia’s coal usage is actually up substantially. It’s because in the US and much of the rest of the world, coal consumption has dropped – in the US it’s because coal has been replaced by clean Natural Gas. That’s why US CO2 emissions have dropped.
https://ourworldindata.org/grapher/coal-consumption-by-region
What does that mean? Coal consumption is still adding to the atmospheric load of CO2 – it’s a significant component in why CO2 is rising.
Oil consumption, other than the Covid dip, is also rising.
It’s clear that you’re perseverating on a paranoid delusion. Seek mental health care
According to ingrown, that dip starting around 2019, is proof that we have run out of coal. That dip will continue and in a few months it will hit bottom.
He’s proven it. He has math.
Oil production follows demand. When demand picks up, so will production.
So you know more about real coal prices then the guys who buy and sell the stuff.
Nonsensical articles from undisclosed blogs may impress you, they don’t impress those who can think for themselves.
I’m going to go out on a limb and guess this gibberish is from your blog. It sure does sound like the way you (don’t) think.
Another irrational specious claim.
History and historical graphs clearly show CO₂ lags temperature, always.
Cooling will come first and slowly over years, atmospheric CO₂ will decline as water absorbs greater amounts of CO₂ while emitting less seasonal CO₂.
You’ve been on both sides of so many issues that it’s hard to remember what your most recent position has been.
Tell China, India, Africa & etc. that CO2 levels are about to fall.
We need a block capability on this blog so we don’t have listen to an idiot all the time. 🤦♂️😒 I feel like I’m listening to a flat earther with the level of idiocy projected.
At the bottom right of posts with responses to them, once the edit button expires, there’s a little up arrow that allows you to collapse all responses to a post. Not quite a block, but it allows you to make thread jacks go away.
This blog currently insults the integrity of itself, if co2 levels are about to fall then what are you going to talk about?
But but … CO2 levels cant fall, that’s no fair.
Anyway CO2 stays in the atmosphere for 16 no 100 no 2000 years – no forever
CO2 stays in the atmosphere for [compute number needed for maximum alarm and political capital] years.
MODS: Please block Mark ingraham. He has completely hijacked the thread with his inanities and added nothing. This is beyond acceptable.
Mark Ingraham is still here so this blog is still very much needed! Thanks Watts, Middleton, Willy E., Charles, and everyone else that I stupidly forgot! Thanks for not letting us drown in a sea of BS!
The ice core data shows much more than 1-2C between the last and even the peak of the current interglacial.
http://www.palisad.com/co2/domec/temp.png
The above plot is from the DomeC data. The dotted blue line is the current temperature at a reference of about 0. The temperature scale is delta degrees C from today.
The suggestion that Greenland or Antarctica collapsed is silly, as the ice is still here to tell its story and a collapse of either is not in that story. Even the worst case temperature increase the IPCC projects will not touch Antarctica whose average temperature is far below 0C and at an altitude where even ice and snow is found at the equator. Greenland isn’t much different.
** STOP FEEDING THE TROLL **
Mark ingraham makes griff look like an intellectual !!
I skip over comments directed at griff and Ingraham. Often it seems like half the comments. griff is more on the rails than Ingram. I second the motion. Taking topics hostage is what they do, especially on sore point topics for the climateers.
Yeah stop feeding them.
The blog software would benefit from a block function.
Griff disagrees with this blog and isn’t well-armed with facts.
But he seems to be sincere and relatively polite by internet standards.
And he addresses the blog in question.
Griff is no Mark Ingraham. Griff should not be banned.
Mark Ingraham needs banning and counselling.
Declaration of interest. If this blog bans Griff it will no doubt ban me as well on ideological grounds.
I agree 100% about Griff.
Regarding Mark Ingraham, maybe I just need to write a detailed post about petroleum geology, how resources and reserves are estimated and the exploration/exploitation of the Northern Gulf of Mexico. This way 90% of his bizarre comments will go there. If I toss in an occasional lunar geology post, it will accommodate the other 10% of his comments.
🤪
Mark is to logic the same as loud bagpipe music is to a successful deer hunt.
PaulD: “Mark is to logic the same as loud bagpipe music is to a successful deer hunt.”
–
👍 👍 🤣 🤣 🤣 🤣 🤣
To paraphrase Nathan Hale, “I only regret that I have but one upvote to give to that comment.”
I couldn’t shoot a deer unless it hit my Jeep and I like bagpipes… Maybe that’s why I’m an AC/DC fan… 😉
Yes, let Griff remain, as well as Nick Stokes (I disagree with their conclusions most of the time, but at least they’re willing to debate and discuss why they believe their own position). As with all posts, if we can’t defend it, we shouldn’t be writing and posting it.
Sea levels can fluctuate quickly
6500 and 4200 years BP sea levels were 1 to 2m higher than today-
https://www.jstor.org/stable/25736969
https://journals.sagepub.com/doi/full/10.1177/0959683618777070
Only a bit of anthropogenic CO2 about then and what were the ice, polar bears and penguins doing?
If you think this blog is obsolete, why don’t you just bugger off, and let the rest of us wallow in our obsolescence?
Thank you and have a nice day.