This is a discussion thread for ideas and points related to the just released IPCC AR6 WGI report:
https://www.ipcc.ch/report/ar6/wg1/
Your thoughtful and detailed comments will be helpful in forming future stories on WUWT about the report.
Also, on Twitter, Dr. Roger Pielke Jr has a series of tweets, that is well worth your time to read.
Of course, there’s lots of gloom and doom headlines in the media, which is pretty much how they treat everything these days. For example, the ever-predictable Seth Borenstein with AP never fails to disappoint:

Laughable….
Due to the seriousness of the situation, air travel should be banned immediately for all UN officials and personnel. Back to horses!
They can travel by sailing ship on dock on the East River.
Perhaps it should be referred to as the
Hexad
Assessment
Report
HAR har har
AR six or ARS for short.
ARSExtended
IPCC’s ARS stink
Better yet Back to their Homes!
DeBLAHCEO could turn the UN Building into Public Housing for illegal aliens and Cumo could order covid patients released back into UN housing.
But horses fart. They’re going to have to walk. Or swim.
Swim — carrying an anvil. In their teeth. The only thing more useless than the UN is the EU.
Gutteres could do with some walking
do they really deserve horses?
Let them use Skype
Just heard CA governor saying ‘this is climate change (not global warming) induced fire.
Do you wonder why you never heard of huge wild fire in parts of China or southern republics of Russia which in the summer moths get hot just as much as the northern California does. Well, if you started a forest fire there intentionally or accidentally you know consequences may not be exactly pleasant.
CO2 might be contributing somewhat to the fires, but global warming – not so much.
CO2 – as we all know – is plant food. With more CO2 available, plants are growing more and piling-on the pounds in the form of more trunk, branches and foliage – i.e. fuel for fires.
But global warming? – not so much. What global warming anyway? Thanks to the recent La Nina, the globe has actually cooled considerably in the past year. (California might be hot, but – sorry to break it to you – California is not the whole world.)
Sorry to break it to you, but to people who live in California, California is the whole world. It’s an entitled mindset unlike anywhere else in the US.
CO2 extinguishes fire. It cannot contribute to it.
“Your thoughtful and detailed comments will be helpful in forming future stories on WUWT about the report.”
I figured Anthony’s request wouldn’t be honored.
Ric-
It is too bad that you are correct. I just spent half and hour perusing the summary for policy makers, I figure it would take me about 4 to 8 hours to understand and check what the data for the statements actually said. I doubt if any commenter in the first 2 or 3 hours had even looked at the report.
Hopefully there will be serious comments after about 24 hours.
with respect, if we get lost in the weeds of this report – which is the intention – we cede the ground to the (utterly thoughtless but fear-porn) spin, which takes no ‘thoughtful’ prisoners. As this is the 6th iteration (on steroids) of the IPCC I was hoping we ‘dissenters’ (‘denialists’. pick your playground epithet from the thoughtful side) might have learned something…
Thank you for saying that. I was getting depressed at the quality of the comments I was reading.
https://climateaudit.org/2021/08/11/the-ipcc-ar6-hockeystick/
Steven McIntyre quickly breaks the latest hockey stick, having already demolished the underlying bogus, contradictory “reconstructions”.
Possibly doesn’t fit in the “thoughtful” category, sorry, but Seth Goebbelstein truly has become among the worst of the worst climate liars and propagandists. He really should read the last part of the Wiki entry about his hero Joseph (let’s not even get into the irony of this).
Two degrees above Little Ice Age temperatures and we should all sh** our pants and give tithes to our moron superiors to get us back there. How TF did we get here?
Someone put the Loons in charge of the Bin
Correct me if I’m wrong but wasn’t the earth warmer in the distant past? And CO2 levels higher?
Yes and yes.
We presently live in an ice-house climate. Over most of geological history, Earth had no ice caps.
How can it be taken seriously after their own scientists came out in Science Magazine and other journals admitting the models are way too hot, just weeks ago? How can that confession had been a coincidence?
but it isn’t about the models, is it? It is about the physically observed, already occurred heating and the actual here and now serious climate impacts…
“serious climate impacts” [Snip], do you have a cardboard sign with that drivel written on it? Makes you feel better because you can fake virtue-signal.
Every time “serious climate impacts” make the headlines, the fact that there is no change due to carbon dioxide is explained on here, and you read it. So stop lying and give us your Arctic sea ice, and Antarctic sea ice report and explain how the heating is causing that data.
….. and while we’re at it, why hasn’t the destruction of the UK countryside with your stupid-ass wind turbines had any effect on these so-called climate impacts? [Snip]
Leave the name calling and insults out. -mod
Hey, don’t be too hard on Griff. He actually brings to the forefront misconceptions that need to be disputed intelligently. Calling him names only reduces your own impact.
I’d agree with you if the Grifter hadn’t disparaged personally Dr. Crockford, a real scientist.
Yes, I’m sure many of us would treat our pet troll better if he admitted that error and apologized
Which he has never apologized for. Some things are hard to forgive.
Griff is the wrestling pig, and he knows how get everybody riled up with inane comments
The thing about Griff’s comments, is they are the same kind of inane comments made by all the other alarmists of the world. None of them are fact based.
Ridicule is the most effective form of disinfectant.
But, we now have to do it subtly enough that we don’t have a moderator come down on us.
True indeed, and I have to apologize most sincerely for insulting maroons everywhere by comparing them with griff.
Disparaging the Griff persona Trolling Device is not productive.
There is no actual “Griff”.
He is a creation by Charles Rotten, lead moderator,
and former lead singer in the band The Sex Pistols,
when he used the name Johnny Rotten.
The fictional character “Griff” generates a large number
of page views by making ridiculous false comments.
Charles gets a huge laugh from each “Griff” comment
he posts … usually after a few drinks of Scotch …
and the commenters who try to correct
the imaginary “Griff”.
“Good Scotch, and a few laughs, makes a good moderator.”
Charles Rotten,
grand high exalted moderator at Watts Up With That
Moderator Bait.
Hang on there Richard. If you mean Johnny Lydon (from Galway) the punk rocker – go and wash your mouth out for suggesting he would drink cooking whisky.
He would only imbibe real Irish Whiskey.
You mean the imperceptible change that’s far more consistent with the null hypothesis then with the junk science coming from the IPCC?
The headlines and statements by Guterres are all about future impacts which the scientists have now say are way too alarmist
So things that have been seen dozens of times before, and have been worse in recent centuries, are proof that even though the models are wrong, they are actually right.
“the physically observed, already occurred heating…”
Here’s a timely assessment of the heating that has really been observed and already occurred:
https://rclutz.com/2021/08/08/sh-land-and-ocean-uptick-july-2021/
El Nino: 3
CO2: 0
I am often rebuked for answering questions / issues “too literally” but note that the new AR6 SPM contains 4 main sections :
A. The Current State of the Climate
B. Possible Climate Futures
C. Climate Information for Risk Assessment and Regional Adaptation
D. Limiting Future Climate Change
You would appear to be (at least ?) 75% wrong.
It is about physically observed, already occurring seriously stupid comments under your name.
Sarcasm?
HADcrut4 shows cooling trend globally over last 8 years. Did IPCC even look at that? Or Griff? Of course not.
https://pbs.twimg.com/media/E8W9QmsXMAYvuhX?format=jpg&name=4096×4096
No. Try reading AR5- AR6 Extreme Weather chapters… in fact Pielke Jr. will save you the trouble… in both reports the IPCC finds no trends or declining trends in 80-90% of Extreme Weather categories.
Absolutely incorrect. You score a 100% on the negative. There are no significant trends in important weather phenomena, barring a mild and beneficial rise in average temperature of about 1 degree C in 150 years. That means any extreme whether events, or rate of sea level rise or, secondary human impacts are no different than they were a 100 or so years ago. In fact the biosphere is thriving, plants are growing faster, crop productivity is increasing and almost every measure of human wellbeing is improving. It is the models they are basing their alarm on – almost exclusively and the models are crap. Finally some of the modelers are admitting it though in hushed tones and with no apology. When you say it isn’t about the models you are being either completely obtuse or just plain dishonest.
During the Eemien hippos in the Thames, during the LIA ice fairs on the Thames. Now the temperature is somewhere in between, so why does that worry you?
For something like the last 600 million years co2 has averaged 2000 ppm. In the last roughly 2.5 million years it dropped to almost starvation level but has recently made a tiny recovery from about 280 ppm to 415 or thereabouts and plant life is loving it. Why do you think that is a bad thing?
So your right it isn’t about the models it’s just nature doing what she does and whatever you think has been physically observed has happened before many times and will happen again many times. I fail to see any serious climate impacts.
If it isn’t about the models, then how do you know that the mild warming that the world has enjoyed since the end of the LIA is anything but natural, especially since the current warming still hasn’t reached the levels of the MWP, Roman, Minoan or Egyptian warm periods. Much less the Holocene Optimum.
OH MY GOD!!
CATS AND DOGS LIVING TOGETHER!
griff, if you can get a grip, would you please let us know, in which time period would you prefer to live your life?
[__] Benign low CO2 1675-1750
[__] “Dangerous” CO2 1950-2025
Yes, but what I am surprised is the stupidity in front of the facts. They hold at the same time: 1.5 degC is reached in 2030 and we are almost 80% through that warming. But it seems the impact of that is up to now largely positive. Why do they construct a crisis here?
Follow the money
Compared to the downward adjusted past values.
Griff
Would you like to confirm when they are physically observed from?
The climate change hysterical fear mongers (Griff, IPCC, MSNBC, CNN, NYT, PBS, PBS, The Guardian, ETC., I’m referring to you) continuously make predictions and projections of future weather catastrophes that are neither time nor location specific. “More severe and frequent storms, heat waves, floods, droughts, intense rainfall, more snow, less snow, no snow” are all projected consequences. These are all weather events that happen somewhere in the world every year. Thus, every severe or unusual weather event is claimed to be a predicted example of climate change caused by CO2 produced by burning fossil fuels. This is nothing but an exercise in confirmation bias and propaganda. “A theory that predicts everything predicts nothing”, is axiomatic since no future event can be claimed to falsify the predictions. Hence, as Karl Popper said – not science.
Real science can predict total eclipses hundreds of years in advance to the minute it will be visible at specific locations with 100% accuracy. Computer models for aircraft wing design can predict lift under a wide range of conditions and are verified for accuracy by wind tunnel experiments and ultimately test flights. Real science is capable of making reliable accurate predictions that are demonstrated by the routine successful application engineering.
Meteorologists can predict the high and low temperature for the next day to within about ±2 C with about 80% accuracy. Weather prediction accuracy falls off rapidly for more than a few days ahead. Annual hurricane activity forecasts are limited to estimates of the probability in terms of above normal, below normal or normal activity in a region and are often wrong. No one predicted a 12 year period with no major Atlantic hurricane land falls as occurred from 2005 to 2017. Climate alarmists continued to warn that hurricanes would become more frequent and stronger throughout this period. Climate computer modelers readily admit that their models have no ability to predict either specific time or location of any specific weather events. They say they only project the probabilities of trends in various types of weather related condition over long periods. Thus, no individual specific weather event can be attributed to model projected climate change. Only long term observation and careful objective analysis of trends can support or refute the model projections. So far, the model’s track record in projecting trends has been total failure. No long term trend in any type of weather event has shown a significant change from trends that occurred prior to industrial fossil fuel use.
It may well be getting a little warmer and could very well get warmer still. Much of the measured warming seems to be in the form of less overnight cooling and less cold winters. Some of the warming may even be due to human activity, including the urban heat island effect. But there is no evidence that the warming that has occurred has had a significant impact on weather events. The only apparent and objectively measured trend related to increasing CO2 seems to be expansion in vegetation as measured by the leaf area index. It’s pretty difficult to spin that as a catastrophic negative impact.
The attribution of weather events to CO2 concentration increases is complete non-sense pushed by alarmist propaganda. They don’t even try to hide the fact and have organized a global propaganda campaign through the Columbia School of
MarxismJournalism. I guess they are relying on the scientific ignorance of politicians and the public to keep the scam going. The new IPCC report is just a 4,000 page compendium of climate catastrophe confirmation bias propaganda. DEFUND THE IPCC.Not all models, by any means, and worryingly the ones that best reproduce past climate tend to have the higher ECS.
Good news is that the new report has reduced the likely range of ECS and produced a best estimate:
Gavin Schmidt has a thoughtful post up….
How then should we talk about these models? In my opinion, describing the properties of the multi-model mean or generalizing about the models as a whole is not sensible. Claims such as those made recently that the CMIP6 ensemble ‘runs hot’ are very easily misconstrued to imply that all CMIP6 models have too high ECS values (or indeed all models in general), when really it is only a subset. Discussions of the mean CMIP6 sensitivity is, to my mind, pointless, not least because the ‘CMIP6 mean’ is based on a somewhat arbitrary selection of models that doesn’t take into account model independence nor the fact that CMIP6 itself is a moving target as more models are still being added to the database. And given that all the temperature projections in IPCC are constrained projections, the raw CMIP6 mean and its properties are simply irrelevant for any of the AR6 conclusions.
It is true that *some* models have high ECS beyond what can be reconciled with our understanding of paleoclimate change, and in those models the cloud feedback particularly in the Southern Oceans is more positive than previously. But it is not the case that all the CMIP6 models ‘run hot’, nor is true that the model projections in AR6 are affected by these high ECS values. We should therefore avoid giving that impression.
https://www.realclimate.org/index.php/archives/2021/08/notallmodels/
Had not read that before, thanks.
Holy crap, who would have thought that not all models are as bad as each other. That some models may even better !!
I know, why don’t we look at which model best reproduce the warming since 1990, when trained using previous climate record. Throw out the silly exaggerations on concentrate efforts on this which are better.
I’m sure I’ve heard that kind of idea SOMEWHERE before, it seems to obvious really. I wonder why we haven’t been doing this already for the last 20 or 30 years.
The key takeaway there is that not every last one of the models is running “too hot”, so let’s not draw any hasty conclusions here. Our faith is still strong. (Amen!). I have s e e n the promised land (tell it Brother Phillips!)
Last I heard, the Russian model wasn’t running too hot. It was pretty much the outlier.
“But it is not the case that all the CMIP6 models ‘run hot’, nor is true that the model projections in AR6 are affected by these high ECS values.” Nonsensical. How could “model projections in AR6” not be affected by including hot models in their projections?
The goal of the computer games (aka models) is NOT to make accurate global average temperature predictions.
If that WAS the goal, the average prediction would have been getting more accurate over the past four decades.
And the one model that least over predicts global warming, the Russian INM model, would have been getting the most attention — perhaps almost all the attention.
But the models, as a group, are not getting more accurate, and the Russian model gets no specific attention — it is averaged with several dozen other models that over predict warming by a larger amount.
The computer games (models) are a prop to scare people about the future climate.
They supplement the usual annual prediction of a coming climate crisis … that never shows up.
Unfortunately, few people realize a computer predicts whatever the owner and programmer want predicted.
The “owners” obviously want to predict a much faster rate of global warming than has actually happened since the CO2 level began rising, from the 1932 trough of the Great Depression.
The computer games make climate projections intended to scare people.
They have no other use.
Other than wasting taxpayer’s money.
Could it be that in short Gavin is saying ” actually its all shoite anyway”
There are no models that hindcast past climate with any kind of accuracy. That despite having dozens to hundreds of tunable variables.
Every single model runs hot, and most of them are no longer within the error bars.
What about the Russian coluuuuuusion model?
I thought the ones that best reproduce past climate were the ones most carefully tuned to the past climate.
In Chapter 7 –
” In summary, the ECS based on the assessed values of ∆𝐹2×CO2 and α is assessed to have a median value of 3.4°C with a likely range of 2.5–5.1 °C and very likely range of 2.1–7.7 °C. ”
https://www.ipcc.ch/report/ar6/wg1/downloads/report/IPCC_AR6_WGI_Chapter_07.pdf
Maybe ECS does not have the effect on mean temperature assumed? Other feedbacks and other effects. From the models one must assume the premises are incomplete and/or mistaken. It is supposed to occur in the mid-troposphere, where in-situ measurement yields lower values than any model, i.e. relating CO2 to temperature mean values.
“the ones that best reproduce past climate”
That made me laugh.
And, I’m troubled that while the range of ECS has been narrowed slightly, the best estimate has been increased.
I’m also perplexed about why the ranges are asymmetrical. That usually happens when the probability distribution is skewed. That is, the PDF is non-Gaussian, meaning that the statistical implications are limited.
Did you ever sit on a project review committee where the tasks were all updated to be 1% more complete even though nobody had actually done a damn thing since last month?
Kinda like that.
Here is my assessment of chapter 7 of the original draft.
http://www.palisad.com/co2/comment_fod.xlsx
After looking at the released version, it appears that they did not address any of the concerns I raised.
I reviewed the Second Order Draft but from what I can see, all of my comments were ignored too.
You do have to remember that the “review” process is merely to polish the turd so that the readers will believe it. I made sure that as few of my many comments helped with that polishing, in fact I made sure I dragged a few keys across the paintwork.
My only purpose was to insure that it was on the record that they know how wrong they are. This is so that when the truth finally emerges, any defense based on incompetence or ignorance will fail to cover up their malfeasance.
This is IPCC’s standpoint on paleoclimate data and old weather data. From page 58/3949:
“However, paleoclimate archives, such as tropical glaciers and modern natural archives used for calibration (e.g., corals and trees), are rapidly disappearing owing to a host of pressures, including increasing temperatures (high confidence). Substantial quantities of past instrumental observations of weather and other climate variables, over both land and ocean, which could fill gaps in existing datasets, remain un-digitized or inaccessible. These include measurements of temperature (air and sea surface), rainfall, surface pressure, wind strength and direction, sunshine amount and many other variables dating back into the 19th century. {1.5.1}”
This is how they hide the truth of the history.
Mankind travelled to the moon, but cannot recover records.
This links to graphics of climate records of the Holocene. Many different proxy data sources are used. Pretty hard to hide the fact that most of the Holocene has been warmer than the present
Do those graphs show the 1C increase of the modern warming period?
You make the CliSciFi mistake of comparing high-frequency measured temperatures to low-frequency paleo-estimates. Mann & Co. had to truncate paleo-estimates mid-20th Century because of their estimated temperatures took a downturn while instrument temperatures went up.
Are you here asking questions and telling us that we are all gunna fry and you cannot even read or analyses these graphs Lloydo.
We are not the deniers of scientist or history .
You and the crooked scientists have denied history that the world has been warmer three times than it is at present in the last 12000 years .
These are the facts but you and Griffy don’t want to know .
The earths climate moves in cycles and there are many theories of what causes the warming and cooling which is natural and man has no control over the climate.
Until there is an explanation of what caused the Major Ice ages and even the little Ice age and how the world recovered from the cold times I will remain skeptical of these scary claims that if we do nothing we will see runaway global warming.
1C my arse. The peer-reviewed climate literature shows that we’ve already passed the temperature of the sun and it’s still worse than we thought:
You expect charts measured in millenia to show a couple of years worth of data?
Jonas was referring to the modern period: “they hide the truth”.
It hasn’t stopped you repeatedly claiming “for most of the last 10,000 years it was much warmer than today”. Which “couple of years of data” and which graph are you basing that on?
I know it must be a bitter pill to swallow but the science says phil’s graph is probably about right.
“it is more likely than not that no multi-centennial period after the Last Interglacial (roughly 125,000 years ago) was warmer globally than the most recent decade.”
https://www.ipcc.ch/report/ar6/wg1/#SPM
And please, if you’re going to attempt to refute this – provide some evidence and don’t just claim you already have.
You do realise you are quoting the Summary for Policymakers? The unelected people who get to change the wording.
“Replace ‘medium confidence’ with “High confidence” to read:
“Since around 1950, GMST has increased at an observed rate unprecedented for any
50-year period in at least the last 2000 years (high confidence).”
Required for consistency with changes made to SPM”
The politicians are more certain than the scientists. Page 2-35 or 45 of 223. 😉
“The politicians are more certain than the scientists”
That’s a good way to put it.
I posted that to show what a farce it is. Similar to proposing that a multi-centennial period is the same as a decade, which is BS on its face too.
Since your tribe of miserable humans likes to use sea ice as a proxy, check sea ice. You’re one click away:
https://nsidc.org/arcticseaicenews/charctic-interactive-sea-ice-graph/
Wow, I wasn’t expecting that.
“it is more likely than not that no multi-centennial period after the Last Interglacial (roughly 125,000 years ago) was warmer globally than the most recent decade.”
Obviously, that doesn’t apply to North America. As you can see from the U.S. chart below, it was just as warm in the 1930’s as it is today (1998 and 2016 being equivalent in warmth). And I have other charts from around the “globe” that show the very same thing: It was just as warm in the Early Twentieth Century as it is today. As for the 125,000 years, don’t make me laugh.
Tom, can you address station moves, time of observation changes, instrument changes, and other non-climatic effects in your graph and resubmit for review?
Time of observation changes is certainly a problem for satellites with degrading orbits. However, for stations that automatically recorded the minimum and maximum, without associated times, it is a non sequitur.
As to station changes, yes that can be problematic. As I recollect, when Los Angeles moved the official site from downtown LA to a UC campus, the temperatures dropped about 4 degrees. However, they weren’t really the same stations. They just both had the same name.
Modern instruments tend to be more sensitive to wind gusts that provide transient changes, leading to greater variance, but if done properly, should provide similar averages.
The biggest problem is UHI increasing in modern times. Tom’s claim, “it was just as warm in the 1930’s as it is today.”, is reinforced by the changes that have occurred.
The concepts of observation time in the context of satellite data is completely different than the concept of time-of-observation in the context of surface stations. TOB changes for surface stations are a huge problem and cause a significant low bias on temperature trends after WWII when the TOB started switching from PM to AM in an effort to reduce the bias on precipitation observations. Without understanding the unintended consequences and the fact that it caused another different bias which would later haunt climate researches the change seemed logical at the time. Though given what we know today that was probably for the best as compensating for a precipitation bias is harder than for a temperature bias.
Loydo, the physical evidence that today’s temperature is colder than it has been for most of the last 10000 years is utterly overwhelming. Sea level was higher during the Medieval Warm Period and the Holocene Climate Optimum. Trees grew at higher latitudes and altitudes during both these periods. The current level of Arctic sea ice is greater than it has been for most of the last 10000 years. What the Vikings did in Greenland during the Medieval Warm Period is simply not possible today.
I am sure that this is a bitter pill for you to swallow but you cannot deny reality for ever.
If the evidence is overwhelming then it should be easy to point us to a global temperature reconstruction showing as much. Would you mind posting a link to the one you use to support your claim?
Are you asking for evidence that the Vikings managed to successfully farm in Greenland or that tree stumps are being exposed in the Alps as the glaciers retreat, demonstrating that forests formerly grew there? Both are pretty much common knowledge for those that keep up with the news.
No. I’m asking for a global temperature reconstruction.
You are asking for a proxy temperature reconstruction which have no value because they are refuted by the physical evidence I have referred to above.The only way to refute what I have said is to provide, for example, physical evidence that treelines were lower during the Holocene Climate Optimum. Can you provide that physical evidence?
So how do you know that “today’s temperature is colder than it has been for most of the last 10000 years”?
The physical evidence says so. I notice that you cannot find any physical evidence that contradicts what I said.
What evidence? What global temperature reconstruction are you using to support your hypothesis?
Kaufman et al. 2020 a and b. That is an example of a global temperature reconstruction. It happens to be inconsistent with the hypothesis “today’s temperature is colder than it has been for most of the last 10000 years”.
Proxy temperature reconstructions are worthless and pointless. History has shown that it is far too easy for unscrupulous individuals to carefully select proxies to achieve the desired result. However, physical evidence doesn’t lie. Your utter failure to provide physical evidence to contradict what I have said says it all.
So if temperature reconstructions are pointless and worthless than how do you test the hypothesis “today’s temperature is colder than it has been for most of the last 10000 years”? Can you define “evidence” and what it would take to convince you that a hypothesis such as yours is false?
Have you actually read my posts? Your last reply says no. Please read my posts again and your question will be answered.
Yes. I read them carefully. I see no link, citation, or reference to a global temperature reconstruction supporting your hypothesis. In fact, I don’t see a link, citation, or reference to any publication describing evidence of any kind at all. Maybe my browser is not letting me see them? If you wouldn’t posting a picture of the links, citations, or references to such evidence that may help resolve the issue should one exist.
Bdgwx, can you prove that the Viking colonisation of Greenland is a hoax perpetrated by historians? Can you prove that the remains of trees found above the current treeline are a hoax perpetrated by scientists? If you can do that, I will believe that my hypothesis is false.
I don’t think the Viking’s colonizing Greenland is a hoax so why would I try to prove as much?
I don’t think the remains of trees found above the current treeline are a hoax so why would I try to prove as much?
Let me make sure I have this straight. Your acceptance that the hypothesis “today’s temperature is colder than it has been for most of the last 10000 years” is false is based on the above claims being hoax and not based on the global temperature at all. Is that right?
Thank you for admitting that these are not hoaxes. We are making progress here. You have finally admitted that the Medieval Warm Period and the Holocene Climate Optimum were warmer than today. So you have acknowledged that you were wrong.
I didn’t say that. What I said was 1) I don’t think Vikings colonizing Greenland is hoax and 2) I don’t think tree remains above the current treeline are a hoax.
Thank you for your acceptance of reality.
Bdgwx, I would also like to point out that “my hypothesis” is actually the scientific consensus. Every climate scientist who I know personally accepts that today’s temperature is below the majority of the last ten thousand years, even the climate alarmists. You are in a very small minority.
Can the climate scientists you know personally provide a global temperature reconstruction supporting their acceptance that “today’s temperature is below the majority of the last ten thousand years”?
Every climate scientist that I know personally accepts that the Holocene Climate Optimum was warmer than today which means that today’s temperature is colder than most of the last 10000 years. Which of course proves my point. I have asked you repeatedly to provide physical evidence which can throw any doubt on this and you have yet to do so. If you cannot do this, this discussion is at an end. This means that you have one more chance to provide this information which contradicts the known physical evidence.
I have copied this comment from Javier. There are many such comments from other posters on the same subject. I look forward to your physical evidence which contradicts the many studies which show the Holocene Climate Optimum was warmer than today.
Javier
July 1, 2020 at 8:38 am
Plenty of evidence-based reasons to affirm that we are not living through the warmest period in the Holocene.
Biology is the best indicator. Trees cannot grow above the tree line in mountains, and this is due to temperature not precipitation. Dozens of studies show that present tree-line is well below the Climatic Optimum all over the world. In most cases by hundreds of meters. An example among many:
Holocene treeline changes on the south slope of the Pyrenees: a pedoanthracological analysis
“The spatial precision provided by this proxy allows us to show that the maximum exten- sion of the upper forest line was 400 m above the current line.”
And then we have the glaciers to confirm what trees tell us. There are many dozens of studies showing that glaciers were at their smallest about 6000 years ago.
Solomina et al. 2015 Holocene glacier fluctuations
“the retreating glaciers in most parts of the Northern Hemisphere are still larger today than they were in the early and/or mid-Holocene.”
Whoever says we are warmer now than during the Holocene Climatic Optimum is either lying, or fooling himself from improper evidence.
So now the evidence for acceptance of the hypothesis “today’s temperature is colder than it has been for most of the last 10000 years” is based on 1) treeline changes on the south slope of the Pyrenees and 2) Holocene glacial fluctuations. Is that correct?
BTW…your own source here says Holocene glacial decline in the last century is “unprecedent” occurring at “very high rates”, “global in scale” and “acting during an interval of orbital forcing favorable for glacier growth, rather than degradation”. They also say “This highlights the remarkable consequences of anthropogenic forcing on glaciers worldwide” and “The retreat of glaciers worldwide recorded in all mountain systems, in the Arctic and in Antarctica, over the past century provides some of the most striking evidence in support of current human-induced global climate change”.
Going further…your own source cites global temperature reconstructions like Marcott et al. 2013 clearly showing that it is warmer today than at any point during the Holocene.
One last thing…I already provided evidence contradictory to your hypothesis. I actually provided it 4x already in this blog post. it is Kaufman et al. 2020 a and b. Or you could just refer to your own source which comes to the same conclusion.
You have now failed to provide physical evidence to support your extreme position. It is now blatantly obvious that you have precisely zero credible support for your bizarre views. Until you can provide physical evidence which contradicts the existing mountain of physical evidence against your position, there is no point in you posting again on this thread. In the future, you should learn some climate science before posting on WUWT. It would spare you any further embarrassment.
In this era of fake peer review “it should be easy” is a straw man, and “one” is another cheap straw man. They are constructs that came out of your head alone.
Why don’t you try to get a paper published, a review, of the global situation from the thousands of papers on the subject. Here are some useful links to get you started.
http://notrickszone.com/global-warming-disputed-300-graphs/
There’s no need for me to publish. Those far smarter than I have already done so. Kaufman et al. 2020 is an example.
I went through the NTZ list. Out of all of those publications I found 2 advertised as being a global temperature reconstruction. Gerhard 2007 published the American Association of Petroleum Geologists Bulletin journal actually defers to Davis and Bohling 2001 which is based on ice core data from Greenland only. So NTZ mislabeled this publication. That leaves only Loehle 2007 published in the Energy & Environment journal as the sole NTZ reference. Note that Loehle 2007 only used 18 timeseries none of which from the available instrumental data. You can find peer reviewed commentary here highlighting problems that Loehle declined to address.
I want to bring up something that should be rather obvious from the NTZ list. All of those regional temperature reconstructions have temperatures all over the place. There is no agreement on the timing or magnitude of the Holocene Climate Optimum, the MWP, the LIA, etc. That NTZ list itself casts doubt on the claim that the HCO, MWP, and LIA were globally synchronous events.
What a strange conversation.
Physical evidence like tree rings and written histories (Norse sagas) shows there’s nothing unusual going on, by geological scales.
It has been well known for decades.
Here is NASA showing the same:
NASA GISS: Science Briefs: Earth’s Climate History: Implications for Tomorrow
The green argument is that modern civilization is only 400 years old at most. So civilization is doomed.
They are wrong. But not because we have been warmer before. It’s because wealth and technology make us more resilient, not less.
That’s right. Physical evidence shows that the climate system is sensitive to large and abrupt changes. Given enough of a nudge the climate system can change dramatically and suddenly.
I don’t know what the “green argument” is, but it doesn’t sound like something I would support since the body of evidence does not suggest that “civilization is doomed”. Either way I don’t what this has to do with the hypothesis “today’s temperature is colder than it has been for most of the last 10000 years”.
That’s history, Loydo. The temperatures have cooled since then. You are living in the past.
“Pretty hard to hide the fact that most of the Holocene has been warmer than the present”
No one disputes that, because Earth’s orbital eccentricity gave an extra 50 Wm2 at 65 N 10k years ago and it’s been a gradual fall since then.
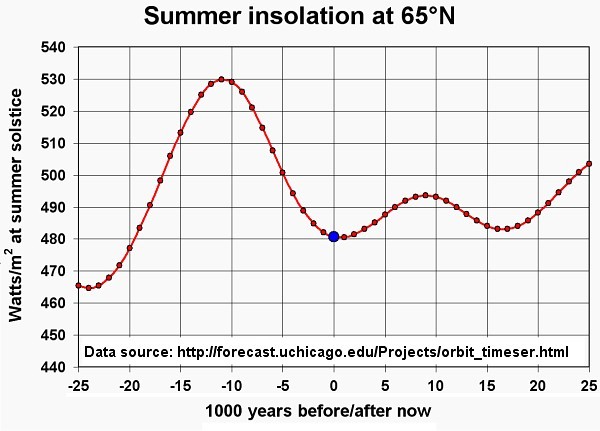
It’s ( 6k ya) not called the Holocene Climatic Optimum (HCO) for nothing …
Wouldn’t it be great if we could stave off the inevitable descent into the abyss of freezing cold? Sadly, “Caaaahbon” is just too useless for the job.
So it,s the earth,s orbit?
If so it disproves most of the feedbacks that make AGW newsworthy,
More input energy should be equal to a delay in losing energy.
That comes from Kaufman et al. 2020a in which a multi proxy database of Holocene temperatures is presented. In Kaufman et al. 2020b the authors form a composite of the proxy temperature timeseries using multiple techniques and present the composite with the instrumental record. The result is as follows. Note that your source says that it is likely warmer today than at any point during the Holocene.
The inset shows a “catastrophic” rise into the future (>0BP), presenting it as if it was measured data. How visually dishonest.
BP is before present where present is defined as 1950. There are no future projections in this graph or publication. If the “catastrophic rise” you speak of is the black line then that is ERA-20C reanalysis of observations from the instrumental era.
Glad to see that you took the time to read that. However they do not seem to offer any evidence that the globe is presently warmer. They use The IPCC double speak of “likely” meaning we will throw out a guess here to ensure more funding.
The IPCC defines “likely” as having a 66% likelihood. But in Kaufman et al. 2020b you’ll see that the modern warm era temperature exceeds that of all periods during the Holocene including the climate optimum circa 8-5k years with likelihood of at least 95% (2σ). This is a statistically significant result.
Totally anti scientific bogus grafting of faked instrument “data” onto largely dubiousreconstructions. Observation of valid paleo proxies show that the HCO, Egyptian, Minoan, Roman and Medieval WPs were balmier than now.
Can you post a link a valid paleoclimate proxy reconstruction of the global temperature showing that the HCO, Egyption, Minoan, Roman, and MWP were balmier than now?
The UN IPCC CliSciFi AR6 SPM included a Hockey Stick paleo graph.
Act now and receive two free forest fire protective blankets and a polar vortex snow measuring stick. Also enter our drawing for the next Obama birthday party at the beach as our grand prize and be 1 of 6 winners for polar bear tourism trips, bullets not included. Those who don’t act now will be charged anyway because the advocacy science is settled.
Ring……Riiiinng….”Hello, we’ve been trying to reach you about your extended climate fubar insurance…”
The release of the Summary for Policymakers before the release of the underlying documents which contain the pseudo-evidence, nuance and caveats is vaguely reminiscent of Lewis Carroll’s Queen of Hearts: “Sentence first; verdict afterwards.”
In past reports, the executive summary seemed to have little to do with the actual report. This way there is nothing holding back the pols and journalists that need a kick in their ratings. Pure unadulterated B*** S****
https://www.ipcc.ch/report/ar6/wg1/downloads/report/IPCC_AR6_WGI_SPM.pdf
I am a policy maker, however extremely tiny. From the Summary for Policy Makers.
“Based on scientific understanding, key findings can be formulated as statements of fact or
associated with an assessed level of confidence indicated using the IPCC calibrated language4.” First line of footnote 4—“Each finding is grounded in an evaluation of underlying evidence and agreement.”
I would make a tiny suggestion that the best for any credibility in a document is establishing their previous credibility, not doing the same thing as in the previous document (AR5).
“Calibrated language” immediately raises the “science communication” question. “It is unequivocal ..” fits with that.
What concerned me was were Moderate Confidence was determined on the basis of a combination of Low Evidence, but High Agreement. That is categorically NOT how science is supposed to work. If there is no evidence that my new drug works, but all my lab partners agree that it does, moderate confidence is not implied!
But it is how religion works.
It is a matter of faith.
I suppose somebody could be relied on to make a totally irrelevant comment.
I thought that my comment explained the Apocalyptic findings quite well.
To each their own.
What would be a relevant comment when the original comment is referring to climate change propaganda (language)?
M calls it religion. I would tend to agree.
They should have written their findings in the form of quatrains.
I trust someone will download the current version of the report. It states it is subject to final copyediting, and while there are other important issues to discuss, it might be interesting to see what edits are made.
The scientific findings will be changed to achieve “consistency” with the Summary for Policymakers”.
The tail will wag the dog as usual.
I downloaded chapter 7 and it contains information about the edits applied since the original draft which I also have. Not much of substance has changed, not that there’s much to begin with ….
I think the only thing new they are going to come up with is upward-revised confidence levels. Which are basically personal opinions posing as science.
Crowd-sourced ‘wisdom.’
It’s because of trickle backs from the SPM.
Been there, done that. It is readily available on the IPCC site in PDF. Not sure I will ever get through all of the nearly 4000 pages though.
It’s readily available from the IPCC’s web page for WG I. It was there as the spin – sorry, media “event” – concluded. The edits for every chapter are noted at the start of the chapter.
But approve Nordstream II because it’s an exception to the rules.
Leave Nordstream II alone, it will save Europe from exponential wind turbine.
“Leave Nordstream II alone, it will save Europe from exponential wind turbine.”
ah – let’s see: – perhaps
“Leave Nordstream II alone, it will save Europe from exponential wind turbine, if Poisoner Putin permits . . . . “
Is that a tad better?
Auto.
The cacophony of ever more shrill warnings increases to a crescendo … while the actual claimed “impacts” are … nothing.
Storms? When has the earth never had storms?
Drought? When has the earth never had drought?
Too much precipitation/floods (note “Drought” claims above)? When has the earth never had floods?
Wildfires? When has the earth ever not had wildfires?
Too many people on this planet, living, starvation and famine the least it has ever been in human history, lifespans the longest they’ve ever been in human history, standards of living the highest there ever were in human history?
Why, we can’t have that!
Duane: “Too much precipitation/floods (note “Drought” claims above)? When has the earth never had floods?”
–
–
Most cultures have handed down reports of the Mother of All Floods which happened several thousand years ago.
–
It seems the climate has changed for the better because that flood event has yet to be surpassed by any flood since.
–
By the way, with all that projected drought, those projected floods should be dry floods. So, no worries.
I think this report should be ridiculed on the basis of the first figure where they recapitulate the silly hockey stick. The rest is the usual drivel but why get into it, when this first figure is such egregious rubbish – and what about ocean acidification! These people who sell CO2 for aquaria must be mad.
This is getting sillier each year. We are having an indisputable climate optimum for life based on all authentic scientific standards.
One of them is the planet massively greening up not despite but exactly BECAUSE OF beneficial climate change and the increase in the beneficial gas, CO2.
https://www.marketforum.com/forum/topic/69258/
The UN has been feeding us this anti/junk science bunk for over 3 decades now:
https://www.marketforum.com/forum/topic/70534/
Instead of the “Boy that Cried Wolf”, its the “Governments that cried Climate Wolf” for 32 years in a row but still no REAL wolf as the planet, instead of dying…………massively greens up.
They hijacked climate science for their political agenda and have created a POLITICAL climate crisis………..based on blaming every weather extreme on it(most that have happened before and are part of natural variations) and busted simulations of the atmosphere going out for 100 years using subjectively chosen math equations(to get their solutions) that have all doubled the amount of real warming.
Almost every aspect of it is covered here, some repeatedly, showing the authentic science vs the manufactured science of the UN and the UN created IPCC:
https://www.marketforum.com/forum/topic/27864/
The drought and increase in wildfires out West have been caused by a NATURAL temperature configuration in the Pacific. The La Nina and the La Nina signature in the tropical Pacific since early 2020, that is causing this…….. is from COOL temperature anomalies which are associated with natural global cooling. Global warming CAN’T be causing that.
They have it exactly backwards………….another example of them wrongly associating every bad thing with man made climate change.
Global warming will cause an INCREASE in precipitation in that region!
https://www.marketforum.com/forum/topic/59093/#60429
A significant change in A.4.4 is the claim to have narrowed down the range of the CS estimate. It will be interesting to see what support the IPCC has provided to justify the removal of 1.0°C from the low end and 0.5°C from the upper end of the Charney Range.
“The AR6 assessed best estimate is 3°C with a likely range of 2.5°C to 4°C (high confidence), compared to 1.5°C to 4.5°C in AR5, which did not provide a best estimate.”
Why would anyone trust people who can’t find the “divide by” key and the “2” key on a $4 calculator ??
If I understand your point, it is flawed. Any chance I misunderstood you?
We had a half-doubling of atmospheric CO2 from the pre-industrial 280 ppm when we crossed 396 ppm (logarithmically speaking) with a warming of pretty much zero above the null hypothesis baseline level, but let’s say its 1 degree. 1 divided by 2 = 0.5.
Curious to know what you think I meant? Flawed because I didn’t use the fabricated construct known as ECS?
Oooops, that was flawed. Let’s say it’s 0.5 above the null baseline level (and that’s generous), need to multiply by 2 to get to 1 degree. I suspect you meant something else though.
Phil, your calculation would give TCR (Transient Climate Response) rather than ECS. I expect IPCC would claim 1.0K post-industrial warming, to give 2.0K TCR, and then multiply that by, say, 1.5 to convert to ECS and get 3.0K.
My 2018 paper, which I suspect AR6 doesn’t quote, gives a rather low estimate of ECS/TCR as 1.15, which would turn 2.0K into 2.3K.
The paper is “On the influence of solar cycle lengths and carbon dioxide on global temperatures”, published by the Journal of Atmospheric and Solar-Terrestrial Physics (JASTP), available at https://doi.org/10.1016/j.jastp.2018.01.026 (paywalled) or in publicly accessible pre-print form at https://github.com/rjbooth88/hello-climate/files/1835197/s-co2-paper-correct.docx .
Rich.
Thanks, I will read the paper. Since you are an expert in this, could you please (if you are still here) provide a link to the origin of the term ECS, which I assume is shorthand for the Equilibrium Climate Sensitivity to a doubling of carbon dioxide.
Looking at the monthly time-frame “equilibria” in ENSO, and the measured SSTs, the data seems to indicate that there is no such thing as ECS, and if there is, it hasn’t been shown empirically to be indistinguishable from zero, and only exists in thought-experiments of the future which, of course, are not empirical.
Phil, yes, your definition of ECS is correct. Double CO2, stop increasing it, and wait for n years for equilibrium and measure the temperature. My main concern with the concept is that if n is large, and I have seen it as large as 600 in some papers, then long term oceanic cycles could have as much of an impact as that CO2 doubling.
I don’t understand your comment about ENSO, which is a short period wobble.
As I suspected, your point is flawed.
I was a little surprised by this change too. I was expecting the lower bound to increase to 2.0C, but given the IPCC’s history on the topic I was not expecting it to jump to 2.5C. I will say the consensus is 2.6-3.9C (Sherwood et al 2020) so they are still a hair on the conservative side, but not enough to quibble over anymore.
Again ignoring the empirical studies that show a much reduced ECS range. Its models all the way down.
High confidence means that the probability of confusing people into believe the same old BS is high by giving the appearance of making progress towards understanding the result of CO2 emissions that’s even worse than they thought. Of course, they keep having to make it worse because even at the current level of alarm, most people don’t seem to care.
Just goes to show that it is possible to ‘prove’ anything by careful selection of data. In SPM.1 panel a) they show a temperature record going back only 2k years, in order to highlight the “hockey stick” of a +1C anomaly. They show a vertical bar which they claim was a similar anomaly 6.5k years ago, and go on to say “The Last Interglacial, around 125,000 years ago, is the next most recent candidate for a period of higher temperature”
Here is data frequently referred to by NASA when promoting the AGW agenda, so why not use it? Maybe because it reveals features for which they have no alarming explanation!
The Eemian was a lot hotter than now. Forests grew at North Cape and hippos swam in the Thames at London. The Holocene has also been repeatedly warmer than now.
Dr. Pielke nails it in his tweets. Nothing I could possibly add to his dissection of the SPM. It must be a good year for cherries; they’ve been picking them like no tomorrow.
Now it’s official, griff calls it “global heating”. Climate change has been re-branded!
Fire season is busy this year (in case anyone hasn’t noticed), building on the “success” of 75 years of active fire suppression around the world, and the media are milking it. Tony Heller’s latest piece on this is quite instructive and well worth showing to anyone with an open mind. He has dug deeper than ever into historic news articles. Youtube hasn’t got round to deplatforming him yet, but they do make his pieces hard to find; better to just go to his website.
Why bother reviewing a document everyone knows is fact free and all lies? It isn’t as if any decision is made based on fact, truth, science. Hasn’t anyone learned anything from COVID? It is all lies all the time to acquire power to abuse.
“Why bother reviewing a document everyone knows is fact free and all lies?”
I understand your sentiment, but somebody has to call these climate change liars out on their lies, otherwise, gullible people will believe these liars and may do something foolish like supporting these liars.
They finally erased the MWP. Okay, but that was to be expected after the infamous hockeyschtick.
And of course nearly every graph starts in the LIA. Where else should one do it…
But did they really deleted the Holocene Optimum? Or did I see that wrong?
Where are you seeing that the MWP was erased?
Where are you seeing that the Holocene Optimum was deleted?
Figure SPM.1.
“Beginning approximately 6500 years ago, global surface temperature generally decreased, culminating in the coldest multi-century interval of the post-glacial period (since roughly 7000 years ago), which occurred between around 1450 and 1850 (high confidence).”
Couldn’t find figure TS.1 but the text ignores/hides the fact that temperatures from where declining started were 3C warmer than today.
And btw what is the “Do Not Cite, Quote or Distribute” bs in the pdf? That is completely paid by tax payer’s money!
SPM.1 is the global temperature reconstruction. It is not the land temperature reconstruction for the region in which the MWP is most relevant (the periphery of the North Atlantic). SPM.1 does not “erase” the MWP nor is it inconsistent with it.
Where are seeing that global temperatures were 3C warmer than today?
There are more than 1000 paleoclimate publications that find a signal of the MWP at different places all around the globe:
https://www.google.com/maps/d/u/0/viewer?mid=1akI_yGSUlO_qEvrmrIYv9kHknq4&ll=-3.81666561775622e-14%2C38.03818700000005&z=1
That is my whole point: nowhere. It is hidden by only citing a later reference period (6.5-5 BP) instead of the maximum (8 BP).
Can you post a global temperature reconstruction compositing the 1272 publication at that link? In lieu of that any global temperature reconstruction you are comfortable with would do actually.
Where are you seeing that the global temperature was 3C warmer than today? Which reconstruction are you referring to exactly?
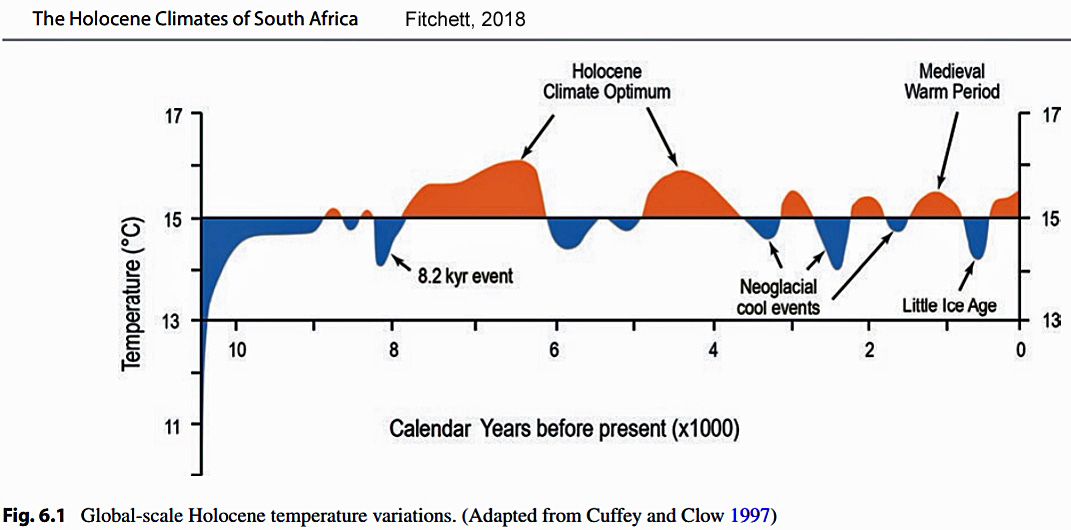
Dahl-Jensen et al. 1998, Kaufman et al. 2004, Avery 2009, Gkinis et al. 2014, Fitchett 2018.
Though revising the Holocene Optimum graphs it is even more mischievous taking the period from 6.5-5BP as that is cooler than the most of it:
Dahl-Jensen et al. 1998 is for Greenland only.
Gkinis et al. 2014 is for Greenland only.
Fitchell 2018 is behind a paywall so I cannot verify what is said. But I did find the NTZ article referencing it. This is where you got you graph actually and the claim that the MWP was 3C higher than today. The +3C claim comes from Tyson et al. 2000. I recommend you read the publication. Note that the temperature reconstruction is for South Africa only and that NTZ is referring to 1500 AD and uses 1961-1980 as the baseline. In addition the graph says it was “adapted” from Cuffey & Clow 1997 which as best I can tell has nothing even remotely resembling that graph.
I was not able to find Avery 2009. But I did find a reference on the Friends of Science of website which oddly enough presents the same graph as what you show, but credits it to Dansgaard 1984 and Avery 2009.
My concerns…
— Your sources contradict each other.
— Your graph is being attributed to 4 different creators none of which actually created that graph.
— Two sources are for Greenland and one is for South Africa.
— One source says the MWP peak as 1000 AD while another says it was 1500 AD.
— None of your sources present a global temperature reconstructions.
Please address these issues and resubmit for review.
“MWP at different places all around the globe”
There is plenty of evidence that the MWP was not global, and just a NAO driven climatic period that favoured Europe.
And it cannot therefor “be erased” on a global creonstruction – it is merely subsumed because iof it’s geographically small area.
Science moves on and the ealry reconstructions (Lamb) .
This evidence FI:
https://advances.sciencemag.org/content/1/11/e1500806
“The climatic mechanisms driving the shift from the Medieval Warm Period (MWP) to the Little Ice Age (LIA) in the North Atlantic region are debated. We use cosmogenic beryllium-10 dating to develop a moraine chronology with century-scale resolution over the last millennium and show that alpine glaciers in Baffin Island and western Greenland were at or near their maximum LIA configurations during the proposed general timing of the MWP. Complimentary paleoclimate proxy data suggest that the western North Atlantic region remained cool, whereas the eastern North Atlantic region was comparatively warmer during the MWP—a dipole pattern compatible with a persistent positive phase of the North Atlantic Oscillation. “
@Anthony Banton
You might excuse that I don’t agree that a singular dipole event can counter all the evidence around the globe even from Antartica and New Zealand.
Even more so as dipoles are expected and already described in the references I linked too.
Cause most regions were warmer but some regions were colder which is to be expected just how circulation and dipoles work.
This paper looked at it for Africa:
https://agupubs.onlinelibrary.wiley.com/doi/full/10.1002/2017PA003237
MWP in New Zealand:
https://agupubs.onlinelibrary.wiley.com/doi/full/10.1029/2001GL014580
South America:
https://www.researchgate.net/publication/328636911_The_Medieval_Climate_Anomaly_in_South_America
The MWP and LIA were global. Timing and effects naturally varied somewhat regionally, but their signals show up in each ocean and on very continent.
Those are good publications. I read both of them. New Zealand has a peak from 1150-1250. South America has a peak from 1300-1400. When NZ is warm SA is cool and vice versa. This suggests ENSO, SOI, ocean currents, and/or other heat transfer cycles were probably playing a role in the see-sawing of temperatures between these regions. One thing I should mention is that in both regions it is warmer today than it was during their respective peaks. These publications are inconsistent with the hypothesis that the MWP was global synchronous and that temperatures anytime between 800-1500 were higher than today.
But obviously not the one about Africa.
It is never at the same time warmer or colder everywhere. And if the climate changes it is to be expected that it happens gradually so some regions will be first and others follow/might go in the other direction at first.
The original source of the graphic above btw seems to be from the climatology textbook
Schönwiese, Ch.-D. (1994) Klimatologie.- Ulmer, Stuttgart.
with updated versions 1995, 2008 and 2019 and seems to have been adapted by a bunch of sources.
Anyway, really important to put PAGES2K 2019 climate of the past’s data into a context is this publication about northern hemisphere
https://www.sciencedirect.com/science/article/pii/S1125786520300965
With this graphic:

And very telling that the people from the 2020 paper have been together on the 2013 PAGES2K with the people from 2019.
Seems that one half of the paleoclimotolgy crowd was fed up with feeding the hockeyschtick narrative against the evidence by cherry-picking data.
Especially as the 2020 paper agrees with previous reconstructions from previous decades
So my apologies if I just follow my gut feeling here that people who leave a consortium with a really good chance to publish in high ranking journals leave it might have an honest reason to do so.
Especially as the 2000 year reconstruction from 2013 to 2019 had a quite hockeyschticky-like development which disagrees with studies that have been published in a time where climatology was not yet politicized.
Hard to believe that’s a coincidence.
Will be interesting to see when (and if) the people from 2020 are going to publish a global reconstruction. If they ever do cause there is a lot of pressure on the journals not to disagree with a Nature publication in climatology. Let’s see who has the guts.
Found TS.1 and TS.2.
Yeah, holocene optimum is erased and replaced by mid-holocene pretending it was never warmer during this interglacial. That is deliberately misleading.
That’s a polite way of putting it.
New, even more exaggerated bullshit! Film at 11, including lots of “bad weather = climate change” nonsense to appeal emotionally to the stupid, the gullible, and those who aren’t paying attention to anything but the crap the “media” feeds them!
I can see Gavin Schmidt and his former boss, J. Hansen (Father of Inundation-by-Boiling- Seas-Climate) who have had turn-around epiphanies finding plausibility in a 30yr cooling on progress must have got their message across to IPCC.
The big message was acceptance at NASA that models are running a way too hot! Have they thought this through? I’m not sure they have. A 30yr cooling will not only connect up with the 18yr Dreaded Pause, it would likely connect up with the 35yr cooling ending in 1980. That would erase the 1980-1997 warming that all the fuss, expense and draconian global policieshas been about!
Did the Global Warming Potential for methane go over 100?
I’m in the woods with an IPad and wading through all of the blah blah blah… will just have to wait.
Inevitably, we’re all going to die. The IPCC just confirms that some will die stupid.
And we have a winner! Best comment on the thread!👍
Looks like the Hockey Stick is back, see pp SPM-7 of the main report.
And SPM.1
More than a whiff of cherry picking in this:
“A.3.1 It is virtually certain that hot extremes (including heatwaves) have become more frequent and more intense across most land regions since the 1950s.”
Virtually certain for “most” land regions is meaningless. And what happens if the period before 1950 is included?
It’s going to be fodder for Tony Heller to trot out some graphs.
https://wattsupwiththat.com/2019/09/06/the-gestalt-of-heat-waves/
One prediction that frequently gets misquoted is that of the first practically ice-free Arctic summer. Note that “practically ice-free” means < 1e6 km^2 of extent. AR6 now lays out the prediction in no uncertain terms.
B.2.5 Additional warming is projected to further amplify permafrost thawing, and loss of seasonal snow cover, of land ice and of Arctic sea ice (high confidence). The Arctic is likely to be practically sea ice free in September at least once before 2050 under the five illustrative scenarios considered in this report, with more frequent occurrences for higher warming levels. There is low confidence in the projected decrease of Antarctic sea ice.
That is the prediction…2050 with 66% likelihood. I do expect this prediction to be misinterpreted and misquoted in the near future, but hopefully with this focused statement most of the previous misrepresentation we’ve seen regarding this topic can be avoided.
Did they give a confidence level for the projected increase in Antarctic sea ice?
Not that I saw. The only thing I know of from the IPCC concerning the SH sea ice increase/decrease timing comes from AR5 in figure 12.28.
And they couldn’t match historical satellite observations even then.
That is discussed in the report.
And they still haven’t explained why Antarctic ice is increasing under supposed global warming.
Sea ice ?
They haven’t provided much commentary on SH sea ice either way in any of the reports. It’s not clear when or even if extents in the SH will start declining. Even under RCP6.0 from AR5 the summer minimum extent is modeled to begin its decline around 2070 while the winter maximum begins its decline around 2030, but there is a huge amount of uncertainty that causes any predictions in this regard to be accompanied with low confidence. AR6 discusses SH sea ice in chapter 9 with helpful commentary on the state of the science in regards to future projections. Despite improvements AR6 still concludes there is low confidence on the projected behavior of SH sea ice either way.
It’s my understanding that the models generally project more warming for both poles than the overall globe. This report talks about projections for the Arctic but is almost silent about the Antarctic, strongly suggesting that the expectations for the poles are quite different. Have there been recent changes to the general models or is my recollection flawed?
“at least once before 2050” and “more frequent occurrences for higher warming levels” So the prediction is less than one Wadham before 2050.
What is “less than one Wadham before 2050” and how does it related to the IPCC AR6 prediction?
Wadham is a reference to Peter Wadham, who is well known for his claim that the Arctic will be ice free by 2015 or so
I know who Wadham is. What I don’t know is how that is relevant to AR6 or what “less than one Wadham before 2050” even means.
Anybody other UK readers on this blog want to put their head through the TV screen when the BBC news comes on, and that idiot Shukman or even bigger idiot Harrabin are screeching about thermaggedon?
I’m sick to the back teeth with the rubbish they spout.
Unfortunately, they are very convincing even without providing any evidence.
*Any other
Ruddy predictive text
I have to leave the room, to save both the TV and myself
You should watch a good movie instead. Don’t torture yourself trying to make sense out of what delusional people are saying.
Watching them make sweeping statements about the climate that are patent lies is really hard to stomach. If I’d let myself shout at the screen I’d have lost my voice by now.
Lies such as.
Well, all of the twaddle about “extreme weather” event frequency increasing. Storms, floods, and wildfires are not increasing.
I gave up owning a TV in 1990. It solved this problem entirely.
I’m not allowed to give up my TV – the wife wouldn’t be able to watch “Love Island”.
Almost as bad as that climate pledge advert with all the kids demanding we do something.
That advert is truly awful – puts my teeth on edge.