
NOAA climate model known as the CFSv2 is predicting a La Nina event (boxed region) for the upcoming winter season of 2021-2022. Source NOAA/CPC
Paul Dorian
Overview
La Nina conditions (cooler-than-normal water) developed early last year in the equatorial part of the Pacific Ocean and then intensified some during the past winter season. In the first several months of this year, water temperatures in the tropical Pacific Ocean have trended towards neutral, but there are signs of a resurgence in La Nina as we head towards autumn. In fact, there are signs right now that suggest the resurgence may already be underway in the central Pacific Ocean. The return of La Nina could have implications on global temperatures and also on the upcoming winter season of 2021-2022.

Warm (red, none shown) and cold (blue) periods in this table are based on a threshold of +/- 0.5oC for the Oceanic Niño Index (ONI) [3 month running mean of ERSST.v5 SST anomalies in the Niño 3.4 region (5oN-5oS, 120o-170oW)], based on centered 30-year base periods updated every 5 years. La Nina conditions developed in the spring of 2020 and continued into the spring of this year, but has been trending towards neutral in recent months. Data source: NOAA/CPC
The Pacific Ocean and signs of a resurgence in La Nina
The Pacific Ocean is the largest on the planet, covers more than 30 percent of the Earth’s surface, and is bigger than the landmass of all the continents combined. The warm waters of the equatorial Pacific Ocean store a great amount of latent heat compared to cooler waters and breed a great deal of convection which impact downstream ridging and troughing in the atmosphere. As such, its sea surface temperature (SST) pattern has a tremendous influence on all weather and climate around the world and the more anomalous the sea surface temperatures, the more the impact can be on the atmosphere around the world. The El Nino-Southern Oscillation (ENSO) is a recurring climate pattern involving changes in the temperature of waters in the central and eastern tropical Pacific Ocean. El Nino warmer-than-normal water) and La Nina (colder-than-normal water) are the extreme phases of the ENSO cycle; between these two phases is a third phase called ENSO-neutral.

The plot shows forecasts made by dynamical and statistical models for sea surface temperatures (SST) anomalies in the “Nino 3.4” region for nine overlapping 3-month periods. Many of the models suggest the current nearly neutral conditions transition into a resurgent La Nina episode as we into the upcoming fall and winter seasons. Data source: IRI/CPC
Several independently-made computer forecast models support the idea of a change in the central part of the tropical Pacific Ocean by the fall of 2021 from the current near neutral conditions to one featuring La Nina once again. The plume of El Nino Southern Oscillation (ENSO) model forecasts (see plot) generated in mid-June indicate a resurgence of La Nina conditions is likely to take place by later this summer and continue through autumn. Indeed, some models (e.g., NOAA’s CFS v2) are predicting La Nina will last right into the winter of 2021-2022 with sea surface temperatures as much as 1.0°C below-normal in the “Nino 3.4” region (i.e., central tropical Pacific Ocean) during December/January/February.

The trend of the Southern Oscillation Index (SOI) is up for the last 30 days signaling that a resurgence of La Nina may already be underway in the central Pacific Ocean. Source: The Queensland Government (Australia), The Long Paddock
Teleconnection indices are suggesting a resurgence in La Nina conditions across the equatorial Pacific Ocean may already be underway. Specifically, these types of indices can be tracked to provide information on pressure patterns across the Atlantic and Pacific Oceans which, in turn, can directly impact winds and sea surface temperatures. Specifically, the magnitudes of these indices which can be in positive or negative territory can provide clues about upcoming wind changes and sea surface temperature patterns. Two closely-related teleconnection indices that provide clues about the North Atlantic Ocean are known as the North Atlantic Oscillation (NAO) and Arctic Oscillation (AO).
For the Pacific Ocean, there is a metric known as the Southern Oscillation Index (SOI) which is directly correlated with the pressure differences between Tahiti and Darwin. This index can signal changes in wind flow and sea surface temperature patterns providing us with clues on the potential development and/or intensification of El Nino or La Nina. Sustained negative values of the SOI lower than −7 often indicate El Nino episodes are underway. These negative values are usually accompanied by a decrease in the strength of the Pacific Trade Winds and sustained warming of the central and eastern tropical Pacific Ocean. Sustained positive values of the SOI greater than +7 are typical of a La Nina with waters in the central and eastern tropical Pacific Ocean becoming cooler during this time. In recent days, the SOI has increased noticeably while in positive territory – perhaps a significant early sign of a resurgent La Nina.

In general, an El Nino episode in the tropical Pacific Ocean tends to cause a spike in global temperatures and there is often a noticeable drop off with La Nina as has occurred during the past several months. Data source: Dr. Roy Spencer, University of Alabama at Huntsville (UAH)
Impact on global temperatures
What goes on in the Pacific Ocean in terms of sea surface temperatures (i.e., El Nino, La Nina) can indeed have an impact around the world with respect to global temperatures in the lower part of the atmosphere. In recent years, the number of El Nino episodes have surpassed the number of La Nina events and global temperatures have often reacted with noticeable spikes. For example, temperatures spiked in 2016/2017 following a strong El Nino event and they had a secondary peak in 2019 associated with a second El Nino episode in the tropical Pacific. Prior to that, strong El Nino events that centered on the years of 1997/1998, 2009/2010 and 2015/2016 were associated with sharp upticks in lower atmosphere global temperatures. In times of La Nina such as during 2007/2008 and 2010/2011, there have been noticeable downturns in global temperatures of the lower atmosphere.
Since the most recent El Nino incident of 2018/2019, La Nina has taken control and global temperatures have responded accordingly. In fact, there has been quite a noticeable drop in global temperatures over the past several months to the point that levels are nearly normal on a worldwide basis as of the latest reading in June 2021. If La Nina does indeed have a resurgence later this year, global temperatures could respond by holding at nearly normal levels or perhaps even falling to below-normal levels.

In a typical La Nina winter, there is a strong polar jet across Canada and the US and colder-than-normal conditions from Alaska to the Northern Plains. In addition, La Nina winters are often warmer and drier than normal in much of the western and southern US. As a word of caution, there are other factors that can play important roles in winter weather across the nation including sea surface temperature patterns across the North Atlantic Ocean and also stratospheric temperatures at high latitudes. Source NOAA/NCEI
Potential impact on the upcoming winter season
In terms of the upcoming winter season of 2021-2022, La Nina could be an important factor depending on its magnitude, longevity and specific location. Typically, this type of oceanic sea surface temperature pattern leads to a strong polar jet across Canada and the US and colder-than-normal conditions from Alaska to the Northern Plains. In addition, La Nina winters are often warmer and drier than normal in much of the western and southern US. One word of caution, however, is that while the Pacific Ocean sea surface temperatures are potentially very important in terms of impact on winter weather across the US, other factors play a role as well. For example, sea surface temperatures pattern in the North Atlantic are often critical; especially, across the central and eastern US and even stratospheric temperature anomalies in high latitudes can play a crucial role.

The winter of 2020-2021 can be characterized as a “La Nina type” of season, bit the temperature anomalies (left) were rather atypical with warmer-than-normal conditions across the Northern Plains and colder-than-normal in the south-central states. Precipitation anomalies (right) has some likeness of a “typical” La Nina winter with generally drier-than-normal conditions in California, Texas and Florida. Source: NOAA/NCEI
Last winter can be safely characterized as a “La Nina” winter season and some of the “typical” results actually did take place in terms of precipitation anomalies. However, the temperature pattern across the US turned out to be somewhat “flipped” from the typical La Nina winter. Specifically, there were drier-than-normal conditions last winter from Florida-to-Texas-to-California as is typical, but temperatures were actually above-normal in the Northern Plains and below-normal in the south-central US – contrary to the usual La Nina pattern.
In the Mid-Atlantic region, any impact on snowfall in the Mid-Atlantic region from La Nina last winter was very dependent on location. While snowfall was well above-normal in most areas to the north of the PA/MD border such as the northern and western suburbs of Philly and New York City, it was generally below-normal south of the Mason-Dixon Line including in and around the Washington, D.C. metro region.
Meteorologist Paul Dorian
Peraton
peratonweather.com
Follow us on Facebook, Twitter, YouTube
This July inTexas has been quite wet, as unlike California, we can get rain any time of the year. What seems to matter here is how much rain overall,not just in winter.
What part of texas? Houston, or the Pan Handle?
Marble Falls, west of Austin in the Hill Country. It is going off Austin TV weather reporting, though.
We have had a lot of rain the last several weeks in the Bryan/College Station area – roughly between Austin and Houston. One afternoon 3 weeks ago I had 5″ in my rain gauge. This happened over the course of several hours. Was not widespread but extremely heavy for three hours. The creek/ditch next to my property came up to the lower parts of the yard. And then it overtopped the culvert in the road, which limits how much I’ll ever see. The temps this July have been running about 10F below average. Pretty unusual start to Summer. Next week to be much drier and back to normal temps.
pretty good monsoon so far this summer in central Arizona
Flip a coin.
Schellnhuber from German PIK and his complices flipped a faked coin with El Niño indicators on both sides in 2019, were proud, no other model showed a sign of El Niño, only theirs, with observation data, model data, sophisticated how ever.
We know the result, even with certainely 2 La Niñas in a row.
Well done Schelli, thanks for the proof of credibility 😀 😀
Does the PIK ever predict colder temperatures?
Not if they want to keep their contributions from the gullible rolling into their wallets!
It would be interesting to see what Joe Bastardi says.
Actually Joe D’Aleo is the ENSO guru at WeatherBell and he seems to favor the La Niña, although he isn’t all in yet.
CO2, GLOBAL WARMING, CLIMATE AND ENERGY
by Allan M.R. MacRae, B.A.Sc., M.Eng., June 15, 2019
https://wattsupwiththat.com/2019/06/15/co2-global-warming-climate-and-energy-2/
[excerpt]
This formula works reasonably well back to 1982, which is the limit of my data availability.
5. UAH LT Global Temperatures can be predicted ~4 months in the future with just two parameters:
UAHLT (+4 months) = 0.2*Nino34Anomaly + 0.15 – 5*SatoGlobalAerosolOpticalDepth (Figs. 5a and 5b)
6. The sequence is Nino34 Area SST warms, seawater evaporates, Tropical atmospheric humidity increases, Tropical atmospheric temperature warms, Global atmospheric temperature warms, atmospheric CO2 increases (Figs.6a and 6b).
In 2002, co-authors Dr Sallie Baliunas, Astrophysicist, Harvard-Smithsonian, Dr Tim Patterson, Paleoclimatologist, Carleton U, Ottawa and Allan MacRae, P.Eng. (now retired), McGill, Queens, U of Alberta, published:
https://friendsofscience.org/assets/documents/KyotoAPEGA2002REV1.pdf
1. “Climate science does not support the theory of catastrophic human-made global warming – the alleged warming crisis does not exist.”
2. “The ultimate agenda of pro-Kyoto advocates is to eliminate fossil fuels, but this would result in a catastrophic shortfall in global energy supply – the wasteful, inefficient energy solutions proposed by Kyoto advocates simply cannot replace fossil fuels.”
Allan MacRae published in the Calgary Herald on September 1, 2002, based on communication with Dr Tim Patterson:
https://wattsupwiththat.com/2009/01/10/polar-sea-ice-changes-are-having-a-net-cooling-effect-on-the-climate/#comment-63579
3. “If [as we believe] solar activity is the main driver of surface temperature rather than CO2, we should begin the next cooling period by 2020 to 2030.”
MacRae updated his global cooling prediction in 2013, based on cold events that occurred starting circa 2008 near the end of Solar Cycle 23:
https://wattsupwiththat.com/2013/12/02/study-predicts-the-sun-is-headed-for-a-dalton-like-solar-minimum-around-2050/#comment-1147149
3a. “I suggest global cooling starts by 2020 or sooner. Bundle up.”
________________
THE REAL CLIMATE CRISIS IS NOT GLOBAL WARMING, IT IS COOLING, AND IT MAY HAVE ALREADY STARTED
By Allan M.R. MacRae and Joseph D’Aleo, October 27, 2019
https://wattsupwiththat.com/2019/10/27/the-real-climate-crisis-is-not-global-warming-it-is-cooling-and-it-may-have-already-started/
For hundreds of extreme-cold events worldwide, see
https://electroverse.net/category/extreme-weather/
SOUTH AMERICAN CROPS HEADED FOR CATASTROPHE AS ANTARCTIC BLASTS PERSIST
July 19, 2021 Cap Allon
Production numbers continue to be slashed every time a new forecast is released. As it stands –and before the latest rounds of polar cold hit– 88% of Brazil’s corn is already in “poor or average condition” … with a further “significant reduction expected”.
WINTER BITES HARD IN AUSTRALIA, U.S. WHEAT CROPS IN SERIOUS TROUBLE, + MORE RECORD GAINS POSTED ACROSS GREENLANDJuly 15, 2021 Cap Allon
Earth’s average temperature is below the 30-year average. Natural, solar-driven global warming is over. There is no “climate emergency”.
The mainstream media obsesses about a ~4-day heatwave in the NW USA and says nothing about these extreme-cold events all over the world.
Earth is cooling, not warming – the global warming scare is a pack-of-lies – a deliberate 50-year fraud – wolves stampeding the sheep..
WINTER BITES HARD IN AUSTRALIA, U.S. WHEAT CROPS IN SERIOUS TROUBLE, + MORE RECORD GAINS POSTED ACROSS GREENLAND
July 15, 2021 Cap Allon
Earth’s average temperature is below the 30-year average. Natural, solar-driven global warming is over. There is no “climate emergency”.
AN INTENSE, EARLY-SEASON CHILL HAS BEEN “RAVAGING” EAST AFRICA’S CROPS
July 7, 2021 Cap Allon
As a result of the historic cold, the supply of fresh produce in east Africa has declined dramatically in recent months, sending prices soaring.
100+ MILLION AMERICANS TO SUFFER SUB-FREEZING COLD, AS NORTHERN HEMISPHERE SNOW MASS CLIMBS TO A HISTORIC 2,400 GIGATONS
April 21, 2021 Cap Allon
A monster upper low will intensify Weds and deliver a brutal late-April freeze to North Americans. Heavy snow will accompany the cold, and will drive NH snow mass –which already stands at 700 Gts above the 1982-2012 average– even higher. Prepare.
ENGLAND’S COLDEST APRIL SINCE 1922, GERMANY’S CHILLIEST SINCE 1917
April 20, 2021 Cap Allon
It may be late-April, but spring 2021 is a no show across much of Europe. The continent is suffering a climatic reality similar to that of the previous prolonged spell of reduced solar output: not since the Centennial Minimum (1880-1920) have Europeans suffered an April this cold and snowy.
AUSTRALIAN’S BRACE FOR “COLDEST-EVER JULY TEMPERATURES” AS POLAR FRONT BRINGS SNOW TO SUB-TROPICAL QUEENSLAND
July 21, 2021 Cap Allon
Plus, “Cosmic rays are bad–and they’re going to get worse”.
Don’t want to have any more new cold records, do we mate?
HISTORIC COLD SWEEPS EASTERN AUSTRALIA (JUST AS THREDBO WEATHER STATION -THE COLDEST SPOT IN AUSTRALIA- CONVENIENTLY GOES OFFLINE)July 22, 2021 Cap Allon
On what was forecast to be Australia’s coldest July day in history, the coldest spot in Australia is missing from the observations…
Do tell us more about the global warming crisis.
GRAND SOLAR MINIMUM: FOUR SOUTH AFRICAN TOWNS JUST SET THEIR COLDEST TEMPERATURES EVER RECORDED
July 23, 2021 Cap Allon
A lackluster sun is decreasing the energy of the jet streams, reverting their usual straight ‘zonal’ flow to a wavy ‘meridional’ one, which, in the case of SA this week, is sending masses of frigid polar air unusually-far north.
Note how I correctly guessed today’s move on TTs 3.4 graph in my comment from yesterday. The new sunspot in the north will work its way around the edge late tomorrow.
… https://sdo.gsfc.nasa.gov/
“SNOWSTORM IN AFRICA!” — SOUTH AFRICA SMASHES *AN ADDITIONAL* 19 ALL-TIME LOW TEMPERATURE RECORDS OVER THE PAST 24 HOURS
July 24, 2021 Cap Allon
“I have never had to drive through a snowstorm in Africa before.”
Watch how emerging sunspots will cause temps to shift on TTs 3.4 graph. Imo, this last strong groupings of northern sunspots were the reason for the recent plunge in temps in the 3.4. Now that new large sunspot region in the south has caused a lessening in the rate of the temp drop. Temsp should move sideways over the next several days. It then looks like new northern sunspots will come around the edge after several days. Those groups should cause the 3.4 trend to drop once again in around 2 or 3 days from now.after they emerge, or so goes my concept.
Joe Bastardi was saying back in February that the La Nina would fade and then come back later in the year. not a bad 6 month forecast.
NASA published a paper a few years ago that said the great drought of the 1930’s was thought to be caused by persistent La Nina conditions. The paper claimed that those conditions caused a shift in the jet stream that picks up moisture from the gulf and delivers it to the middle of America. La Nina conditions shifted it south ward was the conclusion
A paleo study covering the past two or three thousand years, published a couple of years ago, and likely covered on WUWT, was based mainly on sediments in lakes of the upper Great Plains . It results said that the 1930 drought was a minor example of repeated droughts for the central plains. I would suspect that the dust was not a normal part of the pattern.
dust <– farming
See:
The Worst Hard Time: The Untold Story of Those Who Survived the Great American Dust Bowl
by Timothy Egan
and then there’s the tree ring study showing that the American West is experiencing a once in a millenium drought…
Tree ring study. Now that’s funny.
Regardless there have been much worse droughts in the West in the last 1000 years.
Droughts lasting over decades.
The dust was a Man made problem. It resulted from clear cutting trees to create farmland which in turn eliminated vital Wind Breaks. Once the drought hit and the topsoil dried out, unabated winds carried the dry dusty soil aloft
There were no trees to cut on the great plains …. it was all grassland. If you want to argue that the farming practices caused the soil erosion you might have a point but your tree cutting is pure BS.
Great Plains, get it? The buffalo didnt have to fight their way through deep dark forests in their treks between northern Canada and Mexico.
Prarrie grass was so tall it hid men riding through on horseback. That grass had to be removed in order to plow and sow.
Often, little attention was paid to the fact that the land is not totally flat and that feqquent heavy rainfalls (in some areas everyone know to pull off the road when a thunder storm approaches) always produce ground water that flows downhill, no matter how inconspicious down is.
No ground cover and heavily eroded soil losing all its organic content, then a dry spell >> lots of dust.
Region 3.4

I still think that this trends in unison with the emergence of sunspots in the northern hemisphere.
La Niña – did it ever go away?
I think not.
Over the summer, it was neutral
Yep
Not according to NOAA. As shown in the article, NOAA say La Niña conditions have persisted during each 3-month centred period over the past 10 months.
If you read the article here completely you will find out that my answer was correct..
Krishna
“Neutral” relates to some ratio of meteorological numbers.
But the underlying drivers of La Nina never went away – strong upwelling (look at the anchovy fishery) and strong trades. A real El Nino requires a complete interruption of Peruvian upwelling. Trades can even reverse. That hasn’t happened for a long time. It will be a while before it happens again.
Meanwhile in Australia, it is currently Winter and colder than normal. Rainfall is lower than usual.
Up north it’s been a reasonably warm winter. We’ve also had quite a lot more rain throughout winter in the tropics on the east coast. Typically we’d get no rain at all during winter where I live, but this year we’ve had quite a bit. I’ve only had to buy water once so far, which is unusual.
it’s higher than normal in Oz AFAIK.
If you want cold and rain, come to Adelaide
Or if you want it even colder and rainier AND cloudier come to Melbourne
Actually John, we are only about 88% of our rainfall average so far. (My gauge).
John in Oz.
Because of the mix-up in replies, it seems I should have specified I’m in Adelaide, and at 530mm (20″) it wouldn’t usually be considered a wet place.
I’m not sure Australia’s rainfall is lower than usual. Average national rainfall in the 12 months to June was 42.93mm, ranking it 45th wettest out of the 61 years since 1960 and compared to the 1960-2021 average of 39.66mm.
Australia’s seven months of December 2020 – June 2021 averaged 59.25mm, ranking them 48th out of 61 corresponding periods since 1960 and compared to the 1960-2021 average of 50.58mm.
The BoM yesterday confirmed that the Indian Ocean Dipole has entered negative territory for the first time since 2016, strengthening westerly winds that push rainclouds across Australia … http://www.bom.gov.au/climate/enso/#tabs=Overview
Here in the Western Australia capital of Perth, we’ve had our longest run of consecutive rainy days since 2000 and our July rainfall is already well above the monthly average with 10 days left and nothing but more daily rainfall in the BoM outlooks.
Perth’s heavy cloud cover looks likely to push our July min way above average and the max a bit below average, but it’s worth noting the city’s July mean temperature was 13.2C from 1897 to 1990 (BoM #9034) and 13.2C from 1993 to 2000 (BoM #9225).
The
corruptedadjusted ACORN temps, which have only been slightly homogenised since the new millennium, show Australia’s mean temperature in the first six months of this year averaged +0.22C on a 1961-90 baseline – the sixth coolest in the 22 years since 2000.Australia’s crop harvest is heading toward record levels and the dams are filling or full from east to west, and with +0.22C mean temps over the past six months (and likely to fall further when July is tallied), this country might be excused for hesitancy in signing up to a 2050 zero net emissions target by shutting down most its reliable energy plants and mandating electric cars.
The Madden-Julian Oscillation looks likely to strengthen the IOD in coming weeks and most influencers such as SAM and ENSO seem primed for rainy cool weather through to the end of 2021.
Hopefully those conditions will be maintained into 2022 as vegetation is flourishing and when it dries in the hot months there’ll be plenty of bushfire fuel, which if ignited will spark calls for 2030 rather than 2050 zero emissions.
(The fortified ACORN temps, seems apropos somehow ; )
Fortifying acorns? Think of the squirrels!!!
Brisbane has been wet (my lawn and the golf club fairways have remained green) and very cold … longest sustained period that I can remember in about 30 years. 😉
And we’ve been quite wet here, just south of Brisbane but the Brisbane valley has got very little rain. Wivenhoe is only 40% and Atkinson’s is almost dry, which, for a la Nina is very unusual.
Hopefully the follow-up la Nina will sort it.
Here in SE Qld we have had a cold, wet winter, so far. 100/mm = 4 inches this July in a La Nona year. 2019 we had just that amount of rain for the whole year.
for some areas(like mine) western vic
east vic n nsw would say theyve had enough n then some thanks;-)
Rainfall definitely not lower over here in the West
Peru’s anchovy fishery going strong
https://www.undercurrentnews.com/2021/07/12/perus-seafood-landings-rocket-in-may-fishing-sector-expects-7-1-growth-in-2021/
La Niña conditions to continue.
I am always interested in the origins and utility of climate models, here for ENSO.
For example, the ‘outlier’ Russian INM-CM4/5 has the closest model ECS to observational energy budget methods. See a recent guest post for details.
Here, the outlier is Sintex-F (for which there are two versions, F1 prior to 2016 and an improved F2 thereafter. I found two papers evaluating skill.
One, from 2016 in JAMES, compared F1 to F1 for ENSO per se. The demonstrated skill was very good for both for 3 to 12 month time frames, F2 a bit better than F1.
The other was from 2020 in FiMS, looking at the sea level skill component of ENSO in Japan and Western South America, just for F2. Also very good in 3-12 month time frames.
So, looks like the purple square model predictions of a big deep La Niña are likely correct than all the spaghetti models. And the weather sequela that follow in the guest post are also backed up by NOAA at weather.gov, with present analysis available thru Mar 2021.
What happens when we through the minimum solar activity and a meridional jet stream?
What? Try again.
Old news. The real sign is not the modeling though it helps confirm it. What is telling in the article here is all model mention, and no mention of the first huge easterly burst as per the SOI. This is huge as it is likely the first indicator that this is coming, My point and its not to be a wise guy is to go to data confirmation in the real world first and look there, Models as we all know, can go a stray, Even of more interest if we see the impact season this year may be this linkage between mays temperature, the following hurricane season and the following December, Read it here. https://www.cfact.org/2021/07/09/if-only-i-believed-man-was-the-reason/. If only I believed man made climate change was the reason. Grants and funding and researach would be coming my way
You should pay close attention to this site. https://www.longpaddock.qld.gov.au/soi/
I’d appreciate it if you looked over my posting above re major changes in the usual ENSO pattern becaus of the huge volumes of cold water.
https://wattsupwiththat.com/2021/07/20/signs-of-a-resurgence-in-la-nina-and-the-potential-implications-on-global-temperatures-and-the-upcoming-winter-season/#comment-3296264
Here is another version of the index I have started watching. More variables than temp…
https://psl.noaa.gov/enso/mei/
Any idea on its reputation.
Not a model, index from real data…
The peak in Total Atmospheric Water currently occurs in May. Would be interesting to see how that correlates with the US hurricane season. Less atmospheric water in May would result in less cloud cover at the start of the boreal summer and more rapid warming of the tropical North Atlantic.
Joe,
You have pulled together fascinating data. The info and forecast presented in the cfact post should be followed, say once a month, here on WUWT (Anthony, Charles !) with updates on the progression. Sharing your knowledge like this is much appreciated.
Pete Parson of Oregon puts up a post once a month for a seasonal (3 month) forecast. He also uses analog years.
https://www.oregon.gov/ODA/programs/NaturalResources/Documents/Weather/dlongrange.pdf
He concentrates on Oregon. I live in Washington.
Data cannot fall outside the model range so data adjustments may be needed before COP 26 in November.
” In fact, there has been quite a noticeable drop in global temperatures over the past several months to the point that levels are nearly normal on a worldwide basis as of the latest reading in June 2021.”
–
What is the baseline for nearly normal?
1980-2021?
1850-2021?
The TempLS mesh anomaly (1961-90 base) was 0.671°C in June, up from 0.661°C in May. It was the fifth warmest June in the record. The NCEP/NCAR reanalysis base index fell by a lot – 0.21°C, making June about as cold as February. This was not reflected in the TempLS result.
–
I would have thought that nearly normal would be a lot lower than 5th warmest June on record
Only other comment is that the Australian BOM
removed the NASA forecasts of ENSO from their comprehensive review published fortnightly in January this year as it predicted a continuing deep La Nina which was at odds with the other 7 including the BOM.
Did not fit their narrative.
Now the NASA seems to have been more prescient long term and BOM has rapidly readjusted their forecasts in just the last 2 weeks!
The Southern Hemisphere has been cooling since 1585; the last year that perihelion occurred before the austral summer solstice in the present precession cycle and the orbital eccentricity currently in decline.
The Northern Hemisphere is currently warming.
Climate has no “normal”. It is always changing. Earth’s orbit never tracks the same path and orientation through space relative to the sun. Land masses are constantly moving.
Best to stick with the term “average” and nominate the period for the averaging.
One would think that by flipping 68 coins more than one would come up heads.
“One would think that by flipping 68 coins more than one would come up heads.”
–
Hmm.
You should have played poker in our med school. You might have lost nearly as much as I did.
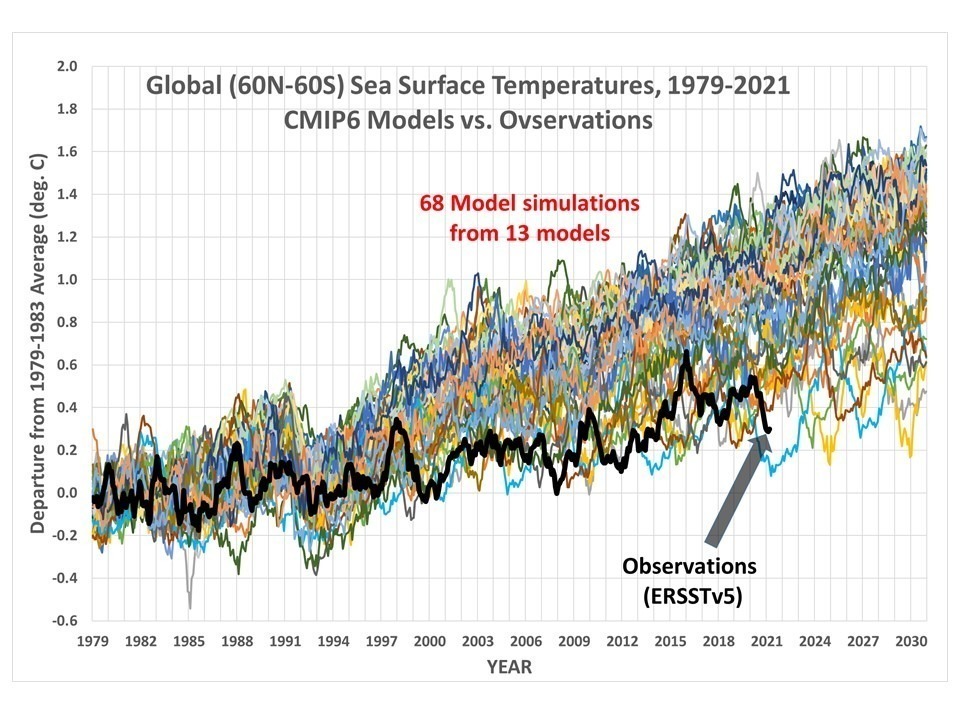
That graphic is from Dr. Spencer’s blog. It has been discussed extensively already. Here is the cliff notes version. First, of those 68 model simulations 50 of them are actually from the CanESM model. Second, it was discovered that Dr. Spencer actually pulled off the 2m temperature from the KNMI explorer instead of the SST so this isn’t an apples to applies comparison. It is likely that these 2 issues were just honest mistakes. I don’t think Dr. Spencer fully understood what he was looking at. Other people have since done an appropriate comparison with the true CMIP6 mean and it actually tracks reasonably well with observations.
So post the appropriate graph then….it’s not possible to determine the validity of your claim….
Here you go……

From: https://moyhu.blogspot.com/2021/04/no-global-warming-is-not-50-of-what.html
This was posted on Roy’s Blog by Nick Stokes ….
“Nick Stokes says:
May 6, 2021 at 6:21 PM
I didn’t exclude any in the graphs. The problem with Roy’s plot is that with 68 runs shown from 13 models, 50 came from just one model. I showed them, but in a paler color, so you could see how observed related to the rest. Then for the model TOS (SST) I adopted the common convention of showing just one run per model, so as not to weight the models that just happened to report a lot of runs. Even then, CanESM5 appeared twice, because some runs had a variant model label. Models were shown in different colors, so I invited readers to visualise the relation between observed and the other models. CanESM5 seems to be an outlier.
There is no rebuttal by Roy.
”There is no rebuttal by Roy.”
Who cares? The models that are wrong are wrong and the models that are right are also wrong (Pure coincidence)
Roy does not need to rebut rubbish.
The 68 model simulations are all that is available.
As Nick Stokes admits grudgingly
” the fact [is] that only a small subset of CMIP6 results have yet appeared. Roy (and I) use the results posted by KNMI Explorer”
So when Roy Spencer posts “An Earth Day Reminder: “Global Warming” is Only ~50% of What Models Predict”.
He is using the CMIP6 models available in the form that they are available.
He is comparing the mean of those models with the actual observations .
Global warming is only 50% of what was predicted by all of the the latest models available.
–
“CanESM5 seems to be an outlier.”
Did you ever defend /support RCP 8.5?
Not that big a difference between that chart and the one Dr. Spencer posted.
In both, real temperatures have been at or below the bottom of the projected temperatures from the beginning.
Your own data shows the same thing. All but a handful of models overshot on temperature.
So further adjustments to observed data to keep within the model range won’t be necessary at this time you think.
bdgwx
That graphic is from Dr. Spencer’s blog Should be excellent then
Other people have since done an appropriate comparison with the true CMIP6 mean and it actually tracks reasonably well with observations.
No, it does not.
The divergence of models and commonsense observations is grotesque.
“The divergence of models and commonsense observations is grotesque.”
Yes it isn’t it?! ……
https://pbs.twimg.com/media/Ek_hGypVMAA85Zp?format=jpg&name=medium
@Anthony Banton:
I’d never seen a graph with that close an agreement before, so even though it’s a tweet by PBS of a graph by Carbon Brief, I searched for the original and found it here:
https://www.carbonbrief.org/state-of-the-climate-2020-on-course-to-be-warmest-year-on-record
It’s using CMIP5, not CMIP6, and RCP4.5. No details on how they created the graph, but it doesn’t match any of the graphs in the cited reference:
Robust comparison of climate models with observations using blended land air and ocean sea surface temperatures
https://www-users.york.ac.uk/~kdc3/papers/robust2015/background.html
I’ll continue to mistrust PBS, Twitter and Carbon Brief.
I’m not Anthony Banton, would you PLEASE stop putting my name into his as @Anthony Watts Banton?
I’m sorry it came out that way, but that is NOT what I typed.
It looks like something that WordPress did automatically.
A test – I will only type ampersand Anthony to see what happens:
@anthony
As soon as I posted the above comment, WordPress changed ampersand Anthony to ampersandAnthony Watts. I will avoid that construction in the future, and again, sorry for the mixup.
“Models use RCP 4.5 forcings a after 2005”. Hmmm I wonder why that is?
Can anyone comment on how actual emissions fared after 2005 versus RCP 4.5? IIRC we emitted more than RCP 4.5.
bdgwx Reply to Chris Hanley July 20, 2021 6:46 pm
“That graphic is from Dr. Spencer’s blog. It has been discussed extensively already. Here is the cliff notes version. First, of those 68 model simulations 50 of them are actually from the CanESM model.
The 68 model simulations are all that is available.
As Nick Stokes admits grudgingly
” the fact [is] that only a small subset of CMIP6 results have yet appeared. Roy (and I) use the results posted by KNMI Explorer”
So when Roy Spencer posts “An Earth Day Reminder: “Global Warming” is Only ~50% of What Models Predict”.
He is using the CMIP6 models available in the form that they are available.
He is comparing the mean of those models with the actual observations .
Global warming is only 50% of what was predicted by all of the the latest models available.
–
When RCP gave 4 base models including the ridiculous 8.5 did anyone complain?
No they all jumped on the gross outlier as “business as usual”
The CanESM model.runs 50 model sims, based on different predicates, accepted by Gavin Schmidt, and they all run shockingly high.
Does he call for a retraction?
No he lauds their work.
bdgwx
” likely an honest mistake” . “I don’t think Dr. Spencer fully understood what he was looking at.”
What a polite way of smearing someone and his work.
–
“Second, it was discovered that Dr. Spencer actually pulled off the 2m temperature from the KNMI explorer instead of the SST so this isn’t an apples to apples comparison.
–
Your two snide assertions here are also wrong. The use of the word pulled to imply plucking from anywhere.
Pretending he used a different data set than he should have.
–
Nick Stokes explained the truth.
CMIP6 does not have a SST [TOS] available yet.
He had to use the only measure available [TAS]
Which means he compared Apples to the only other available and currently used Apples.
see Nick’s graph MIP6 TAS (ocean 60S-60N) virtually identical
–
Nick “Roy is using near surface air temperatures (TAS) restricted to ocean.
The CMIP version of SST is TOS, not yet posted for CMIP6.
Both were posted for CMIP5, but TOS came later.
I’ll look at the CMIP5 results, and show how TOS and TAS differ considerably
. CMIP5 TOS is quite close to observation in 1979-2020.
68 simulations have been published for TAS”
–
Note Roy was not looking at old, out of fashion cooler data but the modern data set CMIP6 with the only set of observations allowable.
Nick then did a modification of his own to show what it might look like if TOS was available [which it is not yet].
–
As you say, perhaps you have made some honest mistakes?
You could offer an honest apology.
The statement misuses the term “latent heat”. That term has a specific meaning in thermodynamics associated with a constant temperature phase change.
With regard the story, it appears that the finger of the next El Nino is already forming off South America:
https://earth.nullschool.net/#2021/07/19/1200Z/ocean/surface/currents/overlay=sea_surface_temp_anomaly/orthographic=-107.58,5.02,678/loc=-98.203,0.094
Some surface pools already 4C above average.
Technically, it is partially correct, although I’m sure the authors don’t understand that. The ‘stored latent heat’ can be released when the water freezes at the poles, and that heat is radiated out to space.
Having said that, it’s still wrong in that warm water has no more stored latent heat than cold water!
Technically, partially correct is still incorrect.
I believe the word they were vainly searching for was “enthalpy”. The stored heat times the volume, yes, for the Pacific Ocean it would be y-uuuuuuge, and for the warmer parts even y-uuuuuuuger.
Most of the ocean is 3C or less. The ocean surface temperature is limited to 32C peak and 30C average.
Increase in the ocean temperature below 500m is negatively correlated with net surface evaporation (evaporation minus precipitation). So the warmer the surface in a divergence zone (typically between 24 and 28C), the cooler the water below.
Only the top 100 to 200m of ocean is significant to climate in human timeframe. The wide surface distribution is more important to climate than the depths below 2000m.
Now that we have heard from the nutcase gallery, perhaps we can get back to discussing science.
The post that I was responding too has been deleted. I was not referencing the article above as it now appears I am doing.
One thing I find hilarious about this crackpot theory is that if anybody wanted to do it secretly, they would just do it at night
Listen to this crackpot and you can tell he doesn’t understand a thing he’s talking about.
I feel like puking every time I see that face of his. He is still an effing commie.
I guess I’m not going to get my Nobel prize. I have commented extensively on the volume of cold water in the equatorial region since the unusually drawn out development and sudden sharp drop of the 2015 el Niño.
A major change from the normal ENSO pattern was taking place. Instead of simple upwelling of water in the eastern equatorial band driven by trade winds, massive areas of cold water were slanting equatorward from the temperate zones of both hemispheres, encroaching on the mid ocean ENSO regions.
The cold water diluted both the el Niño protracting its development in fits and starts and resulted in termination of the el Niño with a precipitous drop in T right from the peak. La Niña, on the other hand was given a tremendous boost by the intruding cold water. It washed out early developments of the next el Niño over the past year which is now switching back to la Niña. Forget about a busy hurricane season now!
I believe this ‘new’ pattern is how the globe starts a long cooling phase. I wish Javier would at least look at this as I can see that NOAA doesn’t get it (perhaps they do but don’t like the implications)
Nooo…Texans do not want to be drier…we like our lovely rain this summer!
Last summer July and August were near perfect, and this year has been stacking up to look the same so far.
I moved down here the year from H8LL, 1998. It was enough to make me want to move north. I had never seen so many hot dry days in my life. I haven’t since then.
(DFW area)
I think it was 1998, (I was living in Humble, TX, that’s near Houston out by the Big Airport, and I know you’re not from Texas if you try to pronounce the “H” in Humble) there came a cold-front the end of November, initially the weatherheads were predicting snow, but there seemed less and less chance of that as the cold front approached, and it slowed down more than they originally thought. So initial predictions were for the front to arrive about Dec 1, it didn’t actually arrive until about Dec 5, and of course there was no snow, but it was still a hell of a blue norther, for that early, for Houston. And after that cold front, I don’t remember another cold front the rest of the winter. On Christmas Day I was outside, going to relatives, wearing a t-shirt and not worried about a jacket. That might have been the winter that hardened my resolve to get the f*** out of the Big sh**ty, a vow I didn’t accomplish until 2006.
It has snowed twice in December since then, once enough to build snowmen. After three floods, Robert can keep his rainy summers. If I wanted to live with this much rain, I would move to London, which is a fantastic place but not Texas.
As long as La Niña keeps the hurricanes at bay, I guess its worth the price, although some will want to dance with the devil to see the sun.
Only nine days of 100 degrees or more temperatures in all of 2020, in the DFW area. None so far this year but it could change next week.
https://www.weather.gov/fwd/d100data
Do researchers have any strong indications on:
1) what mechanism causes or creates El Niño and La Niña conditions in the Pacific Ocean
2) What are the secondary effects of both El Niño and La Nino, such as changes in prevailing wind distributions, frontal patterns, precipitation distribution, storm patterns and frequencies, etc.?
Is there a recommended source document or book on the meaning and regional effects of ENSO events? I find it difficult to draw any definitive guidance on what these ENSO events actually mean to the various regions in the US (Pacific northwest, southwest Pacific, southwest inland, northern Rockies, etc etc
It’s time you did a scholar search to pick which conflicting opinion you prefer.
Earth gets warmer, Pacific gets warmer El Nino.
Earth gets colder, Pacific gets colder La Nina.
–
El Nino and La Nina do not cause events, they are just part of the show.
–
Why hotter or colder ?
Not CO2 it is going up constantly?
Try clouds as a first approximation.
ENSO events are not black swan events, they don’t just randomly happen, they are too frequent and widespread to be totally random. Eddies are one thing, but a significant warming or cooling of the largest ocean on the planet which has a greater surface area than all land masses on the planet must have some mechanism that creates it, moderates it, etc.
ENSO refers to a pattern that appears to oscillate.
The term event is loosely applied to a larger than normal deviation from the median.
They have a semi episodic recurrence roughly 3 yearly.
–
The mechanisms causing warming and cooling are simple, cloud cover at the equator level, swirling currents of cold from the Antarctic up the South American western coast to name 2.
It bounces along in its own semi unpredictable way.
No black swans here.
A slightly grubby one from having a few extra El Nino’s in a row.
If we had as many La Nina’s in a row the short term alarmists would be parroting global cooling.
–
It would be nice to see a 3 year La NIna except our river will come up and flood us.
I had thought that with as much attention as has been paid to ENSO over the last several decades there ought to be one or probably several authoritative sources on the phenomenon, where it comes from, and what it does to weather. And that such would be well known to the readers and commenters and/or authors at WUWT.
Apparently not? Wow – where are all the real climate scientists these days? Are they all just spouting BS in the mainstream media? Surely there are some skeptics who have studied this stuff in detail?
Real scientific enquiry takes time – centuries in some cases. You can’t just get some celebrity talking head to pop up and spout rubbish on a whim – it’s not bloody CNN you know! 2024 is (I think) the centenary of the ENSO and El Nino/La Nina mechanisms being named but the processes are still being studied.
It’s a complex system to try to understand – the terms were coined less than a hundred years ago and scientists are still trying to understand all the ramifications and peripheral events that follow from El Nino/La Nina conditions. Arguably, this system may be one of the main drivers behind climate change, not some beneficial trace gas. Basically start searching online, get an overview, then start tracking down each of the terms used – that’ll be a start and you’ll get an idea of where to go from there.
Texas was dry last winter but has made up for it in 2021. Been a mild summer with regular rainfall. Lawn has never looked better in the 31 years of being a homeowner. Lots of rain in central Texas. Even areas that are usually dry are seeing regular rain (San Angelo).
We’ve probably had one of the longest sustained wet and very cold periods of our winter here in Brisbane, Australia, that I can remember in at least 30 years.
In other breaking news you’ll be pleased to know- “The climate phenomenon that brought Australia one of its wettest winters has been officially declared for this year.”
BOM declares negative Indian Ocean Dipole, tipping the odds towards more wet weather (msn.com)
But I know the burning question for you all is-
‘Will negative events get more common?
Research has showed extreme, positive dipole phases, like that of 2019, could be more frequent in future.
But Australian National University climate scientist Nerilie Abrams said the future frequency of negative events were more difficult to predict.
“There’s an interplay between the overall warming of the ocean and what’s happening with the variability of the Indian Ocean Dipole,” she said.
“But at the same time we know that the ocean is warming because of global warming, so there’s a balancing of those two different effects that will ultimately determine what the impact on the Australian landscape is.”‘
Well that settles that science.
They know nothing and have a 50% accuracy in predicting the sign of any change. The climate models are worse than useless because they produce nonsense that is promulgated as gospel. Eventually historical records get adjusted to agree with the models.
Here in New Zealand it has been a cold winter too. This encourages our government funded National Institute of Water and Atmosphere to bang on about near ocean hot spots. Something the public cannot experience directly
haha in the 3 days since that 1st graph data came out, water temps have risen sharply in the central part !!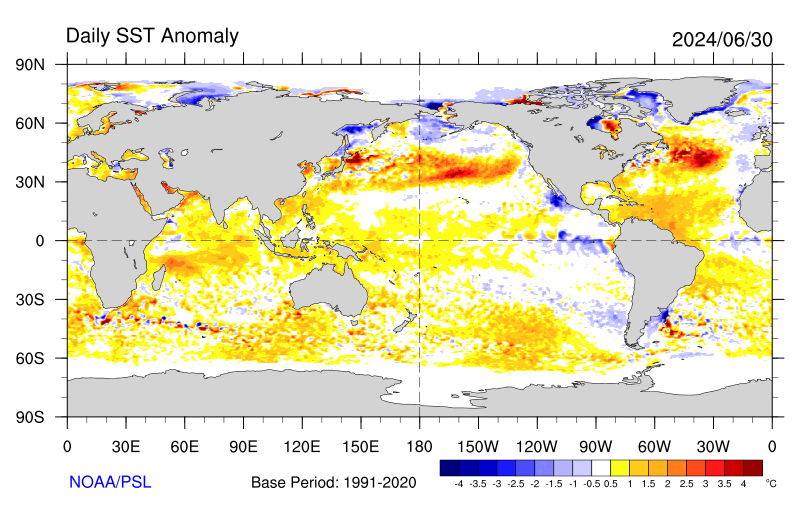
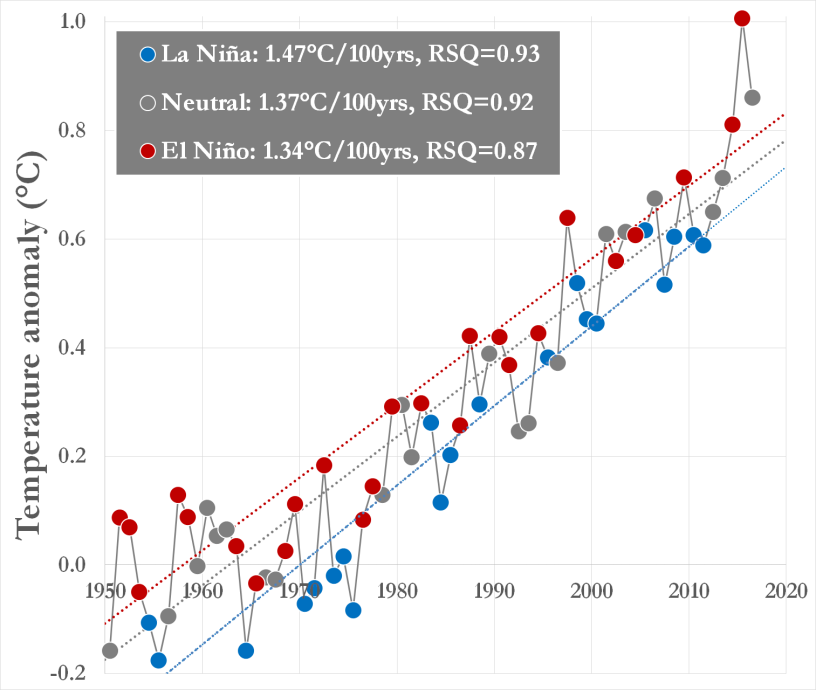
This chart is the wrong one. A La Niña is defined as followed:
La Niña criteria
Not compared to the base period 1971-2000.
There is now a 55% chance the predictions of this paper have been right:
https://agupubs.onlinelibrary.wiley.com/doi/full/10.1029/2020EA001223
That would be the comeback of the sun in climate research.
it seems almost certain we’ll have a relatively rare back-to-back La Niña cycle starting at the end of this year, which occurs about 17% of the time with La Niña cycles.
Even if it is a weak one, we still should see UAH 6 hit -0.2C by around the middle of next year, and if it’s a moderate to strong La Niña, it could even hit -0.3~-0.4C; which would make Leftist heads explode as CMIP6 models predicted we’d be at +1.4C by now—oops.
This double La Niña will finally offset the 2015/16 Super El Nino event, and both the PDO and AMO seem to show they’re close to reentering their 30-year ocean cool cycles:
It’ll soon be impossible for Leftists to keep the CAGW hoax going when global temps start to flatten, and then eventually start to fall during the PDO/AMO cool cycles.
“Even if it is a weak one, we still should see UAH 6 hit -0.2C by around the middle of next year, and if it’s a moderate to strong La Niña, it could even hit -0.3~-0.4C; which would make Leftist heads explode as CMIP6 models predicted we’d be at +1.4C by now—oops.”
Why do you think that a short-term cold ENSO cycle is significant in AGW terms?
And those of us who know that it is NV and nothing to do with AGW are nowhere near having our “heads explode”.
Maybe because I’m a retired Meteorologist and certainly not a “Lefty”
Try looking at the UAH v6 graph, EN and LN come and go but the warming trend line continues upward ….
On the planet I live on, recent temperatures look like this:
UAH_LT_1979_thru_June_2021_v6.jpg (749×432) (drroyspencer.com)
“On the planet I live on, recent temperatures look like this:”
( Actually, If you mean the temporary dip as displayed by ALL previous La Ninas – then that is independent of any forcing on climate – it is a feedback of the release of heat via WV) … as shown in my graph above.
The AGW trend marches on as LNs and ENs come and go.
And actually they don’t.
As those “temperatures” are calculated by algorithm from radiometer data taken by satellite of a broad swathe of Earth’s atmosphere.
Decidedly NOT ON the planet you ( and I ) live on.
The same data is also used by RSS – and their trend agrees pretty well with the surface indices.

UAH v6 being by far the cold outlier …..
UAH is in best agreement with reanalysis and 7 radiosonde datasets (except NOAA/RATPAC). Something RSS and surface datasets are not.
So the question is more like who is cherry picking.
Maybe because I’m a retired Meteorologist and certainly not a “Lefty”
Becoming a missionary for AGW views means you have left any meteorological science training far behind you.
“It is certainly a viewpoint of Lefties, much as you choose not to to accept such a label.
–
Is that because you feel “Lefties are known for their inability to accept science?
–
You show a graph of weather events on a short term background of slightly rising temp 1950- and claim that El Nino’s and La Nina’s have no effect on GW. That it is NV.
Perfectly valid.
–
To use this to respond to your own question
“Why do you think that a short-term cold ENSO cycle is significant in AGW terms?”
is sheer humbug and hypocrisy.
Unworthy of you
–
Why do you think that a short-term cold ENSO cycle is significant in AGW terms?.
–
The argument being made is that the AGW might be purely NV.
El Niño and La Niña do not cause global warming and cooling. They are part of the response to variations in energy from the sun entering the earths atmosphere.
two causes, variation in sun output (minor) and variation in cloud cover, particularly at the equator (major). One would expect a meteorologist to know this and be prepared to discuss it.
–
Due to exaggerated claims of potential warming any short or longer term variation causing cooling is a potent argument, in the short term, against exaggerated claims the other way.
Even a 3 year run of La Nina’s would cause enough cooling to bolster NV arguments, even though they would be as equally spurious as the short term warming arguments you are espousing.
Cherry-pick much?
Yes, I know UAH v6 is cherry-picking
That’s one hilarious graph you got there, Anthony-san. Best laugh all day— thank you.
in reality, the warming trend from 1850~1978 was a blistering 0.02C/decade…. Oh, the humanity; we’re all gonna die unless we blow $100’s of trillions on CAGW mitigation…meh..
Then the PDO, and later, AMO warm cycles kicked in and we’ve enjoyed 0.14C/decade of warming since 1979, as occurred from 1913~1945..
The AMO/PDO will soon both renter their respective cool cycles and we’ll suffer 30+ years of global cooling as we did from 1945~1978 and this idiotic farce will be toast.
The silly CAGW scam is a Leftist control and money grab, not an actual physical phenomenon..
Cheers, mate!.
Yes I know UAH TLT V6 is “hilarious”
You’re not up to speed (LOL- I know you know this but choose to (D) word it)…
Forcing from CO2 did not materialise to any extent until after the “Global Dimming” aerosol period after industrial ramp post WW2.
For your delectation ….
http://www.climatechange2013.org/images/figures/WGI_AR5_Fig8-18.jpg
CO2 forcing at around 1980 ~ + 1.0 W/M2
CO2 forcing now ~ + 3.0W/M2
“The silly CAGW scam is a Leftist control and money grab, not an actual physical phenomenon..
Cheers, mate!.”
If you say so ….. and don’t mention it “mate”
I can’t believe that people are paid to make this appalling rubbish up. I think I’m going to throw up I’m that disgusted by this.
Ummm… The CAGW Hoax hypothesizes ECS is somewhere between… oh,…. let’s say…1.4C~5.0Cish and, of course, won’t give a hypothetical mean estimate out of fear of disconfirmation, ‘cuz CAGW isn’t science, it’s a scam….
Net ECS will likely be around 0.8C +- 2SDs, which not only isn’t a problem, it’s a net benefit.
Cheers, mate.
The jet stream pattern over North America typical of La Niña will fall further south the US during the winter. It will cause a weak solar wind during this cycle. Solar wind spikes will push the jet current southward.
ENSO influences solar wind??
The solar wind affects the state of the polar vortex. Jumps in the solar wind will cause a meridional jetstream.
A weak solar wind disrupts the latitudinal circulation along the equator, so I think La Niña may be weak. However, in winter, the stratosphere falling over the pole is critical to the weather.
https://www.cpc.ncep.noaa.gov/products/stratosphere/strat_int/
Here in NH, we had an unusually warm and dry June. The dryness was a continuation of state wide, (although variable in intensity) drought conditions of over a year duration. This, of course was due to “Global Heating”. Then this month we have had the opposite – cool, and very rainy. So rainy in fact, that it is probably close to third place in the record books so far, and there are still 10 days to go. The drought has been obliterated in a matter of a few short weeks. This, of course, is due to “Climate Change”. Science.
someone give the ENSO meter a kick its going the wrong way for aus as it appears right now
What is a “normal” level? Is it the level prevailing for four-and-a-half billion years before SUVs?
Many comments on this thread about ENSO processes and aftereffects are blatantly wrong. It would be impossible for me to address them all, and based on past experience, it would be a waste of my time. So I won’t bother.
Regards,
Now, now, Mr. Tisdale. Don’t get upset about comments. Whadaya expect? Instead, please give us your informed opinion/prediction of the next 12 months of the ENSO. Thank you.
Bob,
Good that you are still taking an active interest.
It is true that there are a lot of misconceptions about ENSO.
I do not think it is a waste of your time to address some of the blatant errors by myself and others.
You have done posts in the past for Anthony and I would see this as an opportunity to do a piece on some of our said misconceptions.
I hold fairly firm views and may not want to take it all in but unbiased and informative opinion is always worth being presented.
Cheers.
Comment disappeared can it be reinstated please?
As interesting as these – and virtually all – conversations on WUWT are, we each miss the central point.
We have lost the argument, several years ago. By focusing on the facts (Bravo!), we ignore the environmental argument to feelings.
These people seek to instill fear.
Very simple.
No amount of factual commentary, as luscious as each may be, can satisfy the hunger created by fear.
The argument from facts is correct. And useless.
We have lost the debate folks.
The AGW storyline has evolved into a religious creed. Or should we say Screed?
Universal guilt is applied, thick as Marmite, on the unsuspecting public. We decry the salty flavor and they gobble it up.
With all due respect to ‘les marmitons’, this is how an addiction begins.
Of course you are fearful. We can help you. Confess your carbon sins and repent. Send money, blood and treasure.
Amplify this tens of thousands of times over the past two decades and we have Marmite World, where everything tastes the same and everyone eats the same.
Fear (salt) drives us back to the trough. We absolve ourselves (acknowledge our carbon sins). We are confessed and live again (pay your taxes and listen closely for the next Faustian bell).
Example. As a member of the USCGA, I heard a meteorologist present hurricane preparation info last night. He was accurate and articulate – and had clearly drank at the climate change hotel; where you can get in but can never get out.
His five word preface?
‘Despite the climate change deniers…’
Thanks for all the work done by the WUWT team and contributors.
Unfortunately, we are all rehashing eggs and ham while the world has moved on…to marmite.
Soon we will be in prison, eating our own…
Hey John not everyone who likes marmite has adopted the “environmental argument to feelings.”
Despite what sometimes seems like overwhelming odds against the Truth about the climate being not only not in “crisis” mode but actually being perfectly fine, the Climate Liars are not “winning”, and they know it. Thus the desperation and increasing shrillness of their alarmist cries. We must soldier on. Rage, rage against the dying of the light, and do not go gentle into that good night. To paraphrase Bob Dylan. Hee hee.
More La Nina would be bad news for the western USA. The weather has been unusually dry in Salt Lake City since about March 2020, and we could use a wet El Nino winter (we need the water).
When it’s dryer, the warmunists claim it’s climate change … when it’s wetter, the warmunists call it climate change … when it’s warmer, the warmunists call it climate change … and when it’s cooler, the warmunists call it climate change.
The rest of us just call it “the weather”.
These dry spells often last a minimum of several years. That means that it is most likely that we will have one more dry winter. Many of the creeks here in Northern California are bone dry right now. Even some of the larger ones. On the plus side it allows for a good look at the bedrock for gold.
I call her “the bitch” to remind me she causes problems !!! Cold is always more damaging than heat so it looks as if we are in for a difficult winter.
Awful news to us in Chile. Yeah the fisheries are booming with the cold sea water but this year has been very dry so far. Not as bad as 2019 yet but we have barely had any rain in July here in Santiago! The temps had been relatively normal but the past 3 days have been unseasonably warm. Hoping we get some rain before the month ends and then more before spring
bdgwx Reply to Chris Hanley July 20, 2021 6:46 pm
“That graphic is from Dr. Spencer’s blog. It has been discussed extensively already. Here is the cliff notes version. First, of those 68 model simulations 50 of them are actually from the CanESM model.
The 68 model simulations are all that is available.
As Nick Stokes admits grudgingly
” the fact [is] that only a small subset of CMIP6 results have yet appeared. Roy (and I) use the results posted by KNMI Explorer”
So when Roy Spencer posts “An Earth Day Reminder: “Global Warming” is Only ~50% of What Models Predict”.
He is using the CMIP6 models available in the form that they are available.
He is comparing the mean of those models with the actual observations .
Global warming is only 50% of what was predicted by all of the the latest models available.
–
When RCP gave 4 base models including the ridiculous 8.5 did anyone complain?
No they all jumped on the gross outlier as “business as usual”
The CanESM model.runs 50 model sims, based on different predicates, accepted by Gavin Schmidt, and they all run shockingly high.
Does he call for a retraction?
No he lauds their work.
The Pacific doesn’t store “latent” heat. It stores sensible heat. Latent heat has to be added to get vaporization, or the sensible heat converted to latent heat.
“In fact, there has been quite a noticeable drop in global temperatures over the past several months to the point that levels are nearly normal on a worldwide basis”
Mr Dorian uses the word normal over and over. What, exactly, is normal?
There’s no NORMAL, the correct word is average.
Did I hit the nail on the head or what. My comment from 27 hours ago “Watch how emerging sunspots will cause temps to shift on TTs 3.4 graph. Imo, this last strong groupings of northern sunspots were the reason for the recent plunge in temps in the 3.4. Now that new large sunspot region in the south has caused a lessening in the rate of the temp drop. Temsp should move sideways over the next several days. It then looks like new northern sunspots will come around the edge after several days. Those groups should cause the 3.4 trend to drop once again in around 2 or 3 days from now.after they emerge, or so goes my concept.”.
That is exactly what has taken place on TTs 3.4 graph since I made that comment. Stay tuned.
Midnight and TTs 3.4 graph warms up slightly. The new sunspots in the north are just coming into view. This should change the direction of the trend in the 3.4 region by the end of today.
So that did not pan out as anticipated. Temps have continued upward on the 3.4 graph every six hours as it is updated. It is possible that the reason for this is due to the strength of southern sunspot 2847 which is still very large comparative to recent sunspots. Plus the northern AR group which came around the edge the other day has yet to form a sunspot. For almost several weeks my concept fit in with every new sunspot. So I will keep watching to see what the future will bring.
Temps have now moved sideways over the last 2 updates on TTs 3.4 graph. I was only off by half a day on the shift. Possibly due to the strength of sunspot 2847 which has been the largest sunspot of this cycle to date.
This is late on the 27th. Temps have continued to drop steadily in the 3.4 region. There is now a new active region in the south which will come into view in several days. Temps in the 3.4 should stop falling around that time. There are no new active regions in the north due to show up in that time.
That last active region in the south ended up almost fading away. There was no change to the trend in the 3.4 region. New larger active regions are now coming around the rim of the sun, and the cooling trend in the 3.4 region has finally abated.
The trend in the 3.4 region has warmed over the last 2 updates. These new active regions are larger than the last small area.