Guest Post by Willis Eschenbach
I keep reading that one of the horrible terrible predicted consequences of the ~ 300-year gradual warming since the depths of the Little Ice in 1700 is the decrease in Arctic sea ice. Here are a couple of points of interest about that claim.
First off, before the current decrease in ice and glaciers in the Arctic and sub-Arctic regions, there was the increase in ice and glaciers in those regions. For example:
Villagers from deeply Roman Catholic south Switzerland have for centuries offered a sacred vow to God to protect them from the advancing ice mass of the Great Aletsch glacier.
Since the vow was established in 1678, the deal was simple: the citizens of the isolated mountain hamlets of Fiesch and Fieschertal would pledge to lead virtuous lives. In exchange, God would spare their homes and livelihoods from being swallowed by Europe’s largest glacier as it expanded toward the valley with heavy winter snows.
Global warming is making them want to reverse their prayers, and the Alpine faithful are seeking the permission of the Pope.
Now, you are welcome to believe that the reason that the temperatures started warming in ~ 1700 was the intercession of the Pope … but if you want a slightly more scientific explanation, you’ll be disappointed. Nobody knows why temperatures didn’t just keep dropping in 1700 to a true ice age. And nobody knows why temperatures didn’t simply stay cold, but instead started warming in 1700, although one thing is very clear:
It wasn’t CO2 …

Figure 1. Ljungqvist et al. Northern Hemisphere temperature anomaly, AD 1 – 1999
The takeaway message from Figure 1 is that increases and decreases in polar ice are not a sign of an impending apocalyptic Thermageddon™. Instead, they are an expected part of the natural variations in global temperature.
Second, it’s important to remember that the Arctic is not the only part of the planet with year-round sea ice. The Antarctic is generally overlooked by the failed serial climate doomcasters, for a simple reason—while Arctic sea ice has generally been decreasing since 1978, the start of the satellite measurements of global sea ice area, Antarctic sea ice has generally been increasing since 1978.
So what does the total global sea ice look like? Glad you asked. Figure 2 shows the global and hemispheric sea ice areas since 1978. The data is from NSIDC, NOAA’s National Snow and Ice Data Center.

Figure 2. Total and hemispheric sea ice areas.
Now, there are a couple of curious aspects to this record. First, the average total global sea ice over the period was 18.06 million square kilometers … and the most recent total sea ice area, in May 2021 was … wait for it … 18.13 million square km. Here’s what climate alarmists don’t want you to notice—there’s been no statistically significant overall trend in global ice area since we started keeping accurate records.
Next, just as with the warming since the Little Ice Age, nobody knows why Antarctic ice increased until 2014 … or why both Arctic and Antarctic sea ice areas plunged for a few years from 2014 to 2018 or so … or why since then the total ice area has completely rebounded to its long-term average. Here’s a quote from a 2019 paper on the subject (emphasis mine):
The Antarctic situation has been quite different, with sea ice extent increasing overall for much of the period since 1978. These increases have been far more puzzling than the Arctic sea ice decreases and have led to a variety of suggested explanations, from ties to the ozone hole; to ties to the El Niño–Southern Oscillation (ENSO), the Interdecadal Pacific Oscillation, and/or the Amundsen Sea Low; to ties to basal meltwater from the ice shelves. None of these has yet yielded a consensus view of why the long-term Antarctic sea ice increases occurred.
In the meantime, while the unexpected, decades-long overall increases in Antarctic sea ice extent are still being puzzled out, the sea ice extent has taken a dramatic turn from relatively gradual increases to rapid decreases. On a yearly average basis, the peak sea ice extent since 1978 came in 2014. Since then, the decreases have been so great that the yearly averages for 2017 and 2018 are the lowest in the entire 1979–2018 record, essentially wiping out the 35 y of overall ice extent increases in just a few years. This dramatic reversal in the changes occurring in the Antarctic sea ice will provide valuable further information to test earlier suggested explanations of the long-term Antarctic sea ice increases.
And remember … despite being unable to explain these mysterious increases and decreases in sea ice, despite being unable to explain why the world cooled from about 950 AD to the depths of the Little Ice Age, despite being unable to explain why the globe stopped cooling around 1700, despite being unable to explain why the current warming period started a hundred and fifty years before the modern rise in CO2 …
… despite all of that and much more that is unknown about historical and modern climate variations, alarmist scientists are quite happy to assure us that they know what the global average surface temperature will be eighty years from now, and to warn us endlessly that the Arctic will soon be ice-free. Yeah … that’s totally legit.
The good news is that people are starting to notice that fifty years of dire predictions have all cratered and that Dr. Richard Lindzen, Alfred P. Sloan Professor of Meteorology at the Massachusetts Institute of Technology from 1983 until his retirement in 2012 and author of over 200 peer-reviewed scientific studies of climate, was 100% right when he said:
Future generations will wonder in bemused amazement that the early 21st century’s developed world went into hysterical panic over a globally averaged temperature increase of a few tenths of a degree, and, on the basis of gross exaggerations of highly uncertain computer projections combined into implausible chains of inference, proceeded to contemplate a roll-back of the industrial age.
Switzerland recently held a referendum on signing up for more taxes to meet the insane Paris Climate Agreement commitments … and guess what? They soundly rejected them. Folks are waking up to the truth.
My suggestion? Don’t be the last one to get the memo. There is no climate emergency.
Regards to all of you,
w.
My Usual Quixotic Quest: Please, please, QUOTE THE EXACT WORDS YOU ARE DISCUSSING, so we can all know just what you are referring to.
I have posted your Where it the Climate Emergency? post, in a couple of forums.
Where Is The “Climate Emergency”? | PoliticalForum.com – Forum for US and Intl Politics
and,
Where Is The “Climate Emergency”? | US Message Board – Political Discussion Forum
The warmist/alarmist replies are hilarious
The first link appears to be a security risk theft of data warning from firefox
I didn’t have a problem with it using Firefox.
FF connected to it for me, but the address bar shows that it’s not secure because it’s not https. I think it will show that warning for any website anymore that’s not https.
Read some of the comments. You can sure get them riled! Keep up the great work!
These sorts of things might be droll, but they just degrade into name-calling, or in Tommy’s case, accusing people of drinking without evidence. You’re not changing any minds.
I’m not so sure. I managed to change the mind of at least one dude on YT with nothing but reason.
There are many people sitting on the fence, just a little nudge needed..
Drinking without evidence? It’s bad!
People, don’t drink alone at home with lights off! Go to a pub!
The people who counter adamantly will typically not be ‘changing’ their mind. The point is to have the argument articulated for passersby and those with open minds that rarely comment. I read WUWT comments frequently but actually post a comment rarely, many do. This is what creates the value of the argument: it’s on record and it exposes the absurdity, and lack of rationality of the alarmist position.
It’s kinda like someone boasting they are a great juggler that you never see taking their hands out of their pockets. You fight the fights that need to be fought; when they ‘degrade into name-calling’ everybody sees it for what it is.
I read a few replies. This was one of my favorites…
”Earthquakes and volcanoes are natural but still manage to bring disaster to man.”
I keep posting this quote by Thomas Sowell because it is so appropriate in these types of discussions – sorry for the repetition!. “It is usually futile to try to talk facts and analysis to people who are enjoying a sense of moral superiority in their ignorance”. I only read a few of the comments in the links you provided and they clearly demonstrated Sowell’s point.
The low Antarctic ice in 2017 was caused by Super El Nino of 2015-16 and weak winds:
https://www.washington.edu/news/2017/08/31/record-low-2016-antarctic-sea-ice-due-to-perfect-storm-of-tropical-polar-conditions/
The low Arctic years, ie 2007, record 2012 and 2016, were caused by summer cyclones.
Thanks, John. As my quote pointed out, that is indeed one of the many theories about the loss of Antarctic ice.
Unfortunately, that theory fails to explain why it didn’t happen in any of the other “Super El Ninos”. It also doesn’t explain why the correlation between SH ice area and the MEI is a pathetic -0.02 … and that is only improved to 0.023 by lagging the sea ice area by six months.
w.
The two prior Super Los Ninos, ie 1997 and 1982, in the satellite record were average Antarctic sea ice years for their decades. The difference, as the linked paper points out, was the lack of wind off the icy continent. SEN of 2015-16 was also warmer than 1997-98 and even more so than 1982-83.
The fact that Antarctic ice has trended upward during the satellite record is not at issue, only why 2016-17 was anomalously ,low.
As with Arctic lows, the reason was unusual weather events.
The trend in Arctic sea ice extent has been up since 2012 and flat since 2007. It fluctuates naturally on a roughly 60-year trough to trough and peak to peak cycle.
The world has warmed since the depths of the LIA during the Maunder Minimum mainly because of the Modern Solar Maximum, which began with Cycle 15 in 1914. Solar activity peaked in Cycle 19 during the late 1950s, and may have ended with at the top of Cycle 23 in 2000.
There was however a strong early 18th century warming cycle coming out of the Maunder. As in other cool and warm intervals, the secular trend is always interrupted by such multidecadal counter-secular trends. The main, multicentennial trend however depends on the ratio of solar minima to maxima, as moderated by oceanic oscillations.
You’re in a boat with 99 other people. Everyone on board except you has lost their minds and wants to capsize the ship in the middle of the ocean because of a group delusion. Your only tools are a slide rule, a PowerPoint presentation, and a machine gun. What do you do?
Shoot the cameraman first.
“Shoot the cameraman first”
Ron long…absolutely the most brilliant reply I have ever heard. bravo!
I was just watching “Captain Phillips” and that line was kinda in the movie….
Yooper, I’ve never watched a movie called, or containing, “Captain Phillips”. My twin brother, suggested this idea to deal with anti-hunters when he was President of Oregon Hunters Association.
https://en.wikipedia.org/wiki/Captain_Phillips_(film)
Another clever geologist.
You will go a long way with that comment
Use the presentation in an attempt to sway those with common sense to grow up and behave like adults. Use the slide rule to calculate proper angles on how to keep the boat afloat as you place the converts behind you and also to calculate aim trajectory while using the machine gun to kill the remainder without punching holes in the boat nor losing their valuable meat over the side. Then chum the organs to attract sharks to shoot with the remaining ammunition in order to vary your diet while you and your free thinking logical companions drift awaiting rescue. I understand from an April 2020 report out of New Guinea that climate alarmists taste a lot like chicken.
Scary, the proposed is detailed enough, there’s a case that you’ve been contemplating this plan for a while.
Taz, the problem had only been presented 30 minutes before but about 10 minutes, which is quite a long time when you consider the topic is what to do with climate crazies contemplating killing themselves and you to boot in das boot. Didn’t really need the slide rule but the humanitarian in me believed it only right to convert as many of the deluded as possible with the presentation. Besides best to keep the meat fresh.😉
Better to do some fishing – the climate crazies are the vegetables
Open fire!
Do you have any bullets?
And how many?
At lifeboat range, 100 should suffice. Or 50, depending upon caliber. Even if you don’t get two for one, the survivors might change their minds.
Standard belt for M240 .308 cal MG is 50 rounds, but they can be linked up for 100 or 200. More than that isn’t recommended, since the barrel should be changed after 200 rounds anyway. Sooner for sustained fire.
But one 7.62x51mm round will easily kill two stacked people. More at short range.
Just don’t shoot the boat.
Well, yes, but he didn’t say it was Rambo on the boat.
True, he didn’t specify the MG or ammo.
At that range, even an M249 with one belt of 100 5.56x45mm rounds would suffice. Or an Ultimax with 100 round drum.
Two hundred would of course be better. Standard loadout for an M249 gunner is 700 rounds.
RPK-74, magazine-fed LMG without quick-change barrel:
Minimal for combat, but more than adequate for lifeboat assassination with 40 round box or 75 round drum mag
Sorry about the four letter embellishment.
In reality it mostly comes down to how many clips you have, and how many are in a clip. Assuming an M-16, the original standard was 20 round clips. In a crowd, in tight quarters, you can easily be rushed or injured/disabled during a clip change. And you’re not going to get much attention to discourse on logic and math while holding a machine gun and at least 5 clips hanging from your belt…
The civilian version is the AR-15, which cannot fire more than one bullet per trigger pull. It is often the target of “Assault Rifle” legislation, but its name “AR” comes from the ArmaLite company (ArmaLite Rifle) which designed it for the US military, and was afterward sold to Colt. It is a regular semi-automatic rifle like most of the others, except it LOOKS like the military cousin that it is…
By “clip” you mean magazine. Modern M16s have 30-round magazines. But he says “machine gun”, not “assault rifle”. Today that implies a beltfed weapon, although there still are magazine-fed light MGs, like the Ultimax and RPK. However, their magazine capacities are far higher than the Bren guns, BARs and even DP-28s of yore.
Yes, it just “LOOKS” like an assault weapon, but it isn’t. However, to the anti-gun Liberal, “looks can kill”. All issues are viewed emotionally, with fear, not rationally, with facts. If they used reason, this site wouldn’t even exist … nor would Democrats.
True. “Assault weapon” is a meaningless category contrived by anti-freedom goons.
An assault rifle is select fire, ie capable of full auto. The great WWII M1 is semiauto only. Its 1950s descendant M14 is an assault rifle because it’s capable of full auto, although not controllable in that mode, due to the power of .308 cal cartridge.
Were it controllable, then it would be a light machine gun (LMG). MG categories are light, medium general purpose and heavy. The breakthrough in MG design was made by the German MG34 and MG42 GPMGs, employed on bipods as squad-level LMGs and at platoon and company level on tripods as MMGs.
Exactly. The fact is, the whole ” anti gun lobby” thrives on ignorance and emotionalism.
Oddly, when I think of an assault weapon, the ‘Tommy Gun’ comes to mind. When I think of a “machine gun” I think of the BAR 30-06 … but clearly I’m no gun expert.
BAR sadly was just what its name says, ie an automatic rifle. It totally sucked as an LMG or squad automatic. However, with two (as stolen by Army squads) or three (as per Marine fire team organization), it became a tactically useful substitute for a real LMG (as per Bren in British sections) or GPMG (as per German squad).
However by late in the war, those British and Commonwealth sections who could scrounged two Brens and German Panzergrenadier squads (with motor transport) had two MG42s, which is horrific firepower.
I’m reminded of the British para teams who broke out from Nijmegen after the disaster of Market Garden with three Brens, ie practically the firepower of a platoon, shouting “Whoa Muhammed!” while mowing down any Germans in their path to freedom.
Men.
It’s a classic case of experience over authority that, given time (and excellent scrounging), military units managed to get themselves fitted out with the most useful combination of weapons to do the job. As always, I greatly appreciate your information. I’m Canadian, but most of what I’ve seen in film is based on US forces, so the BAR and the Tommy Gun became rather ubiquitous, especially in the Pacific Theater.
Anyway … thanks again. The real facts always make the narrative better.
BAR was almost as heavy as real LMGs like the Bren. Tommy gun was way too heavy, so was replaced by SMGs like 9mm Grease Gun, let alone bicycle shop made Sten.
Proving there is always a world of difference between appearances and reality. Something I’ve always remembered about the Sten was its cost ($11.00) compared to the ‘Tommy’ gun’s +$70 – $200 cost and how simple it was … something of real importance to a cash strapped Britain.
Or US equivalent Grease Gun. Still .45 cal but a lot cheaper and lighter than a Thompson. Less accurate, but at submachine gun distances, that hardly mattered.
For me, it has been sufficient to know that any army who had to rely on the popular idea of an “assault rifle” would soon become a footnote to history. I did my share of hunting when I was younger, but it’s my older brother who’s the collector, but I’m certain he has nothing like your knowledge of military weapons. I also understand, when the subject arises, generally ignorance prevails. Gun owners are being bullied and gas-lighted purely on the basis of political expedience and tend to be hypocrites where ownership is concerned.
Meant 9mm Sten. M3 was .45 cal, like Tommy Gun.
No.
The Thompson SMG was on the heavy side, soldiers, even soldiers issued the M3 loved the Thompson rarely complaining about it’s weight.
The reason the M3 “Grease gun” was issued was because it was far cheaper and with it’s folding stock and short length was somewhat better for clearing rooms than the longer Thompson.
The M1 Thompson was designed when firearms were machined.
The M3 “grease gun” was designed to utilize stamped frame and parts.
The Thompson with it’s better sights and longer barrel could be used for clearing streets.
Sadly, the M1 was designed with a butt stock that angled from the M1 action to a person’s shoulder. This is what caused the Thompson’s uncontrollability under full auto.
The much shorter M3 “grease gun” had short radius poor sights and a shorter barrel.
As such, the M3 was issued to drivers, supply soldiers, tank crewmen and squad leaders.
The M3 was controllable under full automatic fire, it’s only option, mostly because the straight line from the gun’s action through the metal folding stock.
Making it an excellent short range weapon.
Plus it was dang cheap where the Thompson was ultra pricy!
The BAR was a LMG.
John Browning met the design demands of the military, including the short box magazine. Some general making design demands is often not for the best.
John,
“Assault rifle” just means it’s extra scary looking to children, and comes with the attachments to make it even deadlier; like the chainsaw bayonet or the armored car can opener (just a really big church key!)
You know as well as I do and everyone who has ever actually used one, an “assault rifle” is selct fire, ie capable of full auto. But the anti freedom narrative is seved by creating a meaningless category of “assault weapon”, which is a semiauto firearm with scary looking accoutrements.
Yeah, but if I just agree with you I don’t get to poke my finger in the eyes of the idiots that think that guns are scaaaawy!
Personally, I’m more an AR-10 kind of guy because with a longer barrel it can double as a hunting rifle! If I had lots of extra money I’d get a Barrett .416 semiautomatic rifle; the oryx, elk or antelope wouldn’t ever hear the shot that killed them! That’s how hunting should be!
I too am an AR-10 kind of guy, in that I prefer a piston to direct impingement operating system.
https://www.americanthinker.com/articles/2004/08/the_last_big_lie_of_vietnam_ki.html
Don’t use any ammo. Use the chainsaw bayonet.
The same thing happened to me and I got a refund. Oh, and I sold the slide rule on ebay, comes with a free machine gun. Went within the first 10 minutes. It was a good slide rule, though.
Call a meeting,
and then put in the middle of the floor there, all the tools and the weapon too,
and quickly move to the otherside of the boat, hopefully far enough and safe enough.
And stay there till the matter solves itself.
But got to make sure all you offer there, are fully loaded, just in case.
Most probably these guys will beat each other back to sanity with the tools you offer… hopefully.
🧐
Shoot him in the camera, then throw it overboard.
Threaten everyone else with the machine gun into “walking the plank” into the ocean. Then, to paraphrase an old Bill Cosby comedy routine, ask them what God supposedly asked Noah, “How long can you tread water?”
2021/04 1973/04
I compared melting 1973/04 with melting 2021/04
based on data from here
Willis, This is clearly off-topic here but I can’t get through on your blog, Skating Under The Ice.
I’ve “posted” a data based question a couple of times, which was “accepted” but never appeared. There was certainly nothing uncivil, accusatory, or personal in what I asked. I realize the question might not be interesting to you, or to many other people, although I don’t know why it should be uninteresting, but is that reason enough that it won’t be allowed to even appear in the blog?
Andy, I just checked the comments on WUWT. I can’t find any comments from you that weren’t approve. Then I thought “maybe he’s not talking about WUWT”, so I checked the comments on my blog and I can’t find any comments from you at all. So it’s not clear what’s happening. They might have gotten caught in the spam filter for some reason.
I’m not a moderator for WUWT, so I can’t say about them. So tell you what. I’ll email you to give you my email address. Send me an email next time you post a comment that disappears, include the text of the vanished comment, and I’ll see what I can do.
w.
“Arctic sea ice has generally been decreasing since 1978, the start of the satellite measurements of global sea ice area,…”
Here’s a look through the IPCC’s five assessment reports that shows how their graphs Arctic Sea Ice Extent has changed over the 24 year period from1990 to 2014:
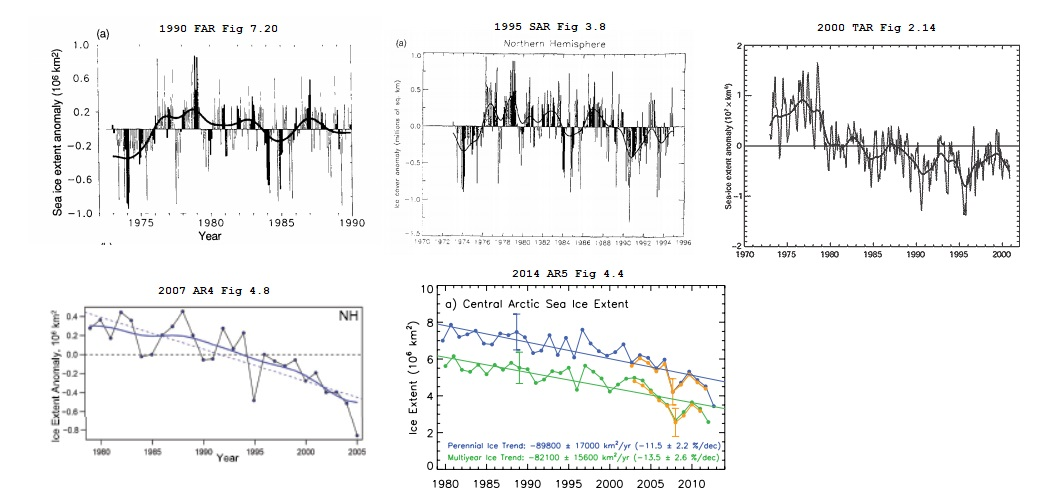
It’s a matter of opinion why the downward slope of the graphs seem to steepen from the 1990’s FAR to the TAR of 2000. It’s a matter of fact that the IPPC did alter the slope.
For some reason, you know the thing, satellite data prior to 1978 is ignored.
https://agupubs.onlinelibrary.wiley.com/doi/abs/10.1029/JC094iC10p14499
Uhm well yes it’s been ignored in the the IPCC’s AR4 and AR5, but in the first three Assessment Reports it wasn’t, but more to the point, for some reason the slope of the graph by the TAR in 2000 had been modified to show a downward slope that hadn’t been there in the 1990 FAR. You can argue about why that is, but you can’t argue that it isn’t.
Slight correction. Lindzen retired from MIT mid 2012, not 2003. I spent a day with him and bought him lunch three weeks before the event.
You’re a lucky man. I met him briefly once. I’ve edited the head post.
w.
Not long ago I heard a great talk by someone who had spent the winter in Antarctica, even hiked during. He was going back, suspect that would help modelers as field work usually does.
If there was any doubt, should have said ‘their’ winter.
“These [Antarctic ice] increases have been far more puzzling than the Arctic ice decrease…”
The problem isn’t that they can’t explain the Antarctic ice increase, but, that they believe they understand the Arctic decrease. They don’t know that they don’t know and they want to make economy destroying policy based on the ignorance they believe to be knowledge.
I like the headline image, it reminds me of a place I visited not long ago, a remnant of a much older age.
see https://en.wikipedia.org/wiki/Durdle_Door
Was the visit worth it?
I was driving from Bournemouth to Weymouth, it was worth a detour, with a longish walk from nearest car park, down the hillside to ‘Man of War’, and steps to the beach from where it looks impressive. Apparently some lunatics cliff-dive from from the top (200 ft height) but not that day.
Try this one on Lake Superior:
https://www.google.com/maps/uv?pb=!1s0x4d4ec3f59bef320b%3A0xe480b3c31e71eb18!3m1!7e115!4shttps%3A%2F%2Flh5.googleusercontent.com%2Fp%2FAF1QipO0bZV-EUGtx0WzXsETY_r8yIIvzl70qiXnrcEC%3Dw426-h320-k-no!5spictured%20rocks%20-%20Google%20Search!15sCgIgAQ&imagekey=!1e10!2sAF1QipMXEi_xS1WE9Wnd9WFH671egZfrTw__A3_xlFiN&hl=en&sa=X&ved=2ahUKEwi2gZnozqfxAhXEW80KHSpTDGYQoiowJHoECHwQAw
Was there a few summers back. Pulled in at Munising with air temps pushing 86F. Took a swim – refreshing. We watched the cold front barrel across Superior over the next few hours to have the next few days never get above 60F in July, and rideable waves pounding the shores. Our planned paddling adventure of Picture Rocks cancelled. Amazing stretch of coastline!
[User permanently banned for impersonation]
[User permanently banned for impersonation]
More nonsense.
[User permanently banned for impersonation]
Simple. I don’t bother. The only thing I find significant is the fact that the planet has been cooling since the HTO. The LIA was the coolest period in 8000 years and our planet has never been more habitable in human history. All reason and all data indicate that the best explanation for the small amount of warming we have experienced in 150 years is natural variation … and beneficial. Even the CO2 concentration (regardless of its source) has proven beneficial. If anthropogenic CO2 has caused some warming (doubtful), it is a fortuitous buffer to the natural cooling and offset to the planet’s natural tendency to sequester it.
First, Lawrence, how about you dial back on the aggro? It’s not a good look on you.
Second, yes, there is a slight negative slope to the trend, a whopping 0.02 million sq. km. per year. HOWEVER …
The p-value of the trend, adjusted for autocorrelation, is 0.126, far from significant.
Which is what I said, that “there’s been no statistically significant overall trend in global ice area”
Third, your link only goes up to two years and two months ago. My analysis goes up to one month ago, during which interval the global sea ice area has increased rapidly.
Fourth, the trend up until 2014 was slightly positive, but again not statistically significant. So obviously, the negative slope is due solely to the recent short-term dip of unknown origin, which the ice area is now recovered from.
Fifth, since you obviously have no idea what I do know, please don’t make stupid claims about what I “should know“.
Sixth, no, they don’t call it “standard deviation” because “statistical significance depends on deviations”. You made that up. The concept was introduced by Karl Pearson in 1893. He wrote it with a hyphen, “standard-deviation”, and he didn’t bother to explain why he chose the term. From Earliest Known Uses of Some of the Words of Mathematics:
Not only that, but you’ve got the order reversed. The term “statistical significance” wasn’t introduced until 27 years after the term “standard deviation”. Op. Cit.
My unsolicited advice? Next time, ask questions instead of making incorrect assertions and providing dated links. Look, I’ve been wrong, and I will be again … but assuming that I am wrong instead of asking why I said what you think is wrong is not the best of tactics.
Regards,
w.
[User permanently banned for impersonation]
[User permanently banned for impersonation]
[User permanently banned for impersonation]
See the problem with systematic temperature measurement error, (869.8 KB pdf) Lawrence?
Average uncertainty in the global air temperature record is ±0.5 C.
See the warming trend now?
Take anomalies, and the uncertainty gets larger as the root-sum-square.
I don’t LOOK for trends as you falsely accused me of doing. I MEASURE them and assess their statistical significance.
So why should it matter if I can see it?
w.
The trend is the same no matter how you graph the data. It just looks different.
w.
Lawrence Sellin June 20, 2021 5:34 pm
Oh, please, stop exposing your ignorance. The data is NOT adjusted in the slightest. What is adjusted is the method for calculating statistical significance. You have to adjust for autocorrelation because if you don’t you often end up claiming significance when none exists.
Adjusting for autocorrelation is bog-standard statistical practice for evaluating significance in non-normal datasets such as many climate datasets, a standard practice which is sadly far too often ignored by the alarmists.
You’re way out of your wheelhouse here. You obviously have no clue about why the adjustment is made for autocorrelation or about the methods for doing so. My advice? First rule of holes … “when you find you’re in a hole, stop digging.”
There’s a lovely old saying, likely from before your time, “Don’t try to teach your grandmother to suck eggs” … google it.
Read what I wrote. I said you made up a claim about why it’s called “standard deviation”, not a claim about how a regression line is calculated. And yes, I know exactly how the slope of a regression line is calculated.
[N * Sum(X * Y) – Sum(X) * Sum(Y)] / [N * Sum(X^2) – Sum(X)^2]
However, this is NOT the same way variance is calculated. Variance is
Sum[(X -mean(X)^2]/(N – 1)
There is a similarity, as you point out, in that variance is a measure of central tendency (distance from the mean) while the slope and intercept of the regression line are calculated to minimize the distance from the data points to the line rather than the mean …
…
…
So what?
I specified in my previous answer the trend (regression line slope) and the p-value of the trend. So no, I didn’t just LOOK at it as you falsely claim.
And yes, I’ve removed the seasonal variations. It’s standard practice in all aspects of climate science, because the seasonal variations swamp the much smaller long-term changes of interest.
Finally, I don’t “rely strictly on total ice area” as you say. That’s why the title of my graph is “Total And Hemispheric Sea Ice Areas”. That’s why there are three lines, only one of which is total ice area.
The trend is slightly positive (Antarctic gain greater than Arctic loss) from 1978 to 2014. For three years, both Arctic and Antarctic areas decreased. From 2017 to the present, Antarctic gain was once again greater than Arctic loss. I gave you a link to the data. You are denying it. Not impressed.
w.
Willis,
Now that’s the professional kind of beat down that your fans know and love! Whether Douglas fir or good old hickory, there’s lots of ways to handle someone being mulish!
Plus 10,000, Willis!
Nonsense.
[User permanently banned for impersonation]
See Willis’ rebuttal to your nonsense. You might learn something.
[User permanently banned for impersonation]
Everyone “Googles”. Only an idiot would waste time writing material that they know is already prepared … and accurate. Only a fool (you for instance) uses ad hominem if they have an argument. Hell, you can’t even spell “argument” let alone make one.
Your pitiful response to Willis filleting your criticisms was beyond your abilities. So far you’ve proven yourself to be no match for anyone, let alone a “real scientist”. You missed his points completely.
Lawrence, you’ve made a fool of yourself. I think it’s time for you to pack it in.
In 2014 and because Antarctic sea ice extent was so extensive that I began to put the numbers together. To write an article.
And suddenly there were reports about satellite orbits changing. As I recall, the series Iwas working went weird such that reliable comparisons could no be made.
Aaah! What could be better than a Sunday morning with the summer monsoon starting to moderate the high desert climes, and a post from Willis to peruse and enjoy!
Willis, I know that climate alarmists are a self-flagellatory bunch, but it does my heart good to see you pummel them about the head and shoulders with your easy to understood charts and graphs. For optimum attention getting do you recommend the standard, old Doug fir 2×4, or do you agree with the preacher in Pale Rider; “Nothing like a good piece of hickory?”
Puts me in mind of a story told on the cattle ranch I grew up on. This was about the man selling a mule who assured the buyer that the mule was very good at following commands.
In a few days the man brought the mule back and complained he wouldn’t follow a single command. He said “Giddap!” … the mule didn’t move. He said “Jee!”, the mule command meaning turn right … nothing. He said “Haw!”, meaning turn left … the mule ignored him.
So by Gawd, he wanted his money back.
The man who sold him the mule calmly picked up a board, used it to hit the mule over the head, said “Giddap!” .. and at the command, the mule promptly started to move forwards.
“I thought you said he obeyed orders”, the buyer said.
“Oh, he does, he’s a very obedient crayture,” was the reply, “but sometimes you’ve got to get his attention first …”
w.
I worked for an old rodeo cowboy who made a pretty good living teaching city kids how to ride! He had a really good eye for horse flesh, and one of the best looking dude strings I’ve ever seen; but made a lot of extra money selling horses to kids and then, some months later, buying the same horse, at a substantial discount from what he’d charged, at the various auctions! He told me the parents were almost always too embarrassed to ask for their money back, but even if they did he had just gotten free feed and boarding for one of his remuda! What a character he was!
Willis,
NSIDC’s own graph is a lot more alarming looking than yours…..same info….
Yes; and the operative idea is “alarming LOOKING”. For the AGW true believers appearance is everything; facts not so much. Regardless of how it looks, our planet has been cooling steadily since the Holocene Thermal Optimum and there has been no indication that is changing.
[User permanently banned for impersonation]
Yes, I do have a point, unlike you. You people rely on averages far too much not to mention corrupt politicize organizations like NASA and the NOAA. Clearly your math is not serving you well. You haven’t managed one accurate prediction in nearly 50 years. Your math and science is a farce. There is no “climate crisis” nor is there likely to be. The planet is COOLING, not warming.
[User permanently banned for impersonation]
Clearly you need to master reading and spelling before you attempt something as troublesome as science … especially climate science. The evidence for cooling is very easy to find. I’ll just Google it, shall I?
It all depends upon time frame.
Earth has been in a longterm cooling trend at least since the Minoan Warm Period c. 3 Ka, but arguably since the Egyptian WP 4 Ka and end of the Holocene Climatic Optimum 5200 years ago.
We’ve definitely been in a cooling trend since the Maunder Minimum depths of the LIA c. AD 1695, and during our Modern Warm Period since peak heat in the 1930s.
[User permanently banned for impersonation]
The hockey stick blade is totally bogus “data” grafted onto paleoproxy observations.
You’re referring to Marcott’s “Hockey Stick” blade, no doubt (for which there is no more empirical evidence than when Mann invented it). The spike you refer to is clearly an error or someone’s aberration compared to the rest of the graph. If such an outlier occurred in any graph but in AGW hysterics it would be immediately scorned as junk.
The graph was from Judith Currie’s site; Climate Etc.
Nature Unbound III: Holocene climate variability (Part A) Posted on April 30, 2017 by curryja | 335 Comments by Javier
https://judithcurry.com/2017/04/30/nature-unbound-iii-holocene-climate-variability-part-a/
History of Earth’s Climate, Holocene
This essay includes the Wiki graph showing the planet cooling and is well worth a read for anyone with any pretensions of an open mind. AGW comes across as a very dubious idea, considering the great weight of evidence for natural variation.
https://www.dandebat.dk/eng-klima7.htm
“Rory, here is my evidence the planet is warming:
.
https://woodfortrees.org/plot/uah6/plot/uah6/trend
.
Please show me your evidence that the planet is cooling.”
What time frame?
Short term?
Wood for Trees: Interactive Graphs
UAH is a very short data set, and happens to have started right around the coldest period in the past 120+ years.
So lets see what happens is we expand out your time frame, especially since 1979-1980 is such an obvious cherry pick for showing warming.
What do we see when we do that?
Wood for Trees: Interactive Graphs
https://woodfortrees.org/graph/uah6/plot/hadcrut3nh/from:1900/to:1980
Other time frames?
Long term?
Medium?
Lawrence Sellin June 20, 2021 3:24 pm
I am showing the actual values. This allows people to see just how important any variations are in the real world, rather than magnifying them so they look important. So sue me.
And I am indeed using rigorous math, which shows that as I said, there is no statistically significant trend in the data. And that will not change no matter how it is plotted.
I also pointed out that the most recent value is just above the long-term average. What other “rigorous math” would you like me to have done? And instead of whining about it, why did you not just SPECIFY what math I should have done and ask me to do it … or even do it yourself in order to prove me wrong, since I gave you the link to the data?
As to “obscuring small movements in the line”, why on earth would we be interested in small variations in ice area? Those happen all the time. Alarmists are claiming impending Thermageddon—their claim is not “despair, because there are small variations in sea ice area”.
w.
[User permanently banned for impersonation]
The change in air temperature is minuscule and the anomalies are physically meaningless.
More nonsense; of course it does. It all depends on the data.
More to the point, what does you providing some random graph show, apart from your inability to defend your own position?
Whatever you do, don’t believe your lying eyes. Trust the statistician who has been trained in the dark art of data torture. “Deviations” are more important than total ice area? Utter nonsense. You elevate the importance of deviations only because there was a large downward deviation starting in 2016 that has since almost completely recovered but biases the end of the time series downward slightly so you give it more credence because it fits your narrative, not because it’s a better measure of total ice area trend over time, which it most definitely is not. Give it a couple more years and your deviations, like the more accurate representation of total ice area, will no longer show a statistically significant downward trend. Convenient how you can bias a trend by where you start and end the time series.
So if current total ice area is higher than the average over the time series (barely), how do you know it’s not evidence that there is no statistically significant trend? That it’s an anomaly, but the steep decline in 2016 (which has almost completely recovered) wasn’t an anomaly? You are so thoroughly and emotionally invested in a narrative of shrinking sea ice that you can’t see what everyone else can. No trend, just natural variation. Weird.
The maximum of arctic sea ice extent in 2021 was actually slightly higher than the maximum of 1974.
https://agupubs.onlinelibrary.wiley.com/doi/abs/10.1029/JC094iC10p14499
How to make your data scary: (AKA How to mislead with graphs)
…
No 2: Truncate the bottom of the Y Axis
…
NSIDC specializes in making innocuous cycles look alarming.
Thanks Willis for another clear exposure of “much ado about nothing” regarding sea ice at both poles.
A lot of attention was given to “warm” water flow to Antarctica from the surrounding Southern Ocean. This looked like a warming story. However a recent oceanographic study (below) showed that this warm inflow is simply being drawn poleward in response to downwelling flows of super-cold Antarctica deep water, down via ocean floor canyons around Antarctica and northward to the general ocean circulation. So it turns out to be more like a cooling story.
https://advances.sciencemag.org/content/6/18/eaav2516.full
https://ptolemy2.wordpress.com/2020/09/12/widespread-signals-of-southern-hemisphere-ocean-cooling-as-well-as-the-amoc/
Here is a NoTricksZone (Pierre Gosselin) post about northward movement of Antarctic sea ice extent:
https://ptolemy2.wordpress.com/2021/05/13/southern-hemisphere-sea-ice-now-extends-80-km-farther-north-than-prior-estimates/
Finally I like this diagram of 3D ocean circulation around Antarctica showing it to be the “Grand Central Station” of the global Thermo-Haline Circulation.
At first glance I thought you were posting a diagram of male dominance detailing a scientific explanation for the patriarchy … but what do I know?
Rory,
That’s understandable, the diagrams are quite similar!
O I guess the claim that Antarctica dominates ocean driven climate makes me a white supremacist also 🙂
> Now, you are welcome to believe that the reason that the temperatures started warming in ~ 1700 was the intercession of the Pope
See Willis! It wasn’t the Pope- it was the power of Prayer!! 😀
(Of course, nobody asked the villagers if they just didn’t sneak over to another hamlet to lead some less than virtuous lifestyles… but lets not get picky)
It is disturbing, sometimes even annoying, that so little attention is given to the rising water vapor; a ghg. I expect that most people that have been paying attention are aware that water vapor is what made the planet warm enough for life as we know it to have evolved. It is also fairly common knowledge (at least among sciencey types) that the primary natural source for water vapor is the tropical oceans within about ± 20 degrees of the equator.
Most of the increase in WV has resulted from the increase in planet temperature and the increase in saturation vapor pressure that occurs with increasing temperature. Starting in Jan 1988, NASA/RSS has been measuring WV globally using satellite based instrumentation (they claim RMS error about 1 mm). They reported it monthly until Jan 2021 as Total Precipitable Water (TPW). The measured rate of increase is about 43% more than possible from temperature increase alone. A study of likely sources of the extra WV revealed that most of it (about 90% of the 43% extra) comes from irrigation. The history of irrigation started centuries ago with the rate dramatically increasing around 1960. Note also that irrigation is where the land is; mostly in the Northern Hemisphere.
Meanwhile, in the real world, my NWS office-APX- had this gem in their current Hazardous Weather Outlook:
Happy Summer Solstice……
“There is no climate emergency”
It is clear that European leaders are already agonizing over this. The G-7 signed a commitment – No more funding coal development and a week later, after three long cold winters in a row had used up stored gas reserves, announced plans for immediate re-opening of coal fired power stations and mining to feed them! Coal, the most hated substance on earth to warming hysteria folk!
This is not a temporary retreat like maybe emergency purchase of LNG could be.
This is an unmistakable message. They know that the non -West is galloping toward their prosperity on unstoppable FF steeds of coal and Europe knows how their decision to open three coal projects looks. This is the end of the Paris Follies. This means peak renewables is upon us. With La Penn and similar oppositions in EU’s leaders’ faces, with the unsolvable FF shipping and Transport dilemma, Europe is throwing in the towel. It’s all over except the headless chicken gymnastics.
Does anyone at all think the loons who are afraid of a warm planet really understand that a very, very cold planet will (not would) impair their warmth, food resources, and housing choices, never mind transportation resources and stores with food and stuff like that?
I’ve been through several blizzards, one of which blew so much snow in front of my storm door (4 feet 7 inches – I measured it) that I had to wait for my neighbor Luis to dig me out. That was 10 years ago. Glad I was that I had stocked the cupboards and fridge, but really, really wanted the Warm Weather to show up as soon as it could…. which was in June that year. I have pictures, too.
We keep having cold spells punctuated by a few warmish days, and it isn’t just in my AO. It is in many places. Not enough rain, either, which is bad for food crops. I had to turn the furnace on last week to warm the house up after the overnight temp dropped to barely 45F. My cat had buried herself under my blankets. Okay, so I left the windows open and enjoyed the cooler air until it got COLDDDD!!!! Then I wanted heat and hot tea and hot food. So the weather’s gone cockeyed in many, many places and it’s just weather, but what if it stays that way?
I do think that the only way to put a stop to the colossal nonsense that is a fear of a warm planet is to shut the warm weather down in both hemispheres for about 5 years running and blame it all on the Warmunists. I mean, it snowed 15 inches in Istanbul in May, for Pete’s sake!!!! That isn’t the only place the weather has gone whacko! And then we can yank their chains about how they wanted to “end the warming” and “save the planet” while they’re trying to figure out how to use a non-electric can opener.
I just do not understand the crackpot notion that having a warm planet to live in is somehow a bad thing.
“These increases have been far more puzzling than the Arctic sea ice decreases and have led to a variety of suggested explanations”
It’s only puzzling if you think you know what’s going on. For the rest of us, it’s just nature doing what it does, regardless of our efforts to predict.
±0.2°C for their averages of 2000 years ago?
Please count me highly skeptical.
There isn’t a physically meaningful proxy air temperature available anywhere for any price. Yet, anyway.
Negative anomalies inside the southern polar vortex are expanding. The polar vortex in the post-La Niña period is strong. We can be reassured about the sea ice in the south. The ozone hole will also be bigger this year.
Summer temperatures in the Arctic will also remain within the average. The reason is simple – in July, the Earth is in its orbit farthest from the Sun.
http://ocean.dmi.dk/arctic/meant80n.uk.php
what nonsense is this?
The arctic sea ice as of today is 7th lowest for date in the record, 1.8 million sq km lower than on this date on average in the 1980s… the top 15 lowest for the date are all 2005 or later.
You mean in that satellite record which spans a whole 42 years?
It is nonsense of course. The arctic sea ice should be the 1st lowest for any date on record because global warming is worse now than it has ever been. 97% of scientists agree.
When you figure out why it’s only in 7th place, be sure to let us know.
The Church of Global Warming needs to abandon this crazy idea of trying to explain Antarctic sea ice increases. The Church normally has no need for explanations. The creed should be
Arctic sea ice losses were caused by global warming, Antarctic sea ice increases were caused by global warming.
Amen, and praise be to Gore.