Guest Post by Willis Eschenbach [See update at the end]
Thanks to the excellent comments by folks here on my post “A Request for Peer Preview“, I thought I’d go down the rabbit hole of the surface response to increased downwelling surface radiation, AKA “radiative forcing” or just “forcing”.
Surface radiation includes the net solar or “shortwave” forcing plus the downwelling “longwave” infrared thermal radiation from the atmosphere. On a global 24/7 basis, the sum of these two averages about half a kilowatt per square metre.
(Please don’t bother me with claims that downwelling longwave radiation from the atmosphere doesn’t exist. It has been measured, not estimated or modeled but measured, thousands of times by scientists all around the planet for over a century. If you don’t think it’s real, you need to do your homework … and in any case, this is not the place to debate it. I never delete comments on other peoples’ threads, and I almost never delete comments on my own threads, but in this case, I’ll make the exception. Please just take up the debate elsewhere, thanks.)
Now, the most direct way to see how variations in total forcing affect the temperature is to use actual data. So on a gridcell-by-gridcell basis, I took a direct look at how the surface temperature is affected by the variations in forcing. For the surface temperature, I used the Berkeley Earth gridded temperature; and for the radiative forcing, I used the CERES data. I first removed the seasonal variations from both datasets, then used standard linear regression to calculate how much the temperature changed when the forcing changed by one watt per square metre (W/m2) in each gridcell. Then I multiplied that by 3.7, since in theory the forcing increases by 3.7 W/m2 when the level of atmospheric CO2 doubles.
Here’s the result of that analysis:


Figure 1. Change over a 20-year period in the temperature due to the change in downwelling longwave (LW) plus shortwave (SW) at the surface.
Note that this gives us 0.15°C per each additional 3.7 W/m2. As expected, the ocean changes less than the land, because of its greater thermal mass, and again as expected, the poles change more than the tropics. Note that there are large areas of the tropical ocean where the surface temperatures are negatively correlated with forcing. This means that in those areas, when the temperature rises, the clouds rearrange to cut down incoming radiation.
However, there’s a huge problem with this method—it doesn’t give the surface time to equilibrate and adjust to the changes in forcing, because the changes are occurring on a monthly basis. So this is just a short-term response to changing forcing. But what we want to know is, what is the long-term response to such a change?
In my last post, I pointed to a novel way to calculate this. I took the average of each of the Berkeley Earth and the CERES 20-year 1° latitude by 1° longitude datasets I’d used to calculate Figure 1 above. Then I made a scatterplot where each dot is one gridcell. I calculated a LOWESS smooth of the data to show the average trend. Here’s that graph from my last post.

Figure 2. Scatterplot of surface temperature versus downwelling surface radiation. The slope of the LOWESS curve is the change in temperature resulting from a 1 W/m2 change in downwelling radiation.
Upon further consideration, I realized that I could get a more accurate answer by dividing the two datasets up into land and ocean. Here are those results.

Figure 3. As in Figure 2, but for the land only.

Figure 4. As in Figs. 2 and 3, but for the ocean only.
Now, these are interesting in their own right. As we saw in Figure 1, the response of the surface to increased forcing goes negative at high ocean temperatures, but not for high land temperatures. In addition, the data is more tightly clustered around the LOWESS smooth when divided in this manner.
These two graphs lead to the following relationships:

Figure 5. Change in land temperature in °C corresponding to a 3.7 W/m2 change in surface forcing at various temperatures/forcing levels.

Figure 6. Change in ocean temperature in °C corresponding to a 3.7 W/m2 change in surface forcing at various temperatures/forcing levels.
Note that as expected, the change in ocean temperature is smaller than the change in land temperature at a given level of surface forcing.
Finally, I took the LOWESS smooths for the ocean and the land, and I used them as lookup tables to let me know the average temperature response for any given level of downwelling surface radiation. I used those temperature responses to calculate the expected temperature change for a global 3.7 W/m2 increase in downwelling surface forcing for each gridcell on the globe. Figure 5 shows the end result of that calculation.


Figure 7. Expected change in surface temperature in the long term for a change of 3.7 W/m2
Some things of note. First, despite this being the result of an entirely different calculation method from that used in Figure 1, the main features are the same. The ocean still warms less than the land. But since this is long term, the ocean has had plenty of time to equilibrate, so the ratio of the two is not as large (Figure 1, ocean 0.08°C, land 0.31°C per 3.7 Wm2. Figure 7 above, ocean 0.39°C, land 0.71°C per 3.7 W/m2 of TOA forcing). We also see that as in Figure 1, the poles warm more than the tropics.
Finally, we see much the same general areas of the ocean cooling while radiation is increasing as we saw in Figure 1.
How well does this represent the long-term response of the surface to changes in radiation? I’d say quite well. Suppose we have two adjacent 1°x1° gridcells of the surface. One is a bit warmer than the other because it has greater downwelling radiation, and the difference between the two temperatures divided by the difference in the two radiation levels is a valid measure of how much the additional radiation heats the planet.
Two key points about this situation. First, the average temperature in those two locations is the result of centuries of them having approximately the same average radiation. We’re talking about variations of a few W/m2 over time, and total downwelling radiation averages about half a kilowatt per square metre.
Second, if over that time the global downwelling radiation has slowly increased due to changes in greenhouse gases, the temperature of both locations will have increased, and that will just shift the points a bit up and to the right in the scatterplots above. But it won’t change the underlying relationship of the temperature differences divided by the radiation differences.
So I’d say that this is a very valid way to accurately measure the long-term real-world surface temperature changes from changes in downwelling surface radiation.
And the bottom line of the analysis? An increase of 3.7 W/m2 in downwelling surface radiation, which is the theoretical increase from a doubling of CO2, will only increase the surface temperature by something on the order of a half of a degree C.
Hmmm …
[UPDATE] An alert commenter has noted that the nominal 3.7 W/m2 per doubling of CO2 is measured at the top of the atmosphere (TOA) and not at the surface. It turns out that for each additional W/m2 of forcing at the TOA, the surface forcing increases by about 1.3 W/m2. This increases my estimate of the temperature change from the 3.7 W/m2 from 0.36 °C to 0.47°C, or from about a third of a degree per doubling to about half a degree per doubling. I’ve swapped out the graphics in Figure 7 for the correct values, and fixed the references in the text.
Here on our dry California forested hillside, the State has officially declared our county a drought area. I went out yesterday to take a look at the two water tanks that together supply both our house and the rental house on our property. Instead of containing 5,000 gallons or so between the two tanks as usual, they had about 1,500 gallons … as you might imagine, I said bad words. Possibilities regarding our two-well water system:
- Float switches in the tanks are bad.
- One or both of the submersible pumps are bad.
- One or both wells silting in.
- One or both wells w/plugged screens on the submersibles.
- The wells need plunging or acid-washing or ??.
- Leakage in the distribution system.
- It’s just the !@#$%^ drought.
Gotta love owning land, you’ll never get bored. For those aware of my checkered past, it’ll be no surprise that I used to drill water wells and install and service pumps for money, but I’m retired, so the guy from the company who drilled our well is coming out on Friday to take a look.
Best to all, stay well, hug your family, glory in the day, because as the song says, “You don’t miss your water ’til your well runs dry” …
w.
Figure 6 does not really convey the significance of the drop after 24C. Almost 50% of the ocean surface that is not sea ice is 24C or above 24C.
Oceans regulate to a maximum of 30C. It a thermostatic control. There is no need for a “Greenhouse Effect” and there is no “Greenhouse Effect”. Clouds buzz away at 255K as does most of the land ice. Nothing CO2 does will change that. The clouds reflect more insolation than they reduce in OLR by their absorption and re-emission. Albedo trumps absorption and re-emission at lower temperature to regulate the temperature of the warm pools.
Land is a net loser of energy so can have no impact on the long term temperature trend.
Some comments above are about lateral or horizontal transfer of air masses and their effect on temperatures allocated to a grid cell.
Eastern Australia provides one example of this, with heat waves. Brisbane is some 3000 km south of the Equator, Sydney 3,750 and Melbourne 4,200. Roughly, their annual maximum temperatures are Brisbane 25⁰C, Sydney 23⁰C and Melbourne 29⁰C, a trend expected from latitude. However, the average maximum temperature of the 40 hottest 5-day historic heat waves each year at each city is Brisbane 32⁰C, Sydney 33⁰C, Melbourne 39⁰C, the reverse of latitude effects.
Melbourne has hotter heat waves because of the transport of air masses S-E from central Australia under some weather conditions. Alice Springs, in the centre, is some 1,700 km N-W of Melbourne, indicating that reasonably large distance and temperature differences are involved, some 15 grid cells of 1⁰. This does not happen all year round as heat waves are once a year and are usually less than 10 days long, but this extreme factor alone could nudge uncertainty into some assumptions about grid cell temperatures. Reality might not match theory. Geoff S
Geoff, this and all other such effects are a part of the average gridcell temperatures. They don’t “nudge uncertainty” into the temperatures. The gridcell average temperatures include sensible and latent heat loss, advection, cloud feedback, water vapor feedback, and all the rest. That’s why I think this method is valid, specifically because all of those factors are already taken into account.
w,
Willis, the findings in this article will go nicely at the end of your peer reviewed paper.
Too bad this thread got hijacked early on.
Figures 5 and 6 in this post are especially interesting. Both as a validation of your results and an explanation of where theory and observation differ.
Not just the high enery response over water but the low energy response over land.
What might not be clear to some readers is that the downwelling radiation includes solar (sw+lw) plus back radiation (lw) + feedback (lw) – albedo (sw + lw).
And the reader interested in the “wat” and the fixed speed of light is anticipating a problem in physics solved around 1905. How to increase the energy of a photon if the speed is fixed.
”Too bad this thread got hijacked early on.”
Hijacked? Rubbish. If there are questions to be answered, let them be asked!
Anyone that wants to sabotage meaningful discussion at WUWT need only drag a truly smelly red herring across the path.
You dont even need a person. It is simple enough to create a bot to monitor WUWT to inject random questions whenever a new topic opens.
Thanks for the new version. I like the order of presentation very much now, and especially the land versus ocean plots. It is interesting to see that the S-B prediction mostly follows the ocean data, which I would expect for a more uniform system, with an offset that makes sense given the complexity of the system. It is also nice that your final average of 1/3 C makes sense from “averaging by eye” the data (especially the ocean). So this seems quite persuasive now.
For a scientific paper, it seems that you have to make contact with prior work to explain what is new here.
It is wonderful how well the peer review system worked here.
“And the bottom line of the analysis? An increase of 3.7 W/m2 in downwelling surface radiation, which is the theoretical increase from a doubling of CO2, will only increase the surface temperature by something on the order of a third of a degree C.”
So the ECS is not 3°C per doubling of CO@ur momisugly as hypothesised by Charney and by Hansen, an it is not 1.6° per Stokes and Curry. It is 0.34°.
Ok. Problem solved. As you were, gentlemen. Smoke ’em if you got ’em.
Ferdberple May 5, 2021 5:05 pm
I’ve been through this before, hang on … OK, I just ran the Vostok ice core and temperature numbers. It turns out that the change in CO2 from the warming of the ocean is about 8.8 ppmv per degree. During the glacial-interglacial time, the temperature changed by about 10°C, and the CO2 varied by about 90 ppmv. A linear regression yields 8.8 ppmv/°C.
Oceanic warming since the LIA is on the order of maybe what, one degree? Two degrees? So that would explain about 9 ppmv to 18 ppmv of the increase in CO2 from that time.
But the increase has been on the order of 410 ppmv (2021) – 275 ppmv (1750) = 135 ppmv … far, far larger than can be explained by oceanic outgassing.
Sorry, Ferd, but that dog won’t hunt …
w.
“….measurements from satellites, show clearly that the stratosphere actually cools when it’s C02 content is increased,….this has the effect of raising the height of the tropopause without increasing the surface temperature, and so it tends to reduce the surface warming calculated..”
p.114 Elementary Climate Physics by F.W. Taylor
I would just like to make a comment about downwelling radiation and hope it is not deleted. Some energy circulates within the Earths atmosphere and gives the Earth a temperature it is not new energy like solar radiation. The Earth is not a cold and lifeless planet so it is obvious that it maintains a temperature because of intermittent solar radiation falling on the surface.
It isn’t intermittent solar flux is nearly 1400 joules per square meter at the TOA per second every second of every minute of every day.
Every joule emitted by the earths surface every second of every day, 2 joules are being absorbed per square meter over half the earths surface.
Of those 2 joules absorbed per second on is re-emitted instantly and one is stored to be emitted when on the darkside.
Willis was being abit of a sophist with his back radiation denial guff, nobody denies a downward flux of longwave radiation, what willis couldn’t prove if his life depended on it is that the backwelling longwave radiation is a ”forcing”.
And because it measured by joules per meter per second and every second is the same, that is your average.
For every 2 sqaure meters of the surface one is receiving no solar energy per second and is cooling and the other receiving 480 joules per second driving the temperature upto what we see in the real world, because thats what is really happening.
The temperature is determined by the solar radiation entering the Earth and its atmosphere minus the long wave radiation leaving, the temperature is given at any point by this and is why we have seasons. Less solar radiation at the surface means lower temperatures in winter and higher temperatures in summer altered by advective mixing. Back radiation does not drive warming it is not a variable unlike the things I have mentioned above.
No, that doesn’t determine temperature, although it relates to changes in temperature.
On average, there is zero difference between the energy in solar radiating entering the Earth and longwave radiation leaving. Yet, this doesn’t mean the temperature of the Earth is 0 K.
For a good analogy, consider a lake that is fed by one river. At the output of the river is a dam with a V-shaped slot in it, so that the higher the water level, the faster water will flow out. In steady state, the water level of the lake will always adjust so that the rate of water flowing in matches the rate of water flowing out.
In this analogy, the river flowing in corresponds to the flow of radiation. The water flowing out of the dam corresponds to upwelling longwave radiation. And, the water level corresponds to the surface temperature of the planet.
In this example, there are two things that determine water level: (1) the rate of water flowing in, and (2) the flow-rate-vs-height characteristics of the dam.
Solar radiation relates to #1, but it is not the only factor influencing temperature, since #2 is also important.
Longwave-absorbing gases in the atmosphere “constrict the channel” for radiant energy trying to leave. In the lake analogy, it’s as if they narrow the exit V-notch in the dam, thereby raising the water level needed to equalize in-flow and out-flow.
I tried a simple calculation of the climate sensitivity to CO2 as follows:
I estimated the area under the outgoing infrared graph for the Earth, the portion relating to CO2 frequencies was about 16%. From temperatures associated with that range of frequencies we can estimate the altitude that CO2 radiates to space.
As the effective radiating level is about 5km we therefore have 16% at 11.8km and 84% at 3.64km.
It would seem sensible to assume that the effective radiating level is proportional to pressure, double the pressure means double the CO2 in any unit volume. So if CO2 concentration is doubled the the effective radiating level will rise to an altitude where pressure is halved.
Taking the relationship between altitude and pressure we then get that 16% of outgoing radiation being finally released to space at 16.3km.
So the average radiating level has increased from 5.00km to 5.75km
Given a lapse rate of 6C/km this give a sensitivity of 4.5C per doubling.
Obviously this is a high number so I tried another approach comparing Earth to Venus
Earth’s CO2 radiates at circa 0.2 bar, Venus’s at circa 0.01 bar. So we can infer that if we increased Earth’s CO2 to 96% we’d get a rise in ERL that corresponds to 3.4C per doubling.
Both values are on the high side so there would appear to be a negative feedback somewhere that links to CO2 somehow……
Re : It’s just the !@ur momisugly#$%^ drought.
Tim Flannery [at one time probably the most popular go to doomist in Australia ] on drought in Eastern Oz in 2007
https://www.abc.net.au/local/archives/landline/content/2006/s1844398.htm
and now
Worst floods for 60 or 100 or some number of years
https://en.wikipedia.org/wiki/2021_Eastern_Australia_floods
So I think you’ll be ok in the long run Willis but there’s always…https://www.kqed.org/science/1962273/megadrought-conditions-not-seen-for-400-years-have-returned-to-the-west-scientists-say
Re-reading the comments, some folks seem to be missing part of the story. This is that ALL of the feedbacks (changes in water vapor, clouds, and any other feedbacks) are already included in the data.
Consider two nearby gridcells that have different radiations and thus different temperatures. The warmer of the two will be experiencing all of the various feedbacks due to the increase in temperature compared to the first one—cloud changes, water vapor, increased sensible and latent heat loss, and the rest.
So if the total radiation is dialed up by greenhouse gases to where the first now has the radiation that the second originally had, it will also experience similar changes in the feedbacks. And thus the first one will end up somewhere near the original temperature of the second one.
And that in turn means that my calculation of ∆T/∆F, the temperature response to increased radiation, includes all of the feedbacks. It is an actual measurement of the REALITY of what happens when radiation increases, including all feedbacks and forcings, known and unknown.
Best to all,
w.
It’s true that your calculation includes some of the feedbacks, but it doesn’t follow that it incorporates all of the feedbacks in a way that couldn’t change in response to global forcing.
The temperature in most locations is strongly influenced by global circulation patterns within the oceans and atmosphere.
Global forcings could stimulate changes in those circulation patterns. If that happened, then I don’t think we can know, a priori, whether or not the scatter plots you base your analysis on would shift. If those scatter plots and the associated curve fits shifted, then your analysis would not be predicting the correct results.
* * *
Another significant issue with your analysis is that it assumes an unrealistic non-physical distribution for the forcing, ∆F. While an increase in CO₂ concentration might be distributed uniformly over the globe, that will definitely not lead to a uniform increase in downwelling radiation. (I discussed this more in another comment.)
There are not many places that the back welling longwave infrared can act as ‘heat’ to the surface on this planet, parts of antarctica maybe that get below minus 83c.
The longwave also aids all surface evaporation of water day and night greatly.
But that is not ”warming” it is a cooling mechanism.
Considering 74% of the earths surface is covered by water fresh or salty, thats a coolng mechanism for 3 quarters of the earths surface.
A cooling mechanism everybody knows this to be correct, yet ignores it or worse calls it a warming.
There are not many places that the back welling longwave infrared can act as ‘heat’ to the surface on this planet, parts of antarctica maybe that get below minus 83c.
The longwave also aids all surface evaporation of water day and night greatly.
But that is not ”warming” it is a cooling mechanism.
Considering 74% of the earths surface is covered by water fresh or salty, thats a coolng mechanism for 3 quarters of the earths surface.
A cooling mechanism everybody knows this to be correct, yet ignores it or worse calls it a warming even though evaporation is removing heat from the surface.
Need to clarify “longwave radiation” by discussing the temperature of the greenhouse gas (H2O CO2 etc.) or cloud that is radiating up and down (& all directions).
It sounds like you’re believing the false narrative that radiation from CO₂ can’t warm anything beyond -80℃.
I’m sorry but I’m not sure that the aggressive moderating is always appropriate. I learned a lot from G.Wood’s comment on California and the responses rubbishing it, very good learning experience for me. Surely threads are just that, they go where they will and perhaps not always glued to the OT? Surely we benefit from other views?
I’ve tried contacting Willis, to talk about this subject but without success. So I will not add any comments on the substance, instead I will confine myself to: “Please don’t bother me with claims that downwelling longwave radiation from the atmosphere doesn’t exist”
The real question is not whether it exists, but whether it is radiation or heat. This is a very important distinction, and the reason the diagrams are so confusing is because those drawing them do not understand the difference. And so the fact it clearly wasn’t understood by those producing the heat flow diagrams, show that they do not understand this important distinction.
And it is very important because it is the same distinction between whether a trend “exists” or whether it is just natural variation: the most important question of all.
“ radiation or heat” is confusing. Thermal energy (aka “heat”) is transferred by radiation, conduction and convection.
Mike, you say the question is whether radiation is radiation or heat … the clue is in the names.
Since you don’t show “the diagrams” you refer to I cannot comment on them.
You and David seem confused about “heat”. David incorrectly says “thermal energy (aka “heat”)”.
Radiation is energy. It is not, however, “thermal energy”. It is energy in the form of moving photons. When these photons hit an object, whether that object is hotter or colder than the object that emitted the photons, they are absorbed by the object and converted to thermal energy. But that thermal energy is not heat.
“Heat” is energy in transit. It is the NET thermal energy that flows spontaneously from a warmer to a colder object. Or to use the thermodynamic definition:
or
Now, suppose we have a hot sun sitting alone in space. It radiates photons in all directions. And it is not receiving photons from anywhere.
Next, suppose we put a cooler sun of exactly the same size next to it. What happens to the temperature of the two suns?
The answer is, both of them get warmer. The net flow of heat is from the warmer sun to the cooler sun, in accordance with the laws of thermodynamics. But the warmer sun is absorbing photons emitted by the cooler sun, so it ends up warmer than it would be without the cooler sun next to it.
So. Can a cooler object warm a hotter object? No … but it can leave the hotter object warmer than it would be if the cooler object wasn’t there.
w.
“Heat” depends on the definition. The hotter and cooler sun example shows energy transferred from one body to another by radiation. e.g. See:
“This book is concerned primarily with energy exchange by the mechanism of thermal radiation.” Radiation Heat Transfer, E.M. Sparrow & R.D. Cess 2018 ISBN 1351420119
“Energy that is transferred from one system to another by virtue of a temperature difference is called “heat”. Sect 2.4 The First Law of Thermodynamics p66
Physical Chemistry, William F. Sheehan, 2nd Ed.
OMG, you are so out of touch Willis. You are just spouting hypotheses with no evidence to support them. You’ll be quoting Eunice Foote, John Tyndall and Svante Arrhenius next like rockyrex at the Guardian.
This sort of lukewarmism gives credibility to the warmists they don’t deserve.
Leitmotif, come back when you have the albondigas to QUOTE EXACTLY WHAT I SAID and demonstrate that it’s wrong. This is nothing but you waving your hands and flapping your lips.
w.
DELETED
As I said in the head post:
(Please don’t bother me with claims that downwelling longwave radiation from the atmosphere doesn’t exist. It has been measured, not estimated or modeled but measured, thousands of times by scientists all around the planet for over a century. If you don’t think it’s real, you need to do your homework … and in any case, this is not the place to debate it. I never delete comments on other peoples’ threads, and I almost never delete comments on my own threads, but in this case, I’ll make the exception. Please just take up the debate elsewhere, thanks.)
w.
DELETED. It appears you are a slow learner. This is NOT a post to argue about the existence of downwelling longwave radiation.
w.
DELETED
DELETED. Give it up. Take it elsewhere, as I politely requested.
w.
Willis Eschenbach. The Cancellation Police Officer.
You’re a disgrace, Willis.
Hang your head in shame.
leitmotif, I made it quite clear that I didn’t want this thread derailed by claims that downwelling IR isn’t real. I politely requested that folks discuss that issue elsewhere. I said if people posted such comments, I’d delete them.
Was there some part of that which you didn’t understand?
w.
Unknown to many people, our bodies don’t sense temperature. They sense energy flow. Feel cold? It is your body’s sensors detecting energy flow out of your 98.6 F body’s skin. Feel warm? It is your body feeling energy flow into that same skin. There are many simple experiments you can perform in your own kitchen to verify this. GOOGLE it.
There’s an interesting thing we can do with this knowledge to demonstrate a feature of radiation.
We’ve adapted ourselves such that when we are sitting in our living room bathed in IR emitted by our 70 F stuff. Our out flowing radiation from our 98,6 degree bodies is a net flow from hot to cold that we sense as neutral, and comfortable.
Now go stand near a window in winter. Your window side is no longer bathed in IR from 70 degree stuff. It feels cold because now that side is bathed in radiation from the frigid stuff outside.
When I was a kid I would say that cold is pouring through the window. I was wrong. The problem was that I was no longer being ‘heated’ by that IR that was cooler than my body. The snow and ice didnt radiate enough to keep my skin sensors neutral. Hmmmmm
DELETED. Are you really this stupid, or is it just arrogance? Stop with the attacks on back radiation
Next, you say:
And as to me “smarting” from some defeat by some guy called Joseph Postma, I have no memory of that at all. I also have no memory of who Joe is.
Sorry, I’m sure it looms large in your mind, but on my side of the screen it doesn’t exist.
w.
You know full well who Joseph Postma is, Climate of Sophistry. If you don’t you have been living on the moon. He kicked your ass out of the stadium on back radiation. I’ve seen your blogs before when Joseph Postma was cited and you didn’t pretend to not know him then.
leitmotif, I’ve written over 900 posts on WUWT. Each of them has garnered ~ 100 comments. That’s 900,000 comments, and you expect me to remember one guy? I assure you, if I was asked last week who “leitmotif” was, I wouldn’t have had a clue.
Similarly, I don’t recall any interchange with “Joe Postma”. Not saying I didn’t have one, just that along with probably 899,900 of the comments, I don’t remember that interchange.
So your attempt at reading my mind has failed. No surprise.
w.
900 x 100 is not 900,000
And you would remember it because Joseph Postma wrote an article about you. Btw I didn’t say Joe Postma, you did.
Willis Eschenbach’s Greenhouse Shell Game
Climate of Sophistry. Well named for debunking people like you.
As you might notice, I never commented at the link you posted.
Why?
Because I’ve never visited that link. There’s an entire cottage industry of folks on the web making ridiculous objections to my work. There’s not enough time in my life to waste on such nonsense.
Now that I have seen that link?
Pass. I follow the rule of pig wrestling.
w.
I attack back radiation; you attack me.
Sound familiar?
I politely ask people to discuss the existence of back radiation anywhere but on this one post. Why? Because that subject tends to spin any discussion into a black hole from which no light ever emerges. So I warn people I’ll delete such comments.
You act like an arrogant anus who is entitled to break all the rules because you’re better than everyone else, and you decide this is the perfect place to discuss the existence of back radiation.
Then when I do what I said I’d do and I delete such comments, you get all butt-hurt and start whining like a bably and lashing out.
Sound familiar?
w.
DELETED
There are two equally valid ways of representing what is going on. There is an “energy flow” perspective and a “heat flow perspective.”
In the “energy flow” perspective, energy flows in two directions. Longwave radiant energy from the surface flows upward to the atmosphere, and longwave radiant energy from the atmosphere flows downward to the surface.
In the “heat flow” perspective, radiant heat flows in only one direction (upward from the surface), and the magnitude of that heat flow is given by the difference of the two radiant energy flows. In other words, to get radiant heat flow upward, you subtract the downwelling longwave radiation flux from the flux of longwave radiation emitted by the surface.
In the “energy flow” perspective, downwelling LW radiation increases the internal energy of the surface while upwelling LW radiation from the surface decreases that internal energy.
In the “heat flow” perspective, there is a net radiative heat flow away from the surface and the rate of heat flow away from the surface is reduced because of the presence of downwelling radiation.
Analyzing the problem within either perspective yields identical predictions about what happens to the temperature of the surface. Using either perspective, the presence of downwelling radiation leads to a higher predicted surface temperature.
So, there is no question about whether what is happening is radiation or heat, it’s just a question of which perspective one wants to use to analyze the situation.
If you’re confused by the diagrams, it may be because you expect them to be heat flow diagrams when they’re typically not—and are not intended to be.
You can draw an “energy flow” diagram, a “heat flow” diagram, or a “mixed” diagram which includes heat flows for non-radiative processes, and energy flows for radiative processes.
Most “global energy balance” diagrams are of the “mixed” type. It’s possible to translate such a “mixed” diagram into a pure “heat flow” diagram, if one is more comfortable with that. (I demonstrate such translations in my energy recycling blog post and in another essay.)
Any of these types of diagram offer a valid way of analyzing a situation, provided you understand the meaning of what you’re looking at.
Willis, as always the article is exceptional. Many thanks.
Great analysis.
I see two potential gaps in this approach. First, it assumes homogeneous 3.7W/m² CO2-forcing, which in reality differs significantly over the globe. Could you include that in your calculation?
Second, some possible feedbacks might not be included, as they don’t show up in the 20-year time series. I would consider local feedback as covered, i.e., latent heat, evaporation, amount of water vapor, and clouds. That all happens within the diurnal and seasonal dynamics. What it does not necessarily include is long-term feedback, such as the relocation of the ITCZ, the Hadley cell, or the meridional heat transfer. Wich might play a role over longer warming period.
Peter Ibach May 6, 2021, 7:25 am
Good points, Peter. Someone else mentioned your first one above, and it took me a while to figure out how to measure it. I finally realized that I could use the trends in the “greenhouse radiation” in the CERES dataset. Ramanathan pointed out that the amount of “greenhouse radiation” (downwelling longwave radiation) can be measured as the upwelling longwave from the surface less the outgoing top-of-atmosphere radiation.
So I looked at the decadal trends in “greenhouse radiation” in the 20-year CERES dataset in a couple of ways. First, here’s the global view.
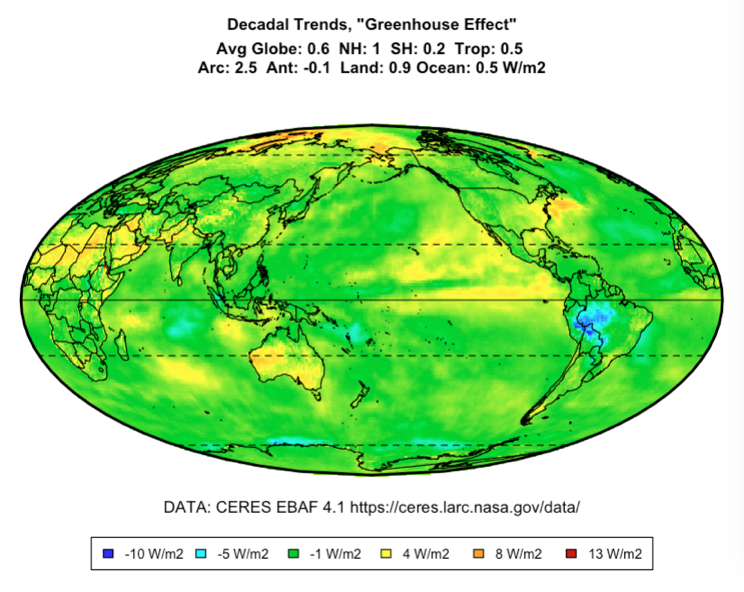
Nothing obvious there. Next, here’s a scatterplot of the same trend data versus the surface temperature.
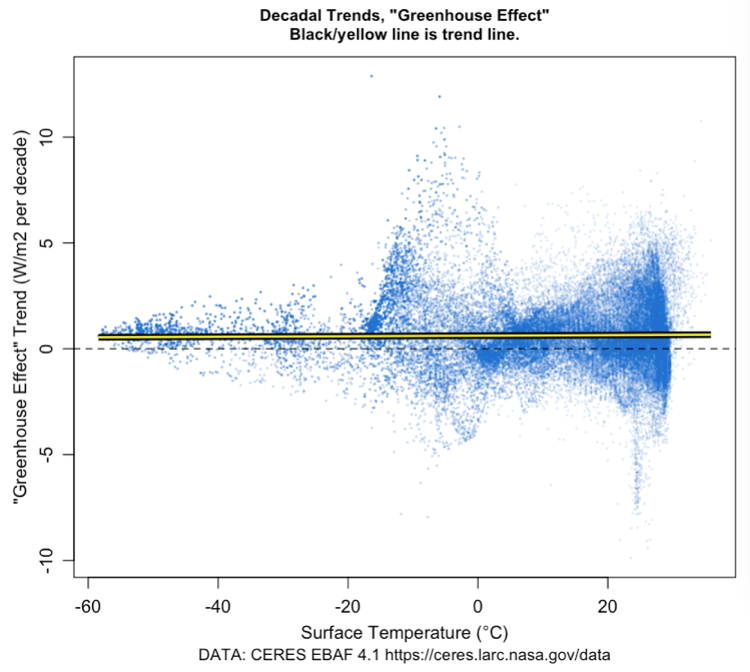
No trend of GHE radiation with temperature … go figure.
The NH land temperature varies by 27° every six months. The NH sea temperature varies by 8°C every six months. I’ve never understood the claim that somehow it takes 70 years for a step-change in CO2 to fully change the temperature. Nor have I seen any actual evidence that it is true.
And if it were true, the rise would be exponential in nature, with much of it in the first 20 years.
Finally, I don’t think that it will change my analysis in any significant way. If there is additional warming “in the pipeline”, it will warm both gridcell A and gridcell B. And the changes in downwelling radiation from increased GHGs are instantaneous. So as a result, neither ∆T nor ∆W will change … and thus dWdT won’t change.
My best to you,
w.
W. ==> There you again see the “strange attractor” non-liner phenomenon in the blue scatter chart.
Any ideas on that?
I guess you missed the comment where I demonstrated that. It’s from the variable changing quickly in the N/S direction, and both changing slowly and returning to its original value in the E/W direction. This leads to “chains” of data that you see in a number of these plots. Not non-linear, not “strange attractor”. It’s an artifact of the digital nature of the graphs.
w.
w. ==> Sticking with that, huh?
Willis
Interesting that in polar regions (<240 W/m^2) OVER LAND there is a strong postive warming response as indicated by the large peak in figure 5.
I’m not sure if anyone has ever explained or theorized as to how it is that polar regions over land have such an extreme response compared to other land areas.
May be a good topic for future
3.7 is at ToA, not surface.
Good point. It will increase the response by about 30%. Here’s the relationship between TOA downwelling longwave and surface downwelling longwave. As usual, it’s complex.
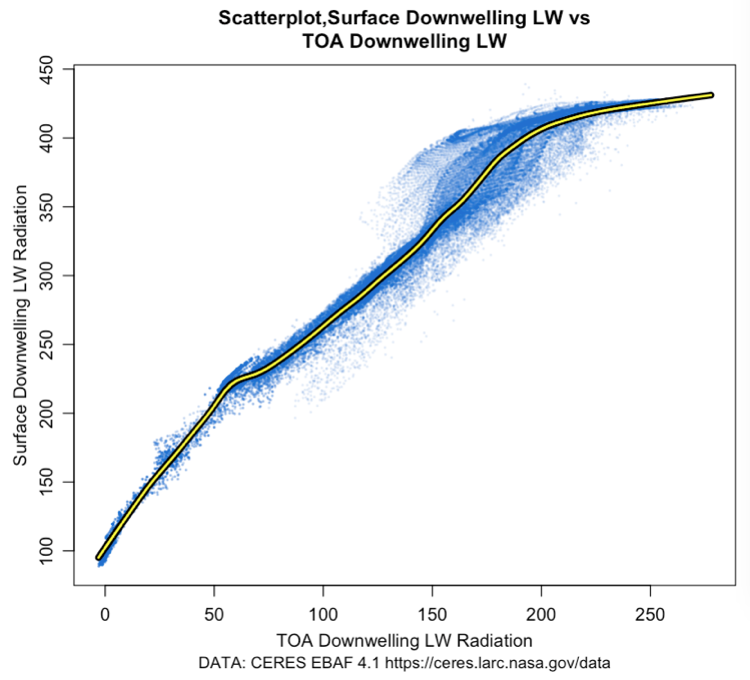
w.
That’s only the initial value. Then surface heats > atmosphere heats > more LW to the surface > surface heats …
Correction. It’s not even the inital value. Wonder what you are showing. EBAF 4.1 web tool gives outgoing LW at 20 km.
As Ramanathan pointed out, the TOA downwelling LW (AKA “greenhouse radiation” is the surface upwelling longwave minus the TOA upwelling LW. That’s what I’m showing.
Regards,
w.
Thanks, strange though since there is no downwelling LW at ToA (or 10 watts at 20 km according to MODTRAN).
https://en.wikipedia.org/wiki/Climate_sensitivity
“The radiative forcing caused by a doubling of atmospheric CO
2 levels (from the preindustrial 280 ppm) is approximately 3.7 watts per square meter (W/m2). In the absence of feedbacks, this energy imbalance would eventually result in roughly 1 °C (1.8 °F) of global warming. This figure is straightforward to calculate using the Stefan-Boltzmann law and is undisputed.”
and the calc is shown under Notes.
So, I still don’t understand your “expected per Stefan-Boltzmann”
“Expected by Stefan Boltzmann” in my chart above is the calculation of dTdW using total surface downwelling LW + SW applied to the derivative of SB equation, times 3.7.
So for example, at a surface downwelling of 400 W/m2,
dTdW = 16.2* W^0.75 = 0.18°C, times 3.7 = 0.67°C/2XCO2
Now, for the “no-feedback” situation, your source (Wikipedia) says:
I don’t understand this at all. Why use the “effective temperature” of the earth of -18°C when we’re talking about the real earth? That makes no sense.
Using the actual temperature of the earth, 288K, in their formula gives a “no-feedback” warming of about 0.7°C / 2XCO2
From my calculations above, I get a somewhat smaller number of 0.5°C / 2XCO2. This makes sense to me because the surface loses heat to the atmosphere by a number of non-radiative methods. As a result, for the system to come back into balance, the surface doesn’t warm as much—some of the change comes from the warming of the atmosphere, which then radiates some of that heat to space.
For example, thunderstorms move heat from the surface to the upper troposphere with almost no loss to GHG absorption. They do this by first moving the heat from the surface to the clouds as latent heat, which doesn’t radiate and thus isn’t absorbed by the GHGs.
From there, it is moved upwards inside the cloud tower, where it cannot radiate out to interact with GHGs.
This operates as a heat pipe that avoids the GHG absorption, and thus radiates more heat to space without further warming of the surface.
w.
“is the calculation of dTdW using total surface downwelling LW + SW applied to the derivative of SB equation, times 3.7.”
I have to ask, what would your calcs look like for a rock planet without GHE? I don’t understand why they have mixed effective temp and surface temp. Seems like some assumption(s) missing.
For me to make any progress I need to know:
At present I’m guessing yes to both.
You don’t have to point out yes to w or w/o 🙂
Not clear what you mean by “initial value”. The downwelling surface LW is the net of all of that.
w.
I ment the initial LW before it is amplified by the greenhouse loop like I tried to indicate. Using Modtran you have to offset temperature 1 degree to restore LW out at ToA, after a CO2 doubling, and the LW down at surface has then increased 8 watts. So I doubt “The downwelling surface LW is the net of all of that.”
[edit.
Modtran: relative humidity fixed, 1976 std atmosphere, NOAA cirrus model]
lgl, the downwelling surface lw CERES dataset is the net of all of the “greenhouse loops”. It is what is actually radiating downwards, not some theoretical first change in the radiation that needs to be adjusted. It is reality, not theory.
You also say:
Curiously, I was just looking at that yesterday. Here’s what I found necessary to restore LW out after a doubling from 275 to 550 ppmv.
That’s without clouds.
w.
I haven’t come to your reality yet. Can we stick to theory for now?
I guess your Modtran runs are with water vapor pressure fixed.
Isn’t it commonly believed that relative humidity will remain constant?
Or ask Brian Rose 🙂
http://www.atmos.albany.edu/facstaff/brose/classes/ATM623_Spring2015/Notes/Lectures/Lecture03%20–%20Climate%20sensitivity%20and%20feedback.html
https://brian-rose.github.io/ClimateLaboratoryBook/courseware/sensitivity-feedback.html
Sorry, Ferd, but that dog won’t hunt …
w.
==========
Willis, I should have added a /sarc tag. I was replying to Nic.
As I understand your paper, you are starting with the consensus position in climate science that increased CO2 causes warming and answering the queation “how much”.
Maybe i misunderstood Nic’s objection, but from what I read he appeared to be arguing that you had not proven that CO2 causes warming. Only that there is a correlation.
I was pointing out that correlation exist all over the place and can “prove” anything you want. It seemed obvious to me that you were not trying to prove that CO2 causes warming. Or that warming causes CO2.
Rather you were trying to answer this question “GIVEN that increase CO2 will lead to increased radiative forcing what is the Equilibrium Climate Sensitivity to this forcing”.
As I read Nic, I understood him to be arguing that since you have not proven the “given” your results for ECS cannot be correct.
I was rejecting Nic’s argument. A “given” is established by citation. Otherwise you would have to go back to ultimately proving that 1+1=2.
More back radiation nonsense from a lukewarmer.
It might take awhile to fully digest this post. My brain doesent work as fast as it did at one time. It seems other factors might also be relevant. Such as time of year and latitude. Or it could be that I am over complicating things.
The Antarctic has cooled since 1995, and the AMO and Arctic warming since then is a response to a net decline in climate forcing. The polar see-saw. Ocean phases respond inversely to net changes in climate forcing, the warm AMO is driving most of the Arctic warming.
If rising CO2 forcing projects onto the natural variability of atmospheric teleconnections, it should not be increasing heat transport to the Arctic by increasing positive AO/NAO conditions.
https://archive.ipcc.ch/publications_and_data/ar4/wg1/en/ch10s10-3-5-6.html
My thanks to LgL for pointing out that the 3.7 W/m2 estimate change from CO2 doubling is at the top of the atmosphere (TOA), not the surface where I applied it. This has increased the estimate of the response to half a degree per 3.7 W/m2 increase in forcing, instead of the third of a degree previous estimate. I’ve updated the head post.
w.
DELETED
As I said in the head post:
(Please don’t bother me with claims that downwelling longwave radiation from the atmosphere doesn’t exist. It has been measured, not estimated or modeled but measured, thousands of times by scientists all around the planet for over a century. If you don’t think it’s real, you need to do your homework … and in any case, this is not the place to debate it. I never delete comments on other peoples’ threads, and I almost never delete comments on my own threads, but in this case, I’ll make the exception. Please just take up the debate elsewhere, thanks.)
w.
You sound like the Back Radiation Police, Willis. Eben has been cancelled.
Leitmotif, there are lots of places on the web to debate the existence of downwelling radiation. I made it crystal clear at the head of my post that this was not one of them. This is a post for discussing my curious method for determining the surface temperature response to changes in downwelling radiation, NOT whether such radiation exists.
And as I do my utmost to be, I was true to my word, deleting comments on that subject.
If you want to whine about that, you’re both dumber and more arrogant than you generally seem otherwise. When the big sign says “KEEP OFF THE GRASS”, you should keep off the grass, duh, and not whine about “grass police”.
Finally, I have neither the power nor the desire to cancel anyone. If Eben got canceled, that’s between him and the moderators. Nothing to do with me. All I did with him was what I did with you—deleted what I clearly stated from the top I would delete.
w.
DELETED. Go whine elsewhere about how you’re being treated so krool.
w.
DELETED. How about you discuss the topic of the post, instead of endlessly acting like a six-year-old?
w.
DELETED. You really are a slow learner. I am NOT going to debate the existence of downwelling longwave on this thread. I said that at the start, I said it in the middle, I say it again. Not gonna happen.
w.
DELETED
DELETED. I simply asked people to not try to sidetrack this post into an endless discussion of whether downwelling radiation exists. I pointed out that there are lots of places to make that case, but this isn’t one of them.
But nooo, such polite requests are not for you. You’re above it all, you want to lay down, beat your fists on the floor, and have a tantrum instead of just making your argument on any of a thousand other threads on the web.
Take it elsewhere. This is NOT the post for that.
Why is this so hard for you to grasp? I’m not “censoring” you. I’m trying to prevent you from spinning this thread into a meaningless argument. Lots of places you can do that. Not here.
w.
DELETED