Reposted from Dr. Roy Spencer’s Blog
January 21st, 2021 by Roy W. Spencer, Ph. D.
As part of my Jan. 19 presentation for Friends of Science about there being no climate emergency, I also examined surface temperature in Canada to see how much warming there has been compared to climate models.
Canada has huge year-to-year variability in temperatures due to its strong continental climate. So, to examine how observed surface temperature trends compare to climate model simulations, you need many of those simulations, each of which exhibits its own large variability.
I examined the most recent 30-year period (1991-2020), using a total of 108 CMIP5 simulations from approximately 20 different climate models, and computed land-surface trends over the latitude bounds of 51N to 70N, and longitude bounds 60W to 130W, which approximately covers Canada. For observations, I used the same lat/lon bounds and the CRUTem5 dataset, which is heavily relied upon by the UN IPCC and world governments. All data were downloaded from the KNMI Climate Explorer.
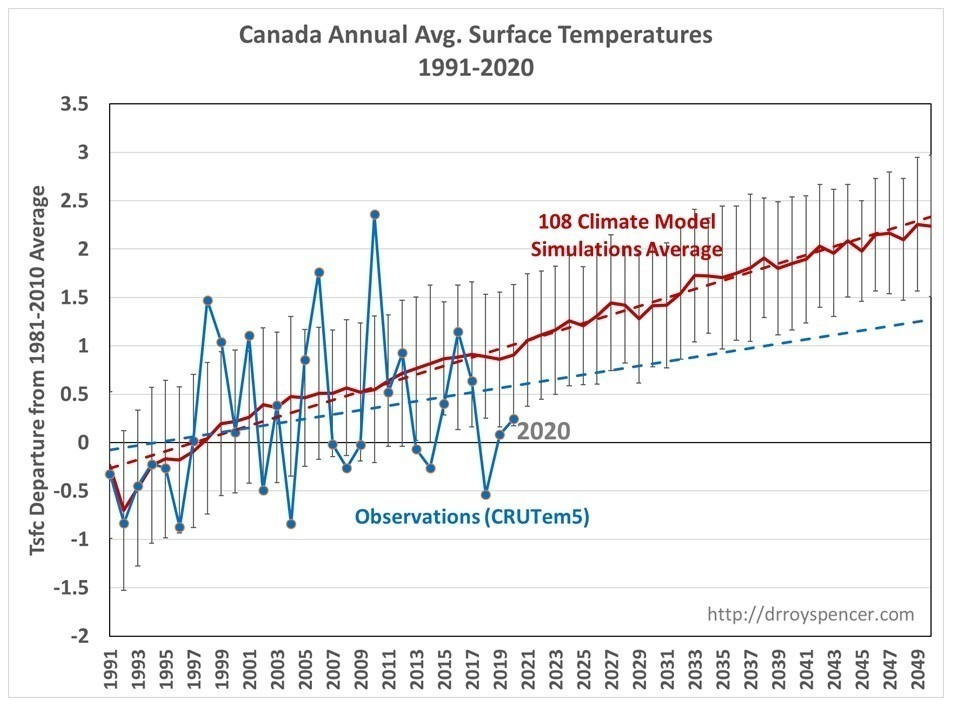
First let’s examine the annual average temperature departures from the 1981-2010 average, for the average of the 108 model simulations compared to the observations. We see that Canada has been warming at only 50% the rate of the average of the CMIP5 models; the linear trends are +0.23 C/decade and +0.49 C/decade, respectively. Note that in 7 of the last 8 years, the observations have been below the average of the models.

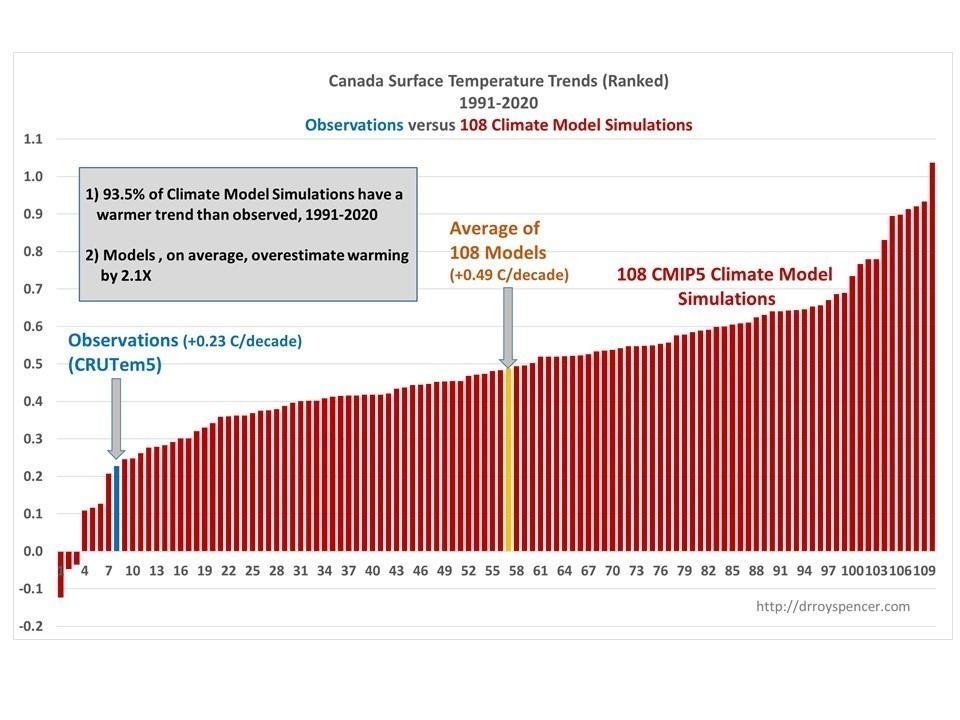
Next, I show the individual models’ trends compared to the observed trends, with a histogram of the ranked values from the least warming to the most warming, 1991-2020.

Note that the 93.5% of the model simulations have warmer temperature trends than the observations exhibit.
These results from Canada are generally consistent with the results I have found in the Midwest U.S. in the summertime, where the CMIP5 models warm, on average, 4 times faster than the observations (since 1970), and 6 times faster in a limited number of the newer CMIP6 model simulations.
Implications
The Paris Climate Accords, among other national and international efforts to reduce greenhouse gas emissions, assume warming estimates which are approximately the average of the various climate models. Thus, these results impact directly on those proposed energy policy decisions.
As you might be aware, proponents of those climate models often emphasize the general agreement between the models and observations over a long period of time, say since 1900.
But this is misleading.
We would expect little anthropogenic global warming signal to emerge from the noise of natural climate variability until (approximately) the 1980s. This is for 2 reasons: There was little CO2 emitted up through the 1970s, and even as the emissions rose after the 1940s the cooling effect of anthropogenic SO2 emissions was canceling out much of that warming. This is widely agreed to by climate modelers as well.
Thus, to really get a good signal of global warming — in both observations and models — we should be examining temperature trends since approximately the 1980s. That is, only in the decades since the 1980s should we be seeing a robust signal of anthropogenic warming against the background of natural variability, and without the confusion (and uncertainty) in large SO2 emissions in the mid-20th century.
And as each year passes now, the warming signal should grow slightly stronger.
I continue to contend that climate models are now producing at least twice as much warming as they should, probably due to an equilibrium climate sensitivity which is about 2X too high in the climate models. Given that the average CMIP6 climate sensitivity is even larger than in CMIP5 — approaching 4 deg. C — it will be interesting to see if the divergence between models and observations (which began around the turn of the century) will continue into the future.
How does Canada have a temperature, the land mass is so diverse and large?
“But this is misleading.”
“I continue to contend that climate models are now producing at least twice as much warming as they should”
Yes it is, given you’re comparing the cherry-picked Canada region with global.

That is ADJUSTED and FRAUDULENT temperatures, Loy-dumb
They have absolutely NO RESEMBLANCE to what was actually measured
SH data on those FAKE graphs of yours is a complete JOKE.
Only Australia and South Africa had any data.. ocean data is totally FABRICATED (ask Phil Jones)
Australian peak temperatures, well above current, were in the 1880 -1910 period.
And South Africa.. Warmer or similar to now in the 1940s
Your graphs ARE A LIE, loy-dumb !!
———-
This topic is about Canadian temperatures, which are mostly Arctic.
STAY ON TOPIC, mindless twerp. !
Let’s see what Hanson has to show about the Arctic
Climate science is the only field of science where you can combine dozens of wrong answers and have them average out to a correct answer.
If you can point to a place in the world where temperatures are rising faster than the models have predicted, you will be the first to have done so.
Choke on this, Loy’DOH!
BTW, Loy’DOH. Have you figured out how long your record is?
Right. Loydo gets 0/10 for accurate information but he does get an “attaboy” for supporting his comments with something. If he could just start supporting them with something relevant we might be getting somewhere. Btw – Griff needs to start learning the same practice.
http://www.john-daly.com/stations/eureka.gif
http://www.john-daly.com/stations/resolute.gif
http://www.john-daly.com/stations/inukjk-2.gif
Absolutely NO WARMING in isolated places in Canada last century.
And as the graph I showed elsewhere attests.. no COOLING since 1998 El Nino
correction
And as the graph I showed elsewhere attests..COOLING since 1998 El Nino
From the article: “We would expect little anthropogenic global warming signal to emerge from the noise of natural climate variability until (approximately) the 1980s. This is for 2 reasons: There was little CO2 emitted up through the 1970s, and even as the emissions rose after the 1940s the cooling effect of anthropogenic SO2 emissions was canceling out much of that warming.”
“That is, only in the decades since the 1980s should we be seeing a robust signal of anthropogenic warming against the background of natural variability, and without the confusion (and uncertainty) in large SO2 emissions in the mid-20th century.”
end excerpts
This seems to be contradictory. The claim is SO2 emissions were cancelling out warming after the 1940’s, and then says there is uncertainty about SO2 emissions during this period. So I assume there is also uncertainty in claiming SO2 cancelled out warming.
I would love to see a detailed discussion of SO2’s effects on the Earth’s atmosphere and temperatures. I know a large volcano can lower the temperature about 0.5C for a year or two, but that requires a huge volcanic eruption, and the effects only remain in the atmosphere for a couple of years.
In order to reduce temperatures after 1940, human-derived SO2 concentration would have to equal a huge volcano’s emission and would need to do that continuously for decades.
Explain to me how human-derived SO2 can affect the temperatures more than just incidentally.
I feel like I’m back in the 1970’s arguing Human-Caused Global Cooling. 🙂
Wasn’t everyone with a power station desperately trying to scrub out the SO2 from their emissions during the 80’s, after the acid rain scaremongering of the late 70’s? As different countries brought in different regulations and different ways to tackle it at different times, that might make for a confused signal in the 80’s. Can’t help you with the rest though.
Here’s the U.S. surface temperature chart (Hansen 1999). Let’s look at this chart in relation to temperature changes over the decades.
The world’s largest volcanic eruption to happen in the past 100 years was the June 15, 1991, eruption of Mount Pinatubo in the Philippines.
This eruption lowered the global temperatures by about 0.5C and this effect lasted for about two years before the atmosphere cleared itself (the volcanic emissions reflect sunlight in the upper atmosphere which cools the Earth).
If you look at the U.S. surface temperature chart, it shows a drop of about 2.5C from 1934 to 1980, so the way I look at it, it would take numerous Mount Pinatubo-equivalent eruptions over a period of 40 years to equal the cooling that took place during that time.
And then, of course, you have to account for the fact that temperatures actually rose during the 1950’s. SO2 must have taken a break during that period, or maybe CO2 overcame SO2 during that period, or maybe it’s all caused by Mother Nature and humans have nothing to do with it.
Show me that human-derived SO2 can lower the Earth’s temperatures to the extent that is impled in the article. Show me that the production of human-derived SO2 is the equivalent of multiple Mount Pinatubo eruptions. Show me that human-derived SO2 can get high enough in the atmosphere to have an effect.
Those are the kinds of details I would like to see.
Oops!
https://www.wolframalpha.com/input/?i=canada+temperature
When you read the new study of UHI it calculated bias around 60%. Are this and the UHI study prooving each other? I think they might. https://wattsupwiththat.com/2021/01/22/a-new-look-at-the-urban-heat-island-effect/
….And only 1/4 the rate of the Canadian models, which are the high end prediction ones. The Canadian models were developed in a CO2-water-vapor-amplified echo chamber.
weird. that actually looks like NO warming.
Canada is warming at twice the rate of everywhere else, so everywhere else must be warming at 1/4 the rate of the models.
Dr Spencer
Last year working with the Friends of Science, I investigated the Canadian temperature record for 12 major cities across the country. I looked from coast to coast, in locations where good records are available over the long term that capture the earlier periods in the 1920s and 1930s. In a number of locations, good records go back to the 1880s. I used the information available online from the Government of Canada, so it is homogenized which may alter the raw data. However, the results I found were surprising, at least to me.
On average, winters are getting warmer and nights are getting warmer. That makes sense in that the climate effects are to delay cooling by slowing the escape of heat to space. That is why the average temperatures in Canada are increasing. However, the interesting fact is that summer daytime temperatures are not increasing, or increasing only to a very small extent.
In the 12 Cities I looked at, 4 have seen a decreasing Tmax daytime temperature trend over the record, 6 other cities have only seen Tmax minor warming (I defined this as less than 0.5 degrees per century). Only Toronto (0.62) and Victoria (1.57) had increases of daytime Tmax above 0.5 degrees/century.
This is paralleled by the trends in summer Hot Days. Looking at Hot Days in July where Tmax climbs over 30 degrees C, for the 12 locations, one often finds a decreasing trend in July Hot days over the temperature record. Seven cities have seen a decrease in the number of July Hot days over 30 degrees. Four of the cities had only a minor July Hot day increase of less than 1 day per century. Only Toronto exceeded that at 1.23 additional annual hot days in July over the last 100 years.
For four of the Cites investigated, the warmest decades were well in the past: Calgary in 1920s, Ottawa in 1910s. and Saskatoon and Regina in the 1930s. Winnipeg had their warmest decade in the1980s. Only Toronto, Montreal and Quebec City had the warmest decade in the last 10 years.
Looking at temperatures based on averages of a country the size of Canada is misleading. From my investigation, I would say the warming in the locations investigated is positive. The warming is at night or in winter. Given our cold winters and having lived in Winnipeg, Toronto and Calgary, I see that as a good thing as the winters of the past when I was young were cold and severe. More importantly, summer days are not getting significantly hotter and, in many cases, they are getting somewhat cooler. Canada is not heating up or on fire. Our temperature is moderating with less divergence in extremes, day to night and summer to winter. Winters are less cold and summers are still comfortable with nights seeing less cooling, which we also appreciate up here when camping or at the cottage.
Funny, isn’t it: all of the “evidence” that we are indeed warming very, very fast (i.e., extinctions, floods, dogs and cats living together) is there…but the actual measurement isn’t.
Why, that could lead someone to believe that, perhaps, the International Union of Scaremongers (Climate Division) are deliberately confusing gross and net, which can get you jailed in business…