Guest Post by Willis Eschenbach
I’ve read comments from several folks claiming that despite the COVID lockdowns reducing emissions, there’s been no corresponding decrease in the airborne CO2. Here’s a typical claim, complete with graphic, saying that this proves that human emissions aren’t the reason for the gradual increase in airborne CO2.
The COVID shutdown reduced man’s emissions of CO2 by about 20%. Yet the growth of CO2 in the atmosphere then was almost EXACTLY what it was during preceding years.

What didn’t change was natural emissions. So much for Willis’s [saying] “it’s man made”, and settled science.
Hmmm … y’all who know me know that I’m a data guy. So I thought I’d take a look at the situation. I reasoned that a “year-over-year” comparison would be much more valuable than the more general graph above. A year-over-year comparison is a graph showing, for each month in the record, how much the CO2 level increased over the same month in the previous year. If we want to understand changes in CO2, we need to look at changes in CO2, not the absolute values the commenter used above. Airborne CO2 has been growing at about 2.5 ppmv per year or so. Figure 1 shows recent data detailing the year-over-year growth in airborne CO2.

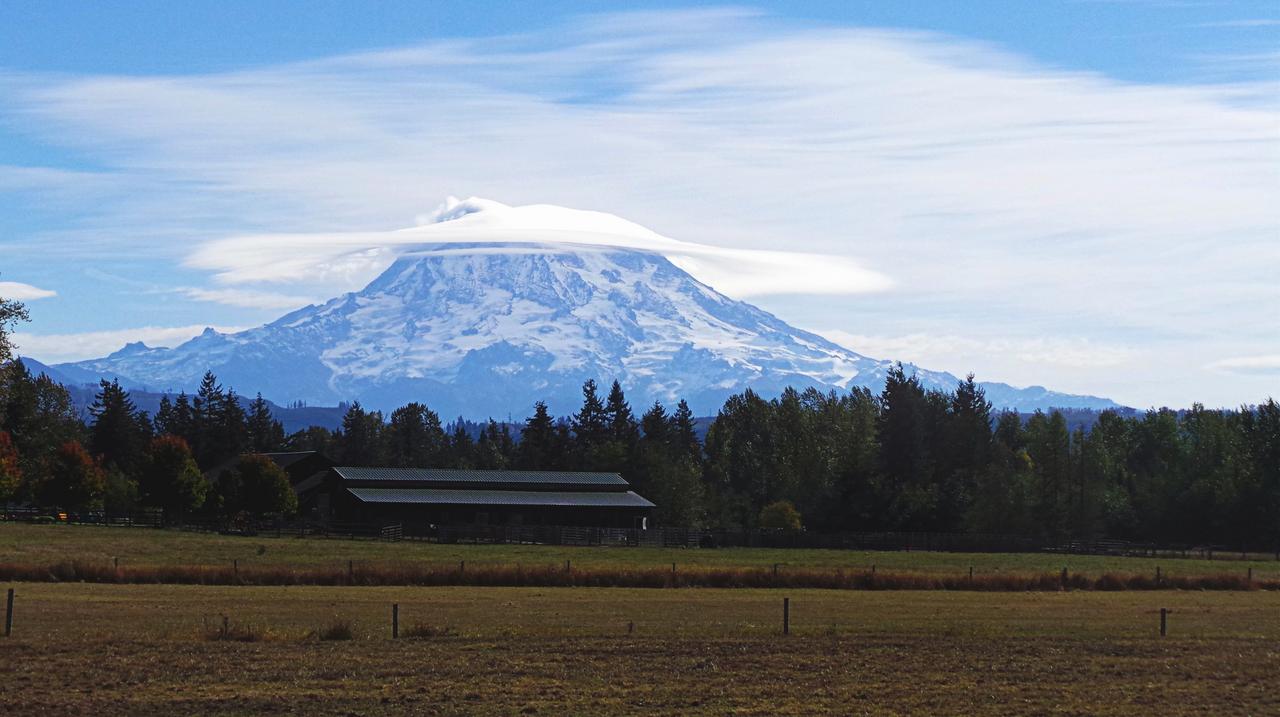
Figure 1. “Year-over-year” analysis of airborne CO2. Each data point shows how much the airborne CO2 increased over the same month a year previous. Units are parts per million by volume (ppmv). Data is from the CO2 station on Mauna Loa mountain on the Big Island. Photo is of Mauna Kea in Hawaii, the other major mountain on the Big Island.
Hmmm … didn’t really expect that the variation would be quite that large. The big peak in the middle is from the El Nino/La Nina of 2015-2016. The peak and drop at the start if from the Nino/Nina of 2009-2010. What causes the other variations is far from clear. What is clear is that the values vary from smallest to largest by no less than four hundred percent, from an annual increase of less than one part per million by volume (ppmv) to an increase of over four ppmv … a large natural variation.
Next, we have to ask the question the commenter who I quoted above didn’t ask—just how much would we expect the CO2 to change due to the lockdowns?
Now, the author of the comment above says there’s been a 20% decrease in 2020 emissions … but that makes my Bad Number Detector start ringing. In general, carbon emissions for the globe, as well as the resulting changes in global atmospheric CO2 levels, are a linear function of global Gross Domestic Product (GDP). The GDP is the sum of all of the goods and services produced during the year.
And as you’d expect, if we increase the amount of stuff we make, we increase the CO2 emissions correspondingly. (For the math inclined, global annual carbon emissions ≈ 6.3 Gtonnes + .4 * global GDP (trillions of constant 2010 $).
Looking around the web, I see estimates for the lockdown-caused drop in 2020 GDP of from 4.5% up to 5.3%. And since emissions and the resulting atmospheric levels are a linear function of GDP, that would mean that the year-over-year CO2 increase should be smaller by something on the order of five percent.
This lets us calculate what the increase in CO2 would have been if there were no lockdowns. Over 2020 you’d expect CO2 emissions, and thus the resulting annual airborne CO2 increase, to have been 5% greater if there had been no lockdowns.
So to be very conservative in our estimate, let’s say the lockdowns actually decreased emissions by twice that, or 10%. If we use ten percent as our figure, our results will be solid.
So … what would the Figure 1 graph above look like without that 10% drop in 2020 emissions? Figure 2 shows that result. Just for interest’s sake, I’ve also added what a 20% difference in emissions would look like. That’s four times the actual ~ 5% change expected from the drop in GDP.
Of course, up to 2020 there is no change …

Figure 2. As in Figure 1, but with lines added showing a 10% (yellow) and a 20% (orange) increase in CO2 no-lockdown emissions would look like.
Again … hmmm. Gotta say, in a system that variable, a 10% or even a 20% difference is not distinguishable from the background. I mean, any one of those three lines is totally believable.
Conclusions
My main conclusion is that despite the huge, almost incalculable human cost of the lockdowns, the change in the rate of increase of CO2 is lost in the noise … which certainly doesn’t prove anything either way about whether the increase is human-caused.
My other conclusion is that this should give great pause to those who are blithely recommending totally restructuring the global economy to replace fossil fuels … look at the real-world costs of the lockdowns all around you, and look at the meaningless CO2 benefits in the graph above. Not worth doing on any planet.
My best wishes to all in this most curious year of 2020, can’t be over soon enough for me,
w.
PS—For those wondering about a CO2 observatory on the side of an outgassing volcano, see my post Under The Volcano, Over The Volcano.
PPS—When you comment, please quote the exact words you are discussing. I can defend my own words. I can’t defend your interpretation of my words.
Human CO2 emissions are a piffling 4% of the total emissions. If we reduce that, it will not only be imperceptible but will make room for even more emissions from the oceans. Nothing will change.
About half of all human emissions of CO2 are net absorbed into the ocean. That’s because we have increased the atmospheric partial pressure of CO2 above equilibrium with the ocean. If we stop our CO2 emissions, the ocean will continue to absorb CO2 until the partial pressures are in equilibrium. It wouldn’t take long, there’s a half-life of I think about 12 years.
Reducing our CO2 emissions won’t “make room for more emissions from the oceans”, because we would still be adding to CO2 partial pressure in the atmosphere, but it would slow the rate at which the ocean net absorbs.
If you decrease the overall partial pressure of CO2 attributable to human emissions (or in any other way, say by “removing CO2 from the atmosphere by ‘Geoengineering’!) you would get more outgassing from the oceans! This looks like a perfect example of Le Châtelier’s Principle, that if you change some element of a system – composition, temperature, pressure… the entire system evolves in a direction to resist the imposition of the initial change.
As a result of the principle, one should always as a first approximation, expect changes to complex systems to be much, much less than expected. The more complex the interacting system the more degrees of freedom there is to resist the change. Chemists take advantage of this well known effect to increase production of products.
Strangely, outside of chemistry, the universality of the principle seems to be little known by physicists and other scientists who must think it’s a quirky little chemistry thing. Climate scientists have probably never heard of it.
In recent decades, it has been recognized by some as more generally applicable beyond chemistry and that it may be a major law of nature. The economist Samuelson when he heard of it said that it perfectly fits with supply-demand-price relationships. Newton’s third law seems a subset of the principle. If you push on a stone wall, it pushes back increasingly as you apply greater force, resisting dislocation. Obviously its resistance at some point can be overcome. The other newtonian laws, too, in more complex ways can be so interpreted.
Back EMF in an electric motor just turned on is an example. Once you get a motor beginning to turn over it also suddenly becomes a generator of current that opposes the current fed to the motor. The dimming of lights in the same circuit is a measure of the resistance of the motor trying to remain at rest for inertial reasons and because of the “generator” effect. It would be a delight to watch the linear -thinking proponents of geoengineering (a gang of geographers?) finding out that they had to empty the ocean of CO2 as well as the atmosphere over a few millennium to detect a change with puny machines and hopefully using the Rockefeller Foundation’s billions to do it.
” the resulting atmospheric levels are a linear function of GDP,”
It is spurious to claim that the resulting atmospheric CO2 are linear with GDP. Causation a la correlation. Just because they both are increasing does not mean that they are related. As the sun comes up, traffic on our main road increases as well. So, sunlight causes traffic.
BTW, chemicals cannot be at “levels” only” concentrations.” It’s the CO2 concentration in the atmosphere.
I’m not sure what you mean. In my experience as a chemist that deals with atmospheric measurements quite regularly, levels and concentrations are nearly synonymous. A “level” has perhaps a connotation of being less precise but is perfectly fine to use in that context. I don’t see an issue with regard to this usage here.
Yep. “Level” is like “amount.” It’s a generalized term.
Although my marine science professor was a serious nitpicker. If you used “amount” where you could have used a more specific term, your answer was wrong.
They are both functions of economic activity. Economic activity leads to CO2 emissions from consumption of fuels, production of cement, fertilizer, etc. As an approximation, over the short term a linear relationship is realistic.
Figure 2 does not appear to show a linear relation between GDP and CO2 concentration, unless GDP was bouncing around a lot.
The linear relation is between GDP and human emissions, obviously.
The “bouncing around a lot” has to do with events occurring all over the world, such as El Nina.
The GWP is not bouncing around. It superimposes its CO2 effect on the natural bounces.
We need a graph that separates natural “bouncing around” from the GWP contribution.
It is likely the GWP-graph of CO2 contribution is a well-behaved upward line, with slight dips, due to recessions and the present dip, due to COVID.
9 gigatons of CO2 is equivalent to 4 ppm in the atmosphere
The atmosphere CO2 increases by about 2 ppm, due to 4.5 gigatons of CO2 from human activity.
That means 4.5 gigatons go into the oceans and the biosphere.
The oceans and biosphere misbehave somewhat, such as El Niño, which causes differences from one year to the next up to 4 ppm, as graph 1 shows.
This is ocean too. The 4% by humans is lost in the noise. Willis mentioned his surprise at the range and noted the fit to ENSO.
It seems to me that certain economic activities will have disparate effects on GDP and CO2.production (I prefer “production” to “emissions.” CO2 is the building block of the biosphere. It is a good thing. The air contains very little of it. Hence production.)
Many types of transportation seem to have come to a virtual standstill.
People are getting stuff delivered more often, instead of driving to a store.
Airline travel, especially internationally, is way off.
The cruise ship industry has ground to a halt.
Housing is apparently doing well as people are moving out of big urban centers.
So, does a billion dollars in GDP from building homes entail more fossil fuel usage than the same amount of GDP from tourism?
Perhaps there is a better proxy for CO2 production than GDP.
Maybe look at actual fossil fuel usage?
But to make stuff one needs to use fuel, which leads to CO2 emissions. It may be a big generalization but its true on a global scale and even on the tiny Etsy-seller scale, trying to make ends meet making masks.
The formula shown is just a curve fit, he doesn’t mean to imply that even single $ of production requires the exact same amount of CO2 to be produced.
While correlation doesn’t prove causation, the Willis gave a mechanism by which CO2 emissions and GDP can be linked.
Do you care to actually deal with the argument that was given?
Do you argue that human emissions are unrelated to GDP levels? If so, care to present a counter argument?
Emissions, GDP, CO2 levels. So???
None of this leads to a MEASUREMENT of how much any of this changes the temperatures.
Nor was it ever intended to.
Not every discussion is about temperature.
Exactly Gerald. I thought that was the crutch of the argument. i.e. does CO2 from fossil fuels drive up global temperature? If the answer is no, then why bother.
Peter,
Why bother?
Because there has been a separate question (dispute, controversy, disagreement…) of the degree to which burning of fossil fuels is causing or contributing to the gradual increase of atmospheric CO2 concentration.
That is why.
And this sudden slowdown in general human activity all over the entire globe, all at once like, is a unique event in recent history, and which has an obvious potential to shed some light on that question.
The huge variability of how much CO2 increases over time, as described by Willis, shows fairly clearly that noise is larger than the signal. At least it seems to be so at first glance.
One question that is raised and not addressed in detail is, what exactly are the factors that cause this huge variability?
But it is addressed to the extent that some of the variability seems to be related to the ENSO cycles. Could variations in sea surface (or of some upper layer of the sea) temperature explain all of the variability?
That is one question that could be looked at in more detail.
Another approach may be to look for a correlation with various measurements of global average temperature, such as GAST, sea surface temp, land temperature, which would tend to effect growth and death of vegetation, as would global rainfall patterns, and even the satellite lower troposphere temperatures.
I seem to recall Murry Salby had some thoughts on this aspect of the question of increasing CO2 levels.
All of this reminds me a little of the whole exercise of trying to explain recent small variations in temperature, when no one has any clear understanding of the causes of much larger trends in variation over much longer periods of time.
At least with the question of emissions vs rising atmospheric CO2, we have some chance of finding a correlation as we move through time, whereas the larger question of variations in global temperatures is likely to remain impossible to answer, as long as most people doing any research on the question consider the case closed.
Yes it does, by making it light enough for human commerce to resume absent artificial inputs.
Lets say that the shut downs, by the largest emitters, during the last six months reduced human emissions by 5%. We are told that around 120 ppm increase since 1880 is due to human made CO2. We would see a reduction of around 6 ppm during the last six months regardless of the seasonal fluctuation. I did not see anything like that on the Keeling Curve. My argument is that human CO2 is a lot less than what we are told. My view is that there is no correlation between human CO2 and global temperatures. Perhaps temperature is the driver of CO2?
From a condition monitors point of view.
The fundamental correlation is of GDP (y-axis) with energy consumption (x-axis). It is a very linear function because work requires energy. Although the slope is less than 1 due to efficiency gains. Energy consumption (x-axis) vs CO2 emissions (y-axis) is also very linear because something like 85% of our primary energy is derived from fossil fuels.
This leads to a correlation of GDP and CO2 emissions.
True there is a correlation between the two (IE they move in the same direction). However not all work requires the same amount of energy. Some sectors of the economy use more fuel/produce more CO2 than other sectors. If all sectors dropped equally, than a linear assumption would be valid. But all sectors did not drop equally. Some sectors were hit much harder than other sectors, a linear assumption can’t be validly assumed
For example (to put some simple numbers for illustrative purposes) if we have a 100 units of GDP representing CO2 emissions of 100 units and 4 sectors of currently equal GDP size (GDP of 25 units each) . Sector 1 is responsible for 80 units of CO2, Sector 2 for 10 units of CO2 and sectors 3 and 4 are responsible for 5 units each.
Now if I told you that GDP dropped by 20 units, how many units of CO2 would you expect it to drop by? Well a simple linear function will tell you 20 units. But that’s only correct if the drop was evenly spread across all sectors. if the drop only occurred among sectors 2 thru 4, leaving sector 1 untouched, the drop would be considerably less than 20. but if it occurred primarily among sector 1 it would be considerably more than 20.
In short a linear assumption cannot be assumed unless you are also assuming a uniform drop across all sectors of the economy, which is not what happened with COVID. so bad assumption from the outset.
“Some sectors of the economy use more fuel/produce more CO2 than other sectors.”
Exactly.
I should have read more comments before adding my own further up the thread.
This is exactly what came to my mind as I read through the headline post.
It seems to me there is probably a large variation between sectors.
And some seem to perhaps be the very ones most affected by the pandemic lockdowns, restrictions, and changes in how people are behaving.
I do not think the effects have been equal across sectors, at all.
What you are discussing in very accurate terms is the problem with trending over time, especially when you have a multivariate system with different variances among the variables.
That is partly what is wrong with the concentration on Global Average Temperature. Combining temperatures populations with different variances by averaging only increases the total variance which is never discussed. Trying to trend these again simply adds to the problem.
Then you have models trying to predict values of GAT that has no meaning. Is it any wonder projections are all over the place and that none of them have ever been correct? If CO2 is not saturated, then a reduction in its concentration should result in an immediate increase in OLR and in a reduction of temperature. Otherwise the only logical conclusion is that CO2 has minimal effect on temperature.
John Endicott November 17, 2020 at 4:23 am
True … and despite that, my method got the right answer. I estimated 5%. The Nature magazine study says 7%.
So I’d have to say that it is a difference that doesn’t make much difference … I suspect that this is because of the inter-relatedness of our modern world. These days you generally don’t see just one sector dropping.
For example, some car manufacturing plants shut down during the pandemic. Of course, this affects the manufacturing sector.
However, the workers are no longer going to work, so it also affects the transportation sector. The workers have less money to spend, so consumer spending is affected. The auto plant no longer needs raw materials, so the mining sector is involved. And of course, the plant is no longer using huge amounts of electricity, so the electric sector is depressed as well.
So, despite your claim being true … I still got the right answer.
Regards,
w.
Only if you assume Nature Magazine’s answer is right.
This is why the slope isn’t 1.0.
Charles think iron and steel and and cement and transport and farming… yeah, GDP is well measured by it.
This is an endless disagreement. Us = 4 units. Nature emits = 96 units. Nature absorbs = 96 units.
At the three up: 4 units. I wish people would stop making this argument. Way back in about 7th grade we learned of the concept of cancelling in math. I think the mods should delete these types of comments for banality. Do you really think the scientists are promoting such a large deception? Do you?
Apparently, nature absorbs more than 96 units because the average increase is less than 4 units.
Who says nature can only absorb 96? For example look at the vapour pressure above a glass of water. There will be a region above the water that that has vapour coming and going into the glass and air. It’s a balance between all the ambient conditions and even though the glass is just at room temp, say, no where near boiling, the water in the glass can totally be absorbed by the air after a time.
“Do you really think the scientists are promoting such a large deception?”
Yes. It is, after all, very profitable for them. Lots and lots of grant money that only goes to those that push the deception.
Numbers about how much “nature” emits, or absorbs, are estimates pulled from theories and models. Some estimates may be based on measurements of specific, locally limited events but their extension to a world wide amount is a multiplication of the measured numbers by theoretical considerations. From the couple of times I’ve seen anything that actually considered the issue, the emission and/or absorption estimates of several non-human sources each have an uncertainty range that is much larger that the estimated total of all human sources.
AndyHce,
The exact figures for natural emissions and sinks are not important at all for the carbon budget. They are only interesting for possible (future) problems in sink capacity in the oceans and vegetation.
Wat is needed for the carbon/CO2 budget is the difference between natural sinks and natural sources and that difference is known with reasonable accuracy from the increase in the atmosphere and the inventory of human releases.
That budget was always negative over the past 60 years of accurate measurements.
Thus nature in the last 60 years was always more sink than source and almost (*) all of the increase was from human emissions…
(*) There is a small increase by the increase in temperature of the ocean surface of about 10 ppmv (16 ppmv/K) in the overall 115 ppmv increase since about 1850
You insist on unifying the biosphere and separating human emission, yet the biosphere is both a source and a sink, and the sources and sinks respond differently to increase in temperature. Better I think to treat the biospheric sources and sinks separately, just as you separate human CO2.
Gordon Lehman,
It is near impossible to separate the biosphere in emissions and sinks, as the same plant is a huge sink in sunlight and a source during the night. Estimates for all land plants are around 120 GtC uptake during the day and 60 GtC release during the night, which are the largest CO2 fluxes on earth…
But in fact no problem, as most of the diurnal changes don’t even reach the bulk of the atmosphere or are mixed out when reaching the measurement stations.
What is possible is to separate the total biosphere from ocean emissions/sinks, due to the oxygen balance. The change in solubility of O2 in seawater with temperature is known, the oxygen use of burning different fossil fuels is known and the oxygen change over time can be measured, but is quite challenging as one need a better accuracy than 1:1 million. Here the results:
http://www.bowdoin.edu/~mbattle/papers_posters_and_talks/BenderGBC2005.pdf
Fig. 7 on the last page shows the sink/source results of the biosphere as a whole and what the oceans did (near always a sink).
Sometimes (especially during an El Niño), the whole biosphere is a net source of CO2, in other periods a net sink. The oceans are mostly a net sink and both together are near always a net sink, except for a few months during the 1998 El Niño.
Come on boys,
Why is it so difficult for smart fellows to understand something that every housewife with a small budget knows? If you spend more money than your income, then you get into trouble…
If you add $50 each morning to your wallet and you end the day with $25 in your wallet, then you can be sure that you have spent $25 extra during the day, even if you have bought and selled hundreds of dollars of goods during the day. The net result is that all your transactions show a deficit of $25 dollar.
The same for the CO2 budget:
increase in the atmosphere = human emissions + natural emissions – natural sinks.
increase = human emissions + X – Y
The increase is measured, human emissions are known from inventories both quite accurate (or even underestimated for human emissions…)
For 2019 that gives:
2.5 ppmv = 5 ppmv + X – Y
or Y = X + 2.5
No matter the exact figures for X and Y, the natural sinks were 2.5 ppmv larger than the natural sources.
If
X = 10 ppmv, Y = 12.5 ppmv
X = 100 ppmv, Y = 102.5 ppmv
X = 1000 ppmv, Y = 1002.5 ppmv
The exact height of X or Y is completely unimportant, only the difference between X and Y is important and that is simply the difference between measured increase in the atmosphere and human emissions…
Actual science is a measurement game with error limits.
Trying to measure and be certain of a 20% change in your independent variable versus a 0.2% change in that variable is a world of difference.
You should know that Ferdinand.
Joel O’Brian,
The error margin of CO2 measurements at Mauna Loa or any other station (or the “global average”) is not more than 0.2 ppmv on a level of 415 ppmv. Quite accurate.
The error margin op CO2 emissions from fossile fuel emissions may be between -0% and +20%, as that is based on national inventories of fuel sales (never overestimated, may be underestimated due to under the counter sales). Thus more a minimum than exact. Add to that the extra CO2 due to land use changes. Even without the latter, CO2 emissions in the past 60 years were always larger (including the margin of error) than the increase in the atmosphere, in average about twice as large.
The margins of error in the estimates of the individual natural CO2 fluxes play no role at all. Even if some flux doubled or halved in a certain year or even changed in direction, even when in an El Niño year vegetation is a net source and in other years a net sink, that doesn’t matter at all. All what matters is the difference between human emissions and the increase in the atmosphere, which both are quite accurate, more than enough to show that nature was a net sink of CO2 over the past 60 years…
You have a point Joel, but one important fact make this less relavant.
Plants are both the largest natural natural source and sink of CO2 for the athmosphere, but blants are not a very huge reservoir. Actually more Carbon is in the athmosphere than in all the worlds plants (610 GtC vs 750 GtC).
That means that we cannot expect that plants will take up large amounts of carbon and keep it indefinitely. Most carbon captured by plants are released when the plants die and rot.
Therefore most of the carbon flux between plants and atmosphere i# irrelevant to the carbon buildup in the atmosphere.
“That means that we cannot expect that plants will take up large amounts of carbon and keep it indefinitely. Most carbon captured by plants are released when the plants die and rot.”
And when were the times that all the plants died and rotted?
If the biosphere expands, tree lines advance, arid area green up, new soils and litter form in arid regions and other areas that are newly foliated, much of it will have some amount of permanence.
If the air and the plants are roughly similar amounts, but the amount in air only varies a few PPM due to seasonal fluctuations, the rest has permanence, no?
Also, if 750 is the amount of it in the air right now, then logically in the recent past, the situation was the opposite, with plants having the greater mas by a large margin, unless you think the biosphere has grown suddenly more massive?
Because CO2 has risen very substantially in a few decades.
So how long has the mass of the plants (does this include phytoplankton? Because they die and sink to the depths, so…) been 610 GtC? Did it used to be much higher?
Have we not removed forests? We have had to endure years of whining over the loss of habitat and trees, so it must be shrinking, the mass of all plants on Earth, or is that just bellyaching?
As well, if the Earth had a far larger mass of plants in the recent past, and a far lower mass of atmospheric carbon in the recent past, then a much lower level of carbon must be able to support a far higher mass of plant life, no?
So a new and higher level of CO2 could presumably support a far more massive biosphere of plant life. No?
And we know satellites can see that the Earth is greening substantially and rapidly, right?
Trees and plants in general are growing far faster than even a few decades ago.
And plants can now thrive in zones that were too arid at lower levels of CO2.
And if the Earth is warming, we should expect tree lines to advance poleward and up to higher altitudes, again increasing the size of the mass of the plants on the Earth.
Likely plants and trees are now at a far lower level than the amount of CO2 in the air can support, and so a new equilibrium will try to establish itself, one with a far higher amount of plant life, since some amount of CO2 starvation has been alleviated for a time.
I am wondering about the precision of a number like 610 GtC for the mass of all the plants. I doubt anyone has any way to even guess that the number is not 620, or 650, or 700, or 550, GtC for plants. This would have to include a lot more than just the wood in trees. Leaf litter, root mass, soil carbon compounds…
I can easily believe this number might be off by a factor of two or more in either direction.
But whatever it is, logically it can be much higher.
Because it has been much higher.
How long after the Pleistocene glaciers melted away did it take for the Taiga to establish?
Soil is thin up there, and I bet it is getting thicker over time. There was nothing but bare rock there 12,000 years ago or less.
And the Sahara was a verdant savannah with scattered woodlands up until 8000 years ago.
And what about all that peat in various places? Methane in the soil?
It all came from somewhere, every atom of it.
And we know where.
Atmospheric CO2.
Maybe ocean CO2 for at least some of the methane clathrates, and for the corals. Corals are growing upwards as least as fast as the seamounts they rest atop are subsiding into the crust of the sea floor.
The earth is a big place with a lot happening, all the time.
Same as it ever was.
Excellent explanation Ferdinand.
Keep up the good work
/Jan
“Ferdinand Engelbeen November 17, 2020 at 2:50 am
If you spend more money than your income, then you get into trouble…”
My first wife seemed incapable of understanding this concept and accused me of “economic abuse” (A form of domestic abuse here in Australia).
What if we changed your approach and argued that human emissions are entirely natural and a part of the biosphere and separated out soils from the rest of the biosphere and looked at their contribution to atmospheric CO2 alone? Soils have ~3x the Carbon mass of the atmosphere or vegetation and produce about 6x the CO2 humans do. Like human contribution, soils are essentially a one-way input to the atmosphere with a nearly identical isotopic signature.
Soil CO2 production is strongly dependent on temperature, and we all know the surface atmospheric temperature has been rising. A 1/6 increase in soil CO2 production would equal the human contribution.
Look, everyone knows human CO2 is increasing atmospheric CO2, the question is how much? At the current state of knowledge, it seems unreasonable to argue the human contribution is much more than half.
Gordon Lehman,
I do bring $100 per month to a local bank, adding up my personal account with $1200 every year over the past 60 years.
At the beginning of a new fiscal year, the bank publishes its result and shows that their yearly gain in capital is $600 every year of the past 60 years.
In your reasoning, it “may” be that other investors have put much more money into the bank, dwarfing my small account, which is the cause of most of the gain of the bank.
In my reasoning, I will as fast as possible take all my money away from that bank as they simply have a loss without my money…
The point is that the separation is between human and natural, as human emissions are one-way (there are hardly any human sinks), while natural CO2 fluxes are bidirectional with in the past 60 years always more sink than source.
Ragnaar,
You should check out the IPCC carbon cycle sources+sinks+uncertainty. There is so much uncertainty that it cannot be demonstrated there is the naive balance you claim. Some of the numbers are simply derived by difference ie assuming balance, which makes nonsense of that argument.
I believe Chaamjamal who posts here frequently performed a statistical analysis on this which demonstrates quite clearly that the idea of balance is an artefact of choosing the mean flows, once the uncertainties are factored its nonsense and not supported by actual data. Balance in the natural carbon cycle is an assumption, not a fact. Over geological timescales its patently not true, over shorter timescales – unproven
ThinkingScientist,
As said above, there is no need for any knowledge of any natural CO2 in or out flux, all you need is the difference between all natural inputs together and all all natural outputs together. And that is exactly known: that is the difference between the increase in the atmosphere and human emissions. Which is negative over all past 60 years.
Whatever the individual fluxes did, nature was a net sink over the past 60 years, not a source.
ChaamJamal did compare the detrended variability of the increase with the variability of the emissions and concluded that there is no correlation (which is true: the correlation of the variability is with temperature).
The problem is that you can’t conclude anything about the cause of the trends by looking at only the noise around the trends…
I think you are referring to something different. The argument derives form the assumed IPCC fluxes + uncertainties via Monte Carlo. You are ignoring the order of magnitude differences between human and natural fluxes and the enormous uncertainties attached.
Regarding Chaamjamal’s work, I was referring to this one:
https://tambonthongchai.com/2018/05/31/the-carbon-cycle-measurement-problem/
It makes this relevant point:
“When uncertainties are not considered, the flow accounting appears to show an exact match of the predicted and computed carbon balance. It is noted, however, that this exact accounting balance is achieved, not with flow measurements, but with estimates of unmeasurable flows constrained by the circular reasoning that assigns flows according to an assumed flow balance.”
There is also a further post I have not read yet:
https://tambonthongchai.com/2020/06/10/a-monte-carlo-simulation-of-the-carbon-cycle/
ThinkingScientist,
The essence is that several sceptics use the 4% human / 96% natural ratio as an argument that the 4% can’t be the cause of the CO2 increase in the atmosphere.
What Ragnaar says is that one needs to subtract the sink side of the equation too, which makes that only that 4% is responsible for the increase in the atmosphere, not the 96%…
Therefore it doesn’t matter at all what the exact level of the natural CO2 fluxes are, how they changed over time, their error margins and even not their direction. All what matters is the sum of all these natural fluxes at the end of a full year. Over the past 60 years, that was (near) always more sink than source…
ChaamJamal seems to assume that the IPCC calculates the mass balance from the individual CO2 fluxes. As far as I know, they never did that or even assumed that.
In fact it is reverse: they simply use the CO2 increase in the atmosphere and subtract the CO2 emissions. That gives a negative mass balance for all natural CO2 fluxes together. That is all. The nice graphs which show the natural fluxes are partly based on measurements (13C/12C changes, O2 changes over the seasons, solubility parameters,..) mostly based on “best guesses”, but not important at all for the mass balance…
Therefore it goes wrong in point 17 of ChaamJamal’s work:
The mass balance shows that the sum of all natural fluxes must be negative, as the increase in the atmosphere was always smaller than human emissions (after 1960). Thus whatever the height of the natural fluxes and their margin, the sum must be negative and the Monte Carlo process doesn’t conclude anything about the role of human emissions, which were always contributing to the increase.
BTW, the 50% “airborne fraction” is just coincidence and caused by the very regular linear increase of human emissions over time. If for any reason emissions would stop, the sink rate would remain the same the first year and gradually (linearly) drop to zero when the atmosphere is back to equilibrium with the ocean surface.
The net sink rate is a function of the CO2 pressure difference between atmosphere and ocean surface (and vegetation liquids), not a function of the emissions…
So the question boils down to our ability to understand and know what the levels of atmospheric CO2 have been in the past.
Certainly we have many ways of trying to get at this question, and many accept the ice core data as being more or less definitive, at least in a relative way, as to the past levels and variations thereof.
I for one would not tend to doubt that burning fossil fuels is the main cause of recent increases.
But I would also not ignore any questions pertaining to this or any other premise of a sweeping and pertinent nature, in any area of science or the environment.
And there are some nagging disputes and questions about exactly how well we know what past CO2 levels have been, although I cannot say how credible or well evidenced any of them may be.
For example, levels of CO2 in samples of air which have been inside of sealed containers from past centuries, have, according to some, shown levels that are way above the accepted values.
I for one take it to be true that the Earth has had cycles of warming and cooling since the Holocene Climate Optimum, and that the most recent cold period was very cold for a period of a number of centuries, and since that cold period, known at the Little Ice Age, ended, the ocean has likely been warming up, glaciers have been shrinking and receding, and at least perhaps, has CO2 been increasing.
All of which are very certainly good things. The entire world is becoming better fed and more prosperous as a consequence of these changes from colder to warmer.
No surprise there.
Historians have known for a very long time that cold periods are better for human endeavors and general prosperity.
Recent evidence bears that out.
We may indeed have more CO2 in the air than at any time in millions of years.
It is not unusually warm by historical standards. In fact it is on the warm side of unusually cold compared to the average Holocene temperature.
But on the scale of Earth History, it is very unusually cold, and cold is not good.
Cold equals death for life.
And CO2 may be high (may be) vs the average levels found over the whole of the Holocene, but looking at Earth History, it is again very apparent that CO2 levels are shockingly and scarily low, considering that CO2 is one of the essential raw ingredients for the entire biosphere, and the one which is in critically short supply.
Four one hundredths of one percent of the air, does not seem like a lot for something that every living thing on the Earth would quickly die without.
And when we consider that the interglacial epoch we currently enjoy residing in will very definitely end at some point in the near future, we might concern ourselves with the fact that the levels at the peak of the last glacial advance have been found to be very close to the minimum level for photosynthesis to be able to occur.
There is zero historical backing for the proposition at the heart of global warming alarmism, that an increase in GAST of 1.5 (Remember when it was 2.0°? Those were the good old days!) will cause something close to the end of the world.
In fact, all historical evidence is exactly contrary to this notion.
ALL of it!
Warmer is and has always been better.
A warmer world is a more mild and temperate and hospitable world.
A colder world is a stormier and more variable and a dryer world.
Ice is not habitat…it is wasteland.
However, there is good reason to suppose that if and when CO2 levels in the air dwindle below about 150 PPM, the biosphere itself will cease to be able to draw it’s sustaining energy from the Sun, at least the parts of the biosphere that most of us consider important. Like, you know, plants and animals.
So a sane person has got to wonder…what the Hell are these warmistas thinking?
They want less CO2, and a colder world?
The climate regimes of the Earth in the preindustrial period were not anything like optimal…it was dangerously and harmfully too cold.
It was dangerously and harmfully too stormy.
Crops often failed across entire regions, sometimes across many regions from something as unpreventable as a volcanic eruption.
Higher CO2 and higher temperature regimes are a buffer against bad times to come.
As such, it behooves us to understand as much as we can, to garner as much knowledge and we are able, about all of these parameters.
And it ill behooves us to make broadly and dangerously incorrect assumptions and conclusions about what is “good” and what is “bad”.
We can see that there are people on this Earth who would lock us in our homes and impoverish us all for no other purpose than their own political ambitions and power. Not to mention money.
Lots and lots of money.
There are people who think nothing of lying, cheating, stealing to get what they want, and to assert and maintain their power and control.
I am shocked that anyone who is of a scientific orientation would or could condone the wholesale mushrooming of humanity.
If not for the ability to know what the conditions on the Earth were in the past, and how they may change in the future, we have that much less ability to resist and oppose those who would lead us all astray.
Oops, meant to say the opposite of what I said in this sentence here:
“Historians have known for a very long time that cold periods are better for human endeavors and general prosperity.”
What I intended to say was this:
“Historians have known for a very long time that *warmer* periods are better for human endeavors and general prosperity.”
Willis may be on to something – showing that year-over year increases in CO2 appear to be sensitive to Nino/Nina conditions. When just a part of the ocean warms (significantly) faster than the whole ocean is warming (El Nino) that appears to significantly affect the growth rate in (Mauna Loa) atmospheric CO2. Conversely, when that ocean area cools the growth rate in CO2 declines. Scaling the area of the ocean affected by Nino/Nina to the area of the whole ocean along with the warming of the two respective areas could give a measure of how much of the CO2 increase is owing to ocean warming. Perhaps the effect is more pronounced at Mauna Loa as it’s near the part of the ocean affected by Nino/Nina.
Meab,
The effect of ENSO on the ocean’s CO2 emissions is rather limited, the effect on tropical vegetation is far more important: not only temperature, but especially rain patterns change a lot. That makes that e.g. the Amazon dries out with lots of (natural and human) forest fires. During the 1998 El Niño the whole biosphere even turned into a temporarely CO2 source, while in other years a net sink.
How do we know? By looking at the 13C/12C ratio: if CO2 increases from extra CO2 out of the oceans, the 13C/12C ratio also goes up as the ocean 13C/12C ratio is higher than in the atmosphere.
If CO2 goes up from vegetation, the 13C/12C ratio goes down as vegetation has a lower 13C/12C ratio than the atmosphere.
For the period 1990-2012 (including the 1998 huge El Niño):
http://www.ferdinand-engelbeen.be/klimaat/klim_img/temp_dco2_d13C_mlo.jpg
that shows that vegetation is the dominant response to short term temperature changes.
The plot needs some update for the years after 2012, which would be interesting to see the effect of the 2016 super El Niño…
Really excellent work Willis. I’m totally stealing this. Thanks for the CO2-GDP equation
Willis, I personally think your conclusions are right to the point. The CAGW Alarmists want to choke the economy worse than the Coronavirus lockdown/slowdown/ quarantine, and for what? Nothing! Never mind that China and India are going their merry way irrespective of presumed consequences. Take me back to the Cretaceous, plus 1,000 ppm CO2, warmer by 5 deg C or so, and everything is gigantic! Sort of a forward to the past deal.
True, but we can’t breathe that air 😉
IIRC, didn’t CO2 peak in the Jurassic?
???? Better tell that to all the greenhouse workers who AREN’T dropping dead from working in 1500ppm.
Nevermind submariners!
And on top of that the O2 fraction back then might have been something like 35%, considering the huge insects they had back then.
“True, but we can’t breathe that air”
Really ?? Now that is funny !!
Did you know that the air in an enclosed bedroom at night can easily reach 2000ppm
Are you still alive ?
What do you mean, we cannot breathe that air?
Are ya daft, man?
Maybe joking?
You must be joking.
Haha…good one!
The alarmist position makes little sense, if you consider their goal is to do anything about global temperatures. But, in reality, the underlying goal is and has always been power and control, the sort of Orwellian power for power’s sake type of power.
Currently, they are a bit distracted by trying to see if they can achieve the same (or greater) goals by using COVID panic and fear mongering. If that doesn’t work, they’ll be back to global warming with a vengeance though. You see it all over the place, “Build Back Better”, “new normal”, “Great Reset”, etc.
There are people who want to control the world, even if it means destroying it. They’d rather be King of the smoldering ruins of the world than content that people might act freely. I just want to be left alone to grow some veges and make toys for my son.
I imagine that the elites think that their money will protect them in the utopia they seek, but look at what is happening to billionaires in China. Money is not protective unless there is force behind it.
If you can get off planet and build a civilisation in the asteroid belt*, it would pay you to leave behind a ruin. Then you won’t get any competition as Ruler of the Universe for a thousand years.
JF
Insert tongue in cheek smiley here.
*Dicky Branson can make the tea.
If I was living on an asteroid in space…I think I would want a back up plan.
Like, maybe…hell I dunno…a PLANET to go back to in case of major problems!
Probably be nice to have a little vaycay every now and again as well.
Most of us can barely stand to get through a whole northern Winter without some fresh air, tropical sunshine, warm ocean to dip our tootsies in, stuff like that.
Their money will protect them for a time, but eventually, that which supplies them will fail, and then so will they.
Who were the wealthiest people and companies in Venezuela 30 years ago, and how has that worked out for them?
Cuba in the 1950s?
Russia in the 1910s?
Name one place where it has worked out well for anyone with vast resources prior to these countries becoming what they became?
To what part of my statement are you objecting?
“for a time” => “30 years ago”
I was not disagreeing with you.
I was amplifying.
What do the wealthy people supporting a socialist agenda have in mind?
It is beyond belief.
Apologies, then, I read it as disagreement.
I really don’t understand what they expect will happen. You’re right, it’s a repeated pattern, pretty solidly established. “It will be different this time” is magical thinking at best.
Mauna Loa is a volcano right? Albeit supposedly dormant. But doesn’t anyone consider the possibility that it still might be outgassing CO2?
D. Anderson November 16, 2020 at 2:27 pm
Indeed they do consider it. See my post Under The Volcano, Over The Volcano.
w.
Thank you all for your thoughtful and complete answers.
Mauna Loa is not dormant. Its last eruption was in April 1984.
It’s not dormant and outgases regularly in various places, which must be accounted for in the sampling protocols. I believe its last major eruption was in 1984. It’s a fantastic place to visit if you ever get the opportunity.
They sample when the wind is coming off the oceans.
They don’t sample when the wind is off the volcano.
Smart people have spent time figuring all of this out.
There was an empirical measurement experiment reported some time ago, perhaps 7 to 9 years(?), perhaps I read it on WUWT(?). The measurement part was atmospheric CO2 concentrations but there was also a model part about the prevailing winds across the US.
CO2 measurements were taken on the west coast where it was believed the air sampled had traveled a considerable distance over the Pacific Ocean, thus it should have been little tainted by any recent human events.
Other measurements were taken on, or a bit off, the eastern coast where air from heavily industrialized parts of the US should be exiting the continent. The goal was to get some measurements of how much CO2 was being added by the US, the world’s largest emitter at that time.
There were no differences measured between west and east coast, leading the researchers to suggest that perhaps the “nature” was absorbing more from the continental US than believed. Probably other hypothesis could be produced if anyone cared to try. What might be more interesting is more carefully planned and carried out measurements but interest (or grant money?) seems to have been lacking.
AndyHC,
At many places in the world there are “tall towers” measuring CO2 at different heights and up/down wind speed over large area’s to make inventories of CO2 releases and absobance over that area:
https://amt.copernicus.org/articles/7/647/2014/
Besides that, the OCO-2 satellite measures “column” CO2 continuously at the midday line all over the world, but I haven’t seen recent data and I have the impression that they have rather much problems in calibrating and/or interpretating the data…
Here is a place many such things can be looked at in any number of interesting and easy to view ways.
I do not know how accurate the values are, or indeed where and how the values are obtained.
But that can be checked for each parameter on the main webpage of the people who produce this great tool.
Anyway, here is a link to it, specifically a global orthographic view of Earth, toggled to “Now”, “Chem”, and “CO2sc”, which is the surface CO2 concentration.
You can change the date by clicking in the little calendar icon in the “Control” line of the menu.
And you can get a precise value for any exact location by just clicking on that spot, then looking at the top of the menu box.
All kinds of data on chemistry, particulates, and a whole slew of atmospheric/weather parameters are available for the whole planet.
Indeed, a quick check shows that if one clicks on a spot off the coast of British Columbia, for example, then follow the wind streamlines to where this airflow emerges off the East coast, in this case at the present time around the area south of Long Island New York, the values are roughly similar, about 423 PPM.
Looking at the color coding, I found a spot near Catalina Island that shows around 456 PPM, and a spot over the borders between Ecuador, Peru, and Columbia, where it says it is only about 404.
Anyway…here you go:
https://earth.nullschool.net/#2019/11/17/0730Z/chem/isobaric/70hPa/overlay=co2sc/orthographic=-82.66,19.68,556/loc=-74.772,-1.149
If one just does a quick images search for global satellite CO2, there are maps that show a wide variance in patterns.
One shows it highest over tropical rainforests in South America, and lower over the continental US, like this one:
http://www.euanmearns.com/wp-content/uploads/2015/10/year-v3-09-29-2014-09-28-2015-warn-15.png
While others show a very different pattern, like this one here:
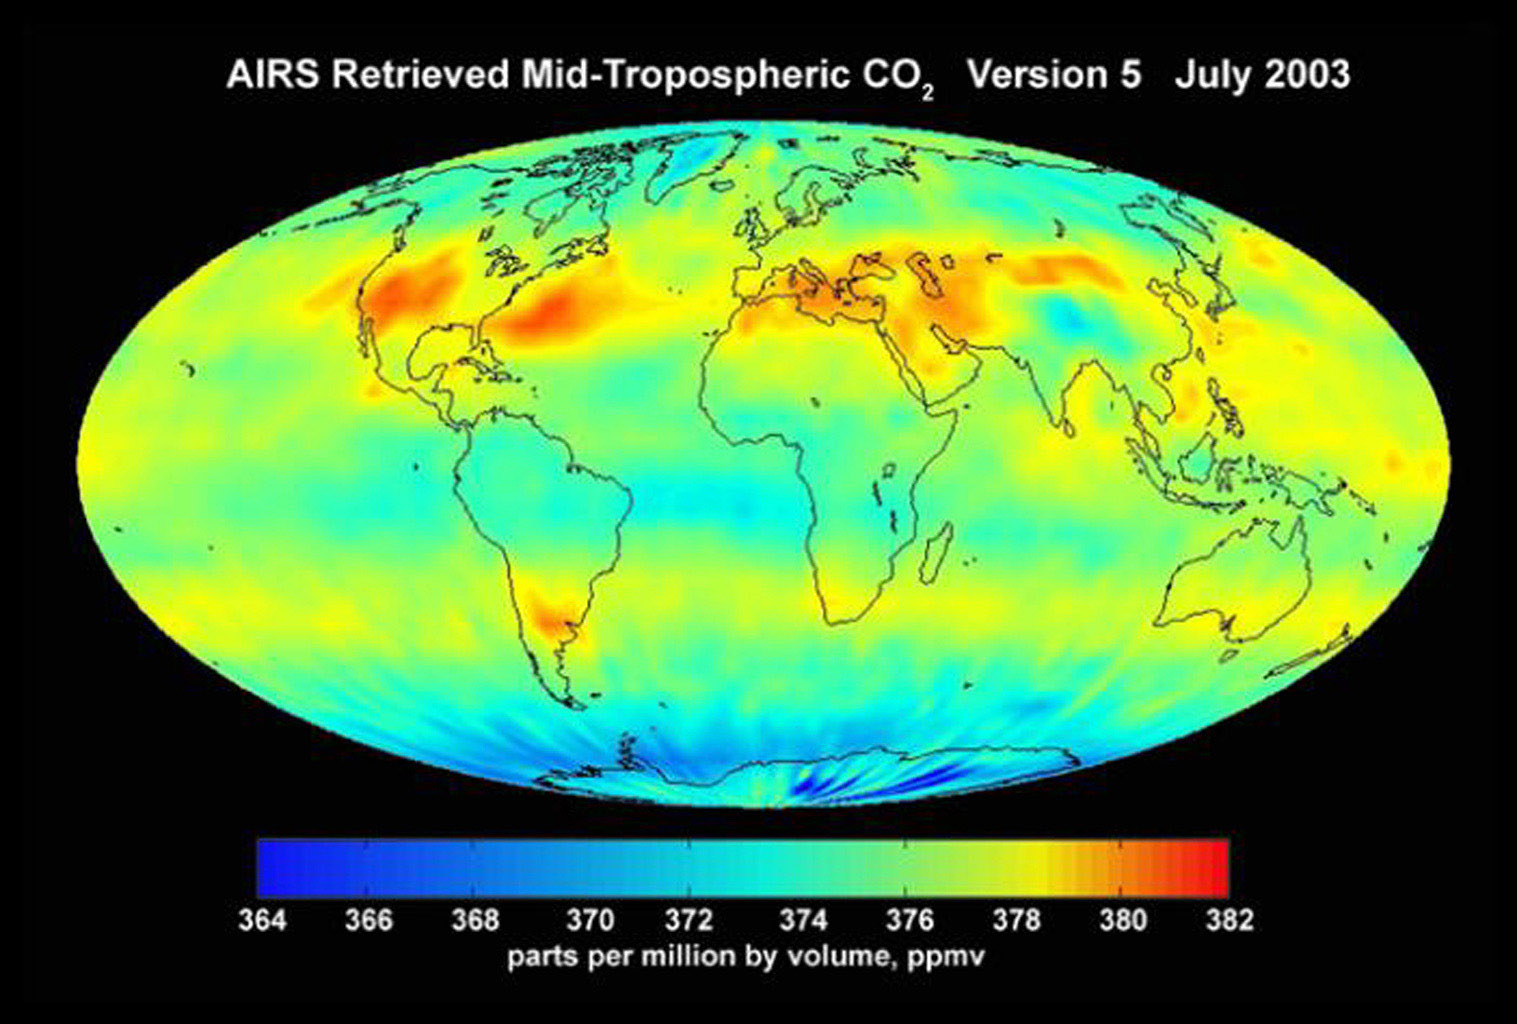
It might be interesting to toggle the nullschool map to each of the dates of the satellite views and see how they match.
D. Anderson:
…Mauna Loa is a volcano right? Albeit supposedly dormant. But doesn’t anyone consider the possibility that it still might be outgassing ..
and isn’t there a new Hawaian Island in gestation ( still a submarine volcano) outgassing and warming the deep rich in CO2 cold high pressure water?
and while we’re at it, fossil fuel derived CO2 is old therefore all C12, C14 is generated in the upper atmosphere by cosmic radiation, so the increase in CO2 from fossil fuel combustion should be shifting the ratio C12:C14 and measurable. What am I missing?
Cheers
Mike
What does the other side have to say? Crickets of course. CO2 went up from about 1940 to 1980 while average temp slightly decreased so CO2 does not correlate very well with temp or man’s activities.
And the average (global) temperature increased rather much from 1900 to 1930, while there were fewer cars and much fewer airplanes than today.
The company I’m employed by has shifted largely to telecommuting with negligible loss of productivity—something they would not have done under normal circumstances. That gives me pause when considering this GDP-based CO2 assumption. We have basically taken our cars off the road, and a drive into NYC is a breeze. I would like to see an analysis of CO2 emissions reduction vs temperature as regards this pandemic.
The variability of temperature from year to year is often greater than 100 years of warming. It’s difficult to see any signal in that kind of noise at least over the short term.
Correct. Cannot be measured, so the governments have ignored Step One (measurements) and gone to Step Two – emissions and use this to “measure” “climate change”.
Then NASA/NOAA bump up the temperatures in DIRECT relation to the change in CO2 (see Heller)
Willis,
Unfortunately people are going to drag 2020 on into 2021 if they can possibly do so. Fauci would like to keep 2020 until 2022.
Regards,
Have you gone to Ethical Skeptics web site / he has some interesting observations to make on Co2 and heat in the oceans
Lockdown until morale, or whatever improves.
Lockdowns are terrible for morale. Lots of people depressed. Suicides and divorces going up. Economic ruin for many people. They are the last resort of the incompetent. The Asians have showed us they are a lot more competent than us in handling the first global non-economic crisis in decades. Their leaders know what to do and their societies know how to comply. The case of Vietnam puts to shame the entire Western World.
this ole hillbilly explained long ago using the soda analogy, i noticed long ago that after opening a soda it went flat(lost it co2 as it warmed) pretty fast……the earth is covered by oceans around 75% and they either hold or release co2 based on their temperature……warmer oceans release more co2 , so as the entire record shows first it warms and then the co2 in the air goes UP…….of course it is too easy to just accept that humans do NOT control the weather and to control the climate REQUIRES total control over the weather.
Usually, but not this time Bill. Although the ocean has warmed, dissolved CO2 is increasing, not decreasing. Higher atmospheric concentration is forcing the ocean to absorb CO2.
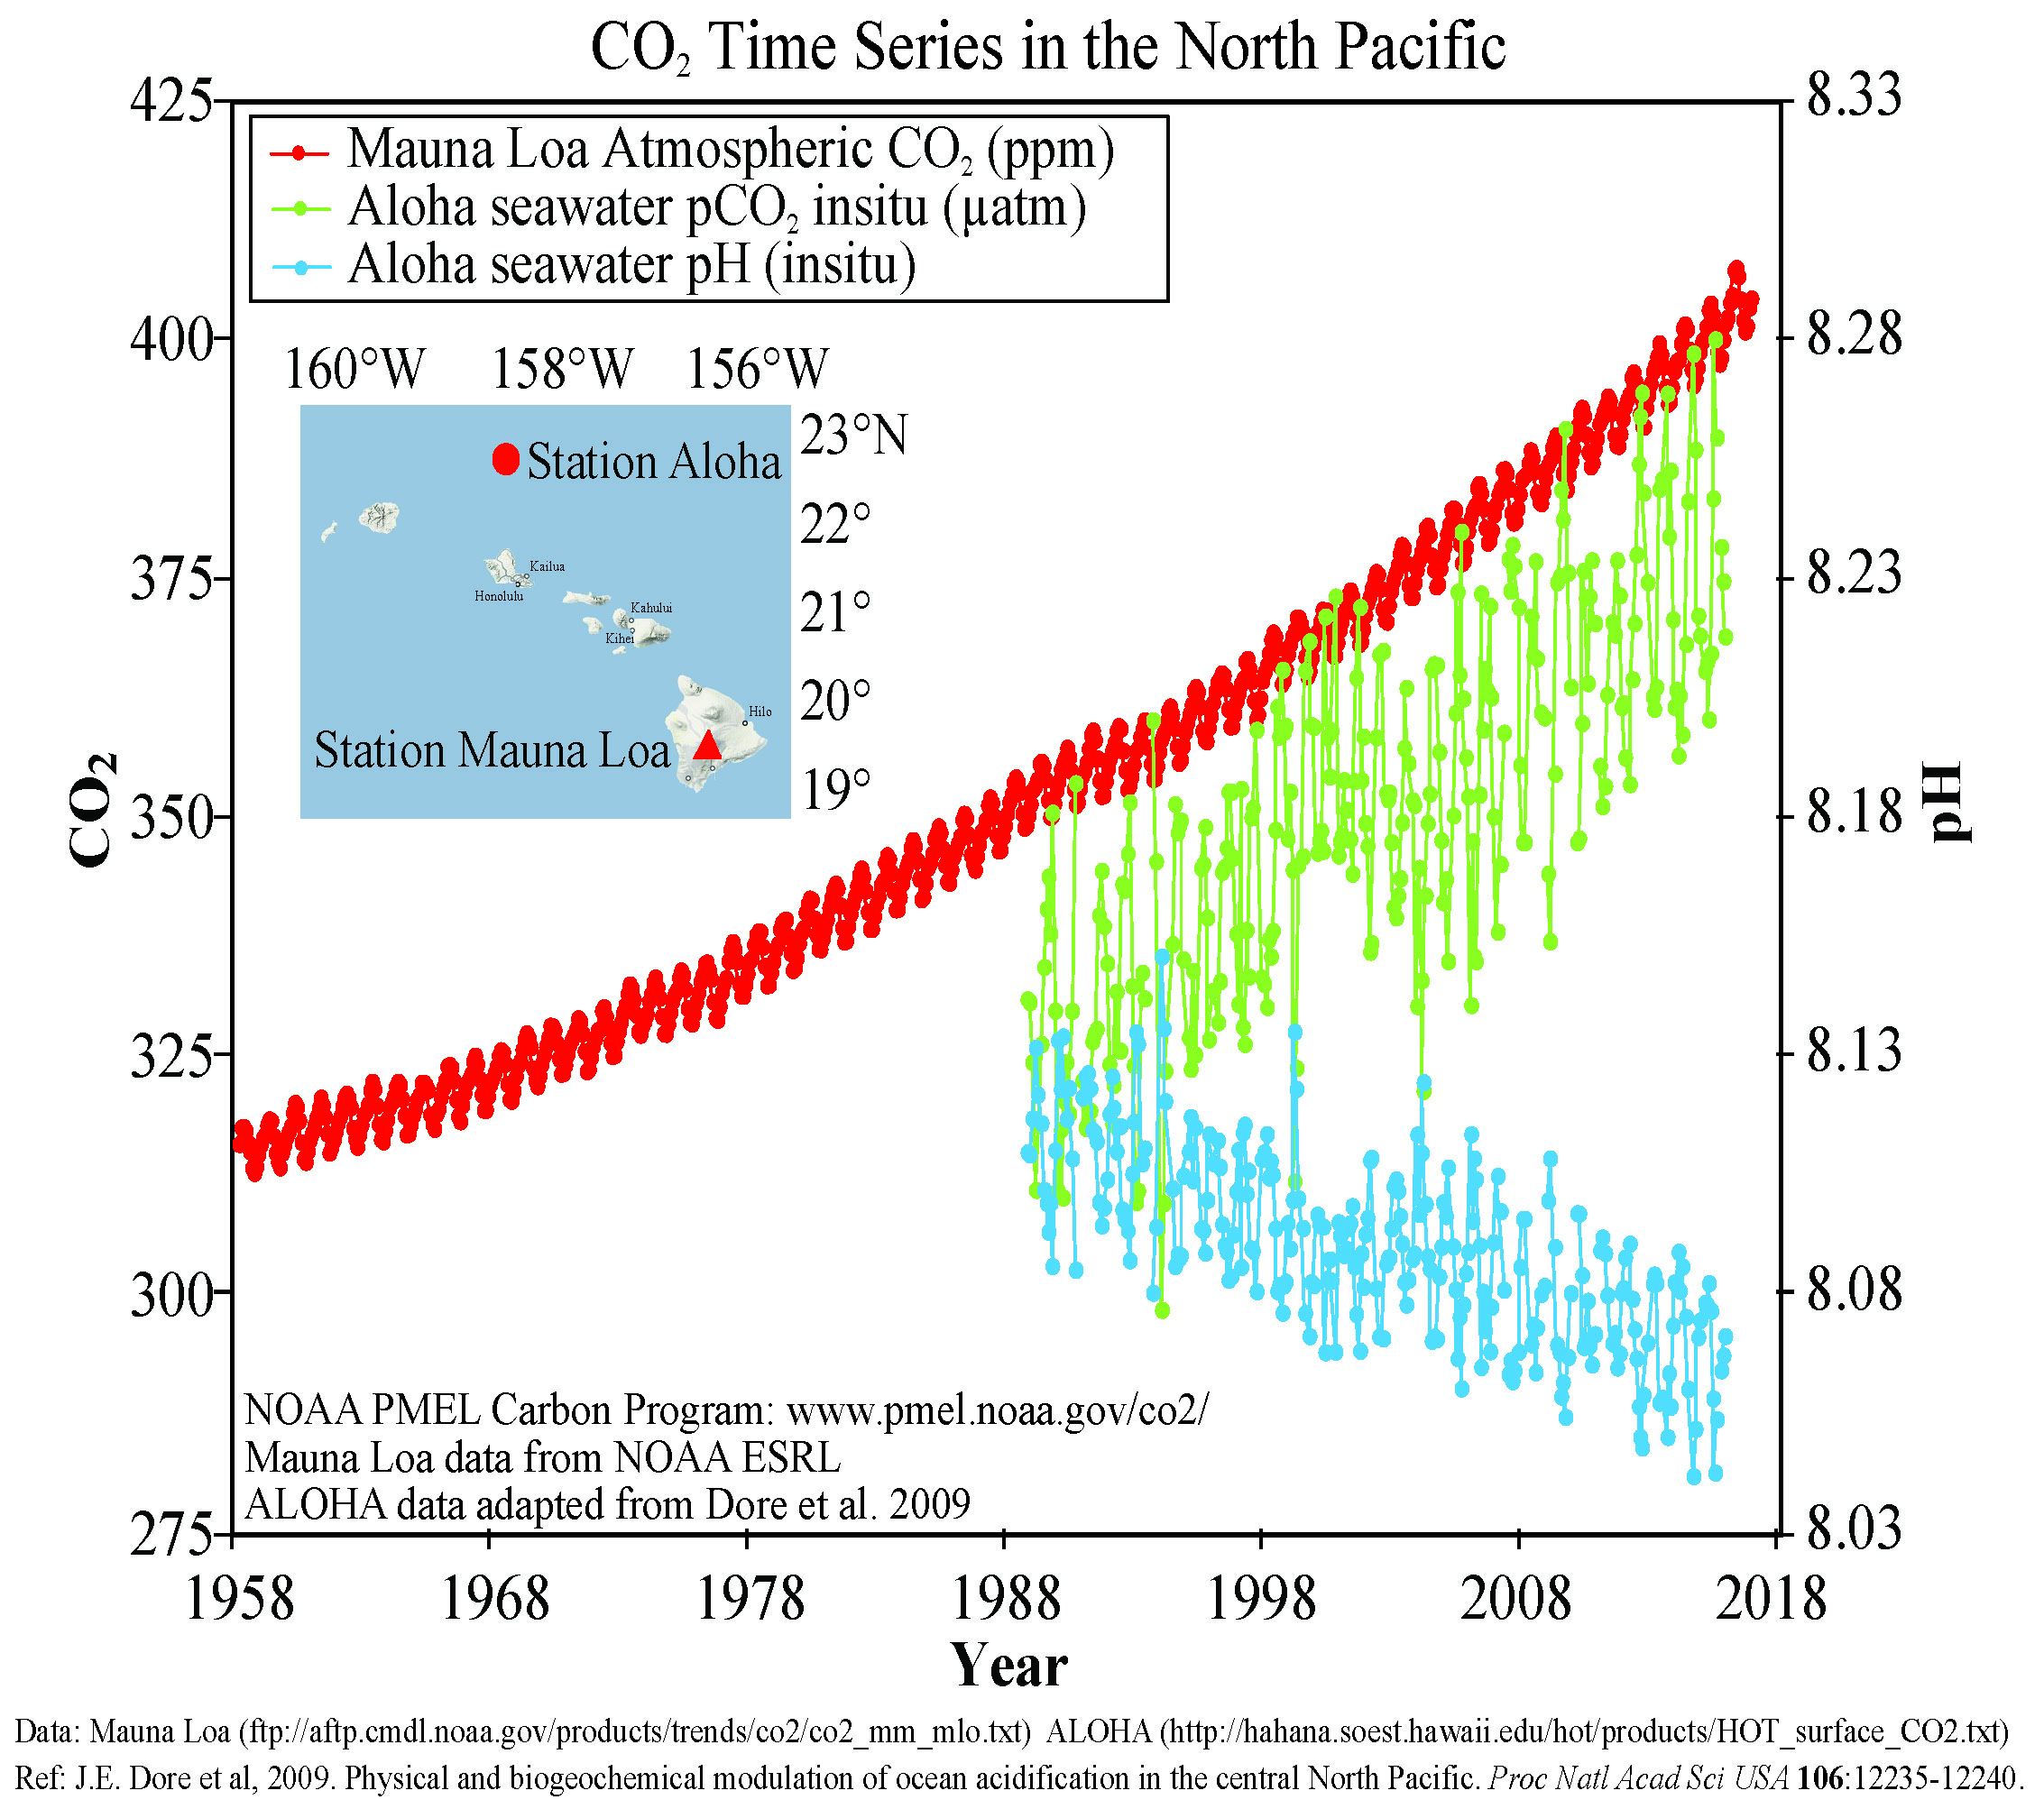
No, not much change if you take an average of the entire 2000m, the bulk of which is below the thermocline. Unsurprisingly, its a different story in the mixed surface layers – where it matters…
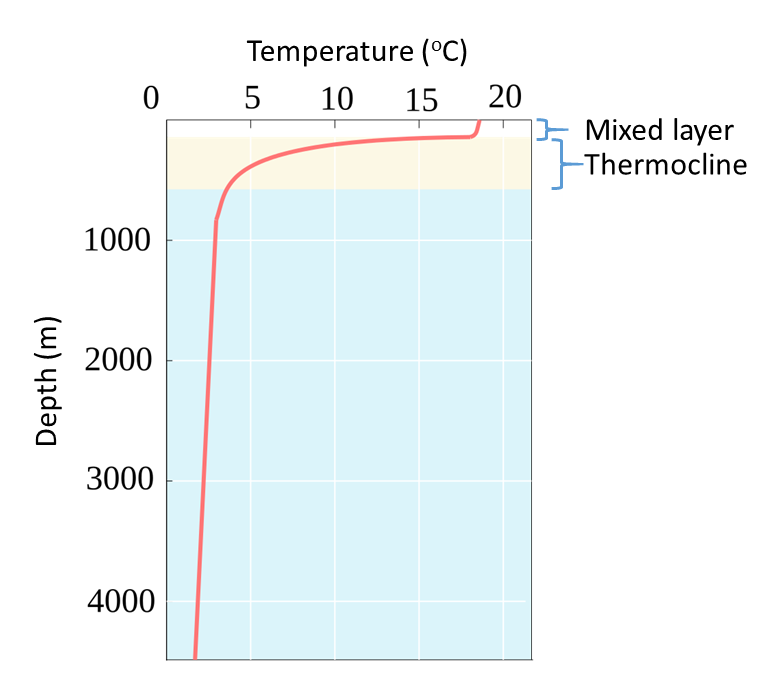

where it looks to be rising at about 0.1C/decade.
Yep, no pH change at all..
ocean PLANT life is loving that extra CO2 though. 🙂
Goo reasons for that ocean warming too, reduced tropical cloud cover and a series of strong solar cycles. Released in surges at El Nino events.
Absolutely NOTHING to do with atmospheric CO2 though.
And your graph shows that the oceans control the very slight global atmospheric warming..
so you have just destroyed the whole CO2 is bad mantra.
Well done 🙂
Just how much outgassing does an impossible to measure 0.03C create?
Do you know the ridiculous increase of temperature of the oceans over the past century? They put it in atomic bombs (or heat content) to hide the reality that the warming of the ocean in °C is so small that it hasn’t moved the average temperature of the ocean that is ~ 3.5 °C. From 1960 to 2015 the 0-2000 m ocean temperature anomaly has increased by a tiny 0.1 °C. Loydo is right that the CO2 partial pressure of the atmosphere is now higher than the PpCO2 of the ocean so CO2 goes from the atmosphere into the ocean, but even if that wasn’t the case, the tiny warming of the ocean would not produce the humongous increase in CO2 we have observed since 1960.
Do you see the contradiction that to play the card of the CO2 being released by the ocean you need to concede the triumph of the great warming of the ocean to the alarmists?
Bill Taylor,
The solubility of CO2 in the seawater surface gets an equilibrium with the atmosphere which for the current average ocean surface temperature is around 290 ppmv. That changes with about 16 ppmv/K temperature change, based on millions of seawater samples over the past centuries.
That means that there is some 10 ppmv increase from a warmer ocean surface since 1850, the rest of the 125 ppmv increase is from human emissions…
If the only sources were Oceans and man, then your last sentence would be correct. But since those aren’t the only sources then you last sentence, even assuming all your numbers are correct, would be more correctly states as “the rest of the 125 ppmv increase is from sources other than the ocean, including but not limited to human emissions.”
John Endicott,
Indeed, a little too fast…
Point is that there are only two huge and fast natural sources and sinks for CO2: the ocean surface and the biosphere. All other sources and sinks are either too small or too slow.
The solubility of CO2, O2,… in the ocean surface, including the chemical reactions and the influence of temperature is quite well known from several million seawater samples over the past centuries. That is the about 16 ppmv/K for an average temperature of around 15 C for the seawater surface.
As more O2 is formed than used by the total biosphere (based on the oxygen balance of fossil fuel use), the whole biosphere is a net sink for CO2, not a source.
Then we have small sources like volcanoes (about 1% of human input) and the very slow dissolving of carbonates by weathering, etc, all around or less than 1% of the human input…
Photo is NOT Mauna Loa…
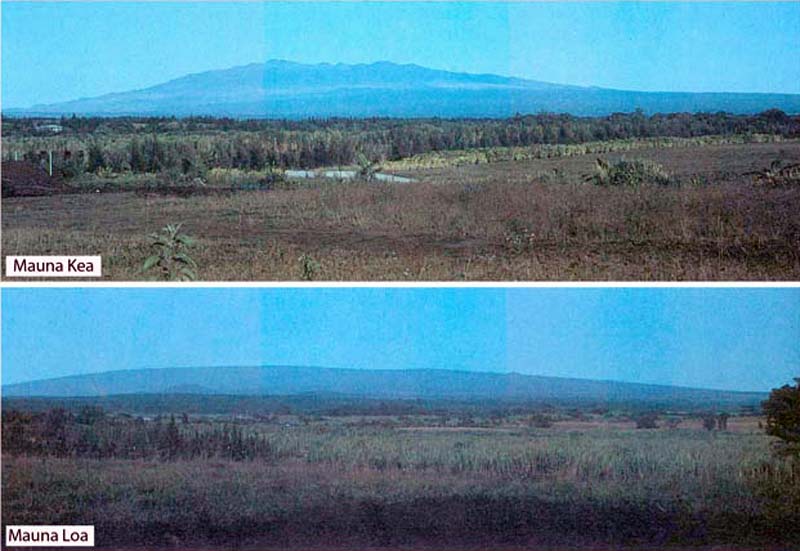
Figure 5.Two profile photos of Mauna Kea (top) and Mauna Loa (bottom). Mauna Kea (top) displays an irregular profile due to the abundance of steep-sided cinder cones formed by hawaiite, a less fluid and more explosive lava composition compared with the tholeiitic basalt that characterizes shield-stage volcanism. Mauna Loa (bottom) exhibits the classic, shield-stage morphology that results due to numerous tholeiitic basalt eruptions (and known to be particularly voluminous). This morphology is relatively smooth and shallow compared with Mauna Kea. USGS photos taken by Taeko Jane Takahashi in 1991 with caption details from Wright and others (1992b).
https://volcano.si.edu/volcano.cfm?vn=332030
Thanks, amigo. Fixed.
w.
W., Kea & Loa are Shield Volcano types – relult of low viscosity lava which spreads out.
Your graph background is a stratovolcano with much steeper sides from higher viscosity lava accumulation.
I believe your photo to be Ol Doinyo Lengai in Tanzania.
I live 30 miles from this beautiful stratovolcano:
As has been noted, the flat top and the distinctively shaped acacia trees in the foreground give it away that this is Mount Kilimanjaro.
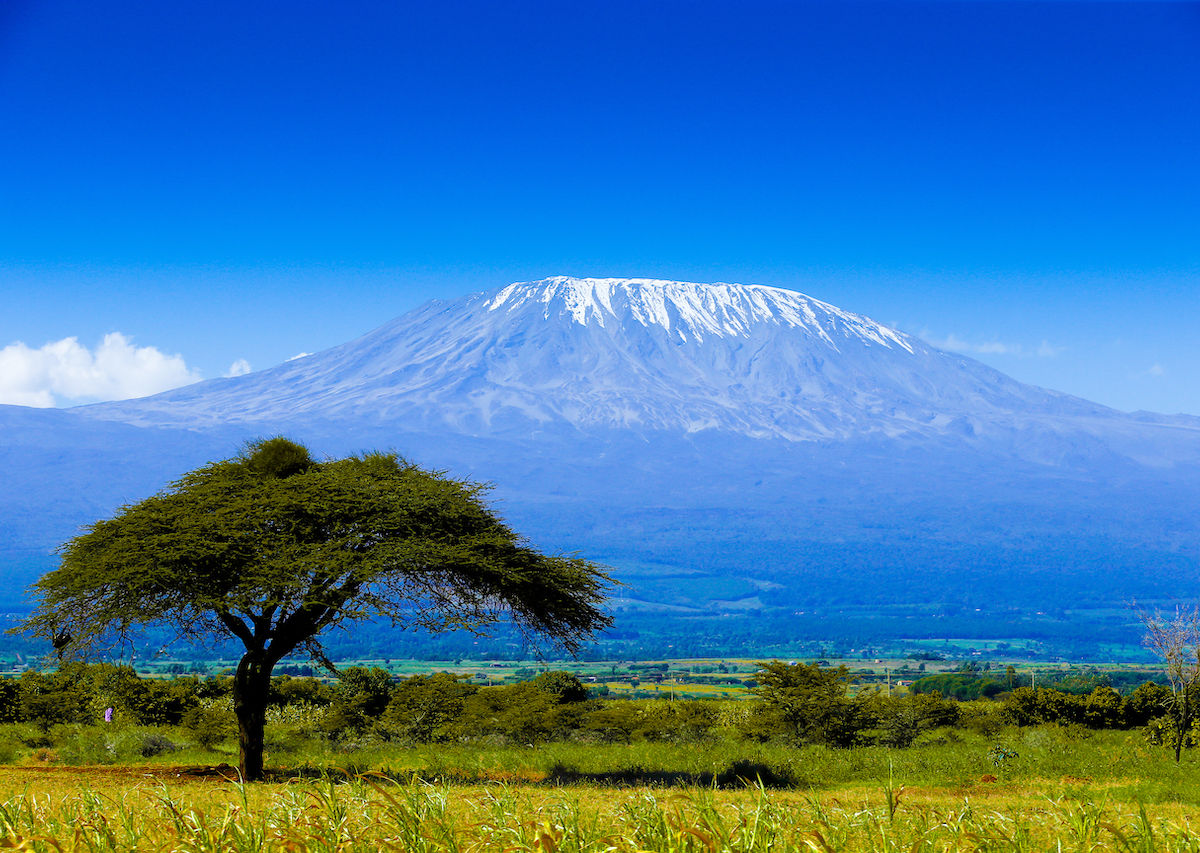
Then again, maybe not!
I still can’t for the LIFE of me.. and every other creature on the planet…
…. see why any sane person would ever want to decrease the amount of CO2 in the atmosphere.
CO2 is one of the three main ingredients needed for ALL LIFE ON EARTH. ! !!
…. and in the grand scheme of things is still in somewhat short supply !
If you look at the CO2 emissions record over the last 30 years you will see that they tripled after 2002 and fell as much during 2009, due to the GFC, yet neither of these much larger fluctuations is recognisable in either the global CO2 record or average global temperatures. A proof positive that human CO2 emissions do not make much difference?
Cumulative emissions perfectly track atmospheric increase.
http://www.ferdinand-engelbeen.be/klimaat/klim_img/temp_emiss_increase.jpg
For over 10 years every commenter and author that has a good knowledge of this issue has been saying the same over and over here at WUWT: “The atmospheric increase in CO2 is due to our emissions,” to no avail. It seems it is impossible to educate the skeptic community about something simple with plenty of evidence if they don’t want to be educated.
Some years ago I had a close look at F E’s argument. IIRC he makes a logical error in where he draws the boundaries between CO2 sources. By changing the assumptions one can justify blaming various sources.
You’d have to search for the conversation, it’s years ago and finding his error made my brain hurt– it even involved writing simple equations which is definitely beyond the call of duty.
JF
Ferdinand is correct. It’s a simple mass balance function.
We can’t know exactly how much of the cumulative rise is anthropogenic, because we don’t have a precise quantification of the natural sources and sinks of the fast carbon cycle. But we due have solid estimates of how much carbon we have moved from the slow carbon cycle (geological sequestration) into the fast carbon cycle.
There are lot more elements to the Carbon cycle than geological and human. The very fast part of the cycle includes human emissions, but this is small relative to plants, algae, microbial, slightly slower parts include soils, then fast geological processes like erosion, sedimentation etc etc. The fluxes and the uncertainties are very, very large. Some of them are unknown. All components likely have a temperature dependence somewhere and many of them have a temperature dependence in the causal direction of Temp -> CO2, particularly in the living world.
Our annual contribution is small. There are a lot of uncertainties.
But the mass balance equation is trivial, even if most of the variables are guesses.
Willis, This may be a dumb question (they are my speciality!) but:
a) isn’t Mauna Loa a volcano?
b) didn’t it last erupt in 1984?
c) isn’t it likely to be (even in quiescent times) expelling some gases?
d) and won’t those gases contain CO2?
e) and so are the figures collected at Mauna Loa possibly a bit iffy?
I’m not trying to prove a point, or criticise your piece – I’m just penning a thought that occurred to me as I was reading it.
See my post Under The Volcano, Over The Volcano.
w.
Anyone want to guess what Mauna Loa temperatures have done over the last 40 years?
Fluctuated?
The parts of the economy shut down centered on travel, airlines and road traffic, which are likely a disproportionate share of emmisions… So I wouldn’t dismiss a 20% reduction based on any back of the envelope guesstimate.
Dismiss it? I included a 20% reduction in Figure 2. Still don’t think it’s happening.
w.
I also note that rather than a “disproportionate share” of CO2 emissions, all of transport combined is only 14% of CO2 emissions … from the EPA:
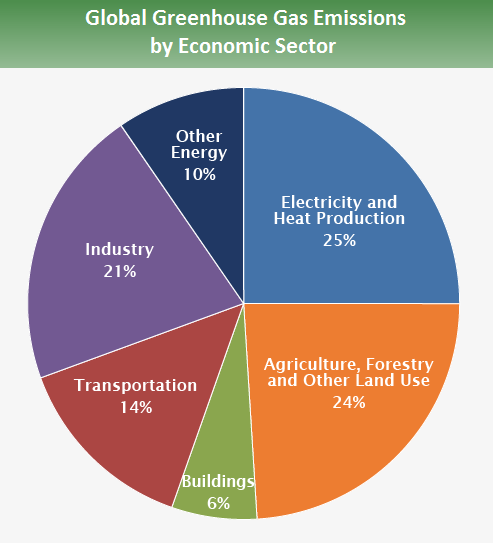
So if the transport sector declined by 25%, CO2 emissions would only drop by 3.5%
w.
The orange wedge includes crapola like land use change and methane belching cows. WTF is “other energy?”
Not a good representation of the CO2 emissions from fossil fuel use, a use which is supposed to be the +2.5 ppm/yr to +3ppm/yr driver of the MLO record ascent.
It is possible that human CO2 emissions are irrelevant. Henry’s Law says …
It also works in reverse. The pressure in a soft drink bottle depends on the amount of gas dissolved in the liquid.
The solubility of CO2 in water is not straightforward. link That means there might not be an easy answer to the question, how much would the ocean have to have warmed to completely explain the modern increase in atmospheric CO2?
Given Henry’s Law and given the vast amount of CO2 dissolved in the ocean, it is quite possible that human emissions are insufficient to upset the effect of CO2 solubility decrease with increasing ocean temperature.
To put it another way, it is possible that the solubility of CO2 in the ocean completely determines the partial pressure of CO2 in the atmosphere.
You are correct that the solubility of CO2 in water is not straightforward. Fortunately it has been well-studied. Unlike the solubility of nitrogen or oxygen in water, there are two significant chemical reactions going on at the same time with CO2 that makes the picture more complicated. Henry’s Law is still correct (even though it is not a true law, but an observation), but the amount of molecular CO2 dissolved in the liquid phase is in equilibrium with H2CO3 (carbonic acid), which is in equilibrium with H+ (hydrogen ion) + HCO3-(bicarbonate ion), which is in equilibrium with 2H+ + CO3-2 (carbonate ion). These all are a function of temperature, pH, and to a lesser extent salinity, and to a very small extent, pressure. Fortunately, the upper layer of the ocean is close to a constant salinity and pH, so the only significant variable is temperature.
Here’s the sentence from the link that has me spooked.
commieBob November 16, 2020 at 3:11 pm
“How much would the ocean have to have warmed to completely explain the modern increase in atmospheric CO2?”
Good question, Bob. We actually have passable data on this issue from the ice cores. From glacial to interglacial the global temperature changed by maybe 6°C or so. And CO2 went from ~ 200 to ~ 280 ppmv.
That’s mostly from oceanic outgassing as the ocean warmed. It gives us a relationship of 13 ppmv per degree of ocean warming.
Modern CO2 has gone from 280 ppmv to 410 ppmv. That’s a change of 130 ppmv. And at 13 ppmv per degree of ocean warming, the ocean would have to have warmed by 10° in the last few hundred years … which very obviously never happened.
That’s the problem. The numbers don’t work, not by a little, but by an entire order of magnitude.
Regards,
w.
Actually, the temperature of the ocean hasn’t changed much. Right now, the average temperature of the oceans is about 4°C. link I was wondering about temperature changes of a few tenths of a degree.
The deep ocean temperature is never going to change quickly. Different story above the thermacline.
http://www.climate4you.com/images/Pacific3monthTemperatureSince1955Depth0-100m.gif
Willis,
You went from
” the global temperature changed by maybe 6°C or so”
to
“the ocean would have to have warmed by 10° in the last few hundred years”
By what calculation do you get ocean temperature from an estimate of air temperature from ice cores?
Law’s of Henry was established using small laboratory equipment, where the temperature of the liquid and gaseous phase is the same. If the temperature is high, the liquid part dissolve less, if the temperature is lower then the liquid part will dissolve more gas. But this picture is deceptive. Actually temperature of the gaseous phase doesn’t play any role. What important is the temperature of the liquid phase and of course, the partial pressure of the dissolved material in the gaseous phase.
In case of ocean/air system +/- 10 degree Celsius change of the air temperature doesn’t affect the solubility of carbon dioxide in the ocean. On the other hand, even a little change in the ocean temperature itself can have dramatic impact on the carbon dioxide solubility.
About 0.1 degree Celsius increase of the ocean global average temperature can led to about 140 ppmv increase of the carbon dioxide concentration of the air.
(According to my own calculation, but I can be wrong, utterly wrong)
Indeed. Figure 5, in the paper I linked, is very interesting. If I understand it correctly, the vast majority of CO2 in the ocean exists in liquid form. In that case, as the graph shows, temperature has a much bigger effect on CO2 solubility than does pressure.
The deep ocean contains 37,000 Gt of CO2 and the atmosphere contains 800. link A 1% change in CO2 solubility pretty much explains the modern increase in atmospheric CO2.
Eyeballing Figure 5 shows that at around 80 MPa the solubility goes from 4.00 mol % to 3.75 mol % for a temperature change of 10°C. That’s around 0.6% per degree. So, a temperature increase of a bit over 0.1°C would produce the required change in CO2 solubility.
I am not a chemist and I note from the linked paper that many chemists have run afoul on these rocks. Anyway Peter, notwithstanding the foregoing, we seem to get close to the same result.
And at 13 ppmv per degree of ocean warming, the ocean would have to have warmed by 10° in the last few hundred years … which very obviously never happened
Oh, but Willis, the missing heat is hiding in the deep oceans, dontcha know. Just ask Trenberth 😉
The only valid example from ice cores is Law Dome DE08. The CO2 and temperature resolutions are comparable. The CO2 resolutions of all other Antarctic ice cores are too low for a valid analysis. Even then, you can only get to about above 20 ppmv per degree of ocean warming.
From ocean warming plus land-use change, we could possibly have gone from 280 to 340 ppmv. But everything above that is almost certainly from fossil fuel combustion and other industrial sources.
Do you have a link or an explanation?
Commiebob,
Here the temp/CO2 data for the 420.000 years Vostok ice core, recently extended to 800.000 years by the Dome C ice core record:
http://www.ferdinand-engelbeen.be/klimaat/klim_img/Vostok_trends.gif
The ratio between CO2 and Antarctic temperatures (where the snow is formed) is about 8 ppmv/K. Antarctic temperatures change about twice as fast as global temperatures, that gives a change if about 16 ppmv/K for global temperatures.
The change in solubility of CO2 in seawater was measured all over the world and the resulting change in equilibrium pCO2 pressure (~ppmv) with the atmosphere is also around 16 ppmv/K.
Nowadays there are continuous seawater measurements on commercial seaships which measure pH, pCO2, salinity,…
To compensate for the temperature difference between the inlet (Tin-situ) and the measuring equilibrator (Teq) they use a formula to compensate the pCO2 as measured towards the pCO2 it would have at the inlet temperature:
(pCO2)sw @ur momisugly Tin situ = (pCO2)sw @ur momisugly Teq x EXP[0.0423 x (Tin-situ – Teq)]
That is also around 16 ppmv/K…
A good description of the continuous pCO2 measurements and the above formula comes from a reseach vessel trip:
http://www.ldeo.columbia.edu/res/pi/CO2/carbondioxide/text/LMG06_8_data_report.doc
Thanks for the reply Ferdinand.
The bulk of the ocean operates under quite a different regime than the surface waters.
Somewhere around 500 meters CO2 is in its liquid state and its solubility is mostly determined by temperature. In the case of water nearer the surface, CO2 solubility is largely determined by pressure.
As far as I can tell, a small increase in the temperature of the water below the thermocline would result in a significant decrease in CO2 solubility. On the other hand, even a small increase in that water’s temperature would be remarkable.
The relationship between carbon dioxide emission and GDP is valid if and only the energy intensity is uniform. China’s GDP is going to grow this year. The countries whose GDP will be hardly hit will most likely be the countries with large service sector such as banking, finance, consulting, arts. culture, sports, entertainment, tourism, transport and including hospitality but non-tourism related industries where energy intensity is low. GDP is expressed in nominal currency or it could be PPP.
eo November 16, 2020 at 3:11 pm
True, eo. However, we’re not looking at the change in intensity over time. We’re looking at a change in GDP over a few months, during which time we can assume the energy intensity is unchanged.
w.
But the decrease in GDP isn’t of the same uniform as GDP in it’s entirety. Some sectors of the economy were hard hit while others were hardly hit. Not all sectors emit the same levels of CO2. So a drop in a heavy emitting sector will have a greater impact on CO2 emissions than a drop in a lightly emitting sector. In other words the relationship isn’t as simplistic as you paint it.
We can all agree that assuming a linear relationship is not a good assumption.
Do you have a better assumption, one that can be used to make an estimate given the data available at the moment?
I’m not the one pushing a bad assumption. You’re responding like a climate alarmist would whenever the flaws in CAGW theory are pointed out. It’s not (and never has been) the job of the person pointing out that an assumption is bad to come up with a better assumption, no matter how many times the CAGW crowd have tried to pull that one. I expect better than that from you.
In this case, all you have done is point out that the assumption isn’t perfect, which was readily acknowledged by the author in the original piece.
Unless you are willing to make the claim that all assumptions must be perfect, otherwise nothing can be written, then you are making yourself look mighty shallow by continuing to harp on something that everyone acknowledges.
Start with bad assumption, it can only go down hill from there. Knowingly starting out with bad assumptions is even worse. Defending knowingly starting out with bad assumptions and you end up are making yourself look even worse. Sadly, I expected better from you.
John Endicott November 18, 2020 at 2:37 am
I do love all of these folks claiming I made a “bad assumption” … boys, I GOT THE RIGHT ANSWER, so my assumptions cannot be far wrong, and they’re certainly not “bad”.
w.
With just the actual increases in YOY CO₂ as graphed by Willis above, the rate of CO₂ increase is indistinguishable from CO₂’s increasee late 2011 through 2012.
Claims that the ‘lockdown’ has reduced CO₂ look to be pure delusion.
Excellent analysis Willis!
Thanks for the YOY view.
ATheoK November 16, 2020 at 3:13 pm
True, AND:
The data provides little evidence for either point of view.
w.
Hi Willis,
Thank you very much for the clarity and brevity of your article; to the point and illuminating.
That is indeed my aim, which I encapsulate as “BCI”. I want my contributions to be:
Brief
Clear
Interesting.
“Brief”, of course, is a function of the complexity of the subject …
w.
Your favourite PIK website released this news article
https://www.pik-potsdam.de/en/news/latest-news/biggest-co2-drop-in-history-real-time-data-show-covid-192019s-massive-impact-on-global-emissions
Those guys should switch academic fields. http://www.todayifoundout.com/index.php/2014/05/origin-expression-blow-smoke-ass/
Full on zombie apocalypse and all that was managed that emissions still grew, but only by 8.8% less than they grew in 2019
Dr. Maue just got the liberals skivvy britched in a knot!
https://thehill.com/policy/energy-environment/526160-scientist-questioning-ties-between-climate-and-extreme-weather-to?amp
Willis, you could even use published materials to “estimate in line with the orthodoxy” the reduction of CO2 emission due to COVID lockdown
https://doi.org/10.1038/s41558-020-0797-x
as a note, your estimation is not far off…. but you didn’t get a grant for it 🙂
Thanks for the link, John. Fascinating … it says between 4% and 7% reduction, where I said between 4.5% and 5.3%, with my best estimate around 5%.
True, no grant …
w.
Dr. Maue just got the liberals skivvy britches in a knot!
https://thehill.com/policy/energy-environment/526160-scientist-questioning-ties-between-climate-and-extreme-weather-to?amp
Maybe Gaia knows that if there’s no fresh CO2 being produced, she has to hold on to what she’s already got.
(come on guys, this as good a theory as anything else that has been postulated)
Gaia has periods when she’s not so nice.
So does my wife.
There’s no Gaia, you bunch of pagans. 😉
Mr,
I disagree.
I think the theory that digging up mountains of coal that formed over many millions of years, and burning it, and pumping up a mountain sized volume of oil and burning it, and lordy only knows how much of that natural gas, and burning it, is adding a bit of the combustion product to the air into which the burning takes place, is a better theory about why there is more of it every year than there was the previous year.
At least I hope so.
If it has nothing to do with us, that would mean that if whatever actually is causing the current increase, were to reverse, so would the levels in the air begin to decline…and that would be very bad for food production in a world with billions and billions of hungry people.
George Carlin had a better theory too.
He thought that the Earth invented people because it wanted to have plastic.
So it got a twofer out of the deal…more CO2 that was getting all bound up in rocks and ooze under the ground.
Kind of like how we get a twofer…we get the energy we need from burning it, and then it makes it easier and faster to grow plants, and let’s plants thrive in laces where there was not enough water before.
I think it was just luck.
We found stuff under the ground that is very useful to us.
We got it out of the ground and burned it, and never worried about the stuff that was left behind in the air by burning it.
Once we did start thinking of it, some people decided that since we changed something, it has to be bad.
But this time we got lucky, because that stuff happens to be something the air has been running out of gradually for millions of years.
Kind of like the guy who thousands of years ago never knew that pee and poop was great for making plants grow, he was just too lazy to walk all the way to the woods behind his crop fields, so he just did his business in the wheat.
Then someone noticed that these were the greenest fields around, and he got the most wheat of anyone, more than the people who walked into the woods to pinch their loaves.
I bet there were people who never believed that crap was good for the Earth back then, and predicted the world would end when all the fields were ten feet deep in poop and drowning in pee.
And that never happened.
And here we are, making plastic for our plastic starved planet.
*insert moral to the story here*
The more things change, the more they stay the same.
Except when Democrats get elected.
Then they get crappier.
I like the thought and analysis- but it never was about CO2 and the more we see the ridiculous claims the more they need to be told straight out- It always was about power and money, and never really was a concern about the environment, except for the heartfelt efforts of the useful idiots…