
Inside SpaceX’s Payload Processing Facility at Vandenberg Air Force Base in California, the U.S.-European Sentinel-6 Michael Freilich ocean-monitoring satellite is being encapsulated in its payload fairing on Nov. 3, 2020. Sentinel-6 is scheduled to launch on Nov. 21, 2020, at 12:17 p.m. EST, atop the SpaceX Falcon 9 rocket from Space Launch Complex 4E at Vandenberg Air Force Base.
A U.S.-European partnership, the Sentinel-6 Michael Freilich spacecraft will begin a five-and-a-half-year prime mission to collect the most accurate data yet on global sea level and how our oceans are rising in response to climate change. The mission will also collect precise data of atmospheric temperature and humidity that will help improve weather forecasts and climate models.
The spacecraft is named after Dr. Michael Freilich, the former director of NASA’s Earth Science Division and a tireless advocate for advancing satellite measurements of the ocean. Sentinel-6 Michael Freilich builds on the heritage of the European Space Agency’s Copernicus Sentinel-3 mission as well as the heritage and legacy of the U.S.-French TOPEX/Poseidon and Jason-1, 2, and 3 series of sea level observation satellites. Launched in 2016, Jason-3 is currently providing data initiated with the observations of TOPEX/Poseidon in 1992.
The data from these satellites has become the gold standard for sea level studies from space over the past 30 years. In 2025, Sentinel-6 Michael Freilich’s twin, Sentinel-6B, is scheduled to launch and advance these measurements for at least another half decade.
Image Credit: NASA/Randy BeaudoinLast Updated: Nov. 6, 2020Editor: Yvette Smith
[Paging Rud….Paging Rud~cr]
Re: “The data from these satellites has become the gold standard for sea level studies from space over the past 30 years.”
Wow, that ought to be in the encyclopedia, as the example, next to the entry for “The Big Lie.”
Measurement of sea-level by satellite altimetry turns out to be a dubious exercise. It has proven to be highly unreliable.
The gold standard for sea-level measurement is the best coastal tide gauges. Many of them have have precise, continuous or near-continuous, reliable measurement records extending back more than a century. Some go back more than two centuries.
That’s long enough for us to compare sea-level trends now, with rising CO2 concentrations, to what sea-level trends were, back before mankind had much affected atmospheric CO2 concentrations.
If you want to understand what’s wrong with that satellite altimetry data, read about it here:
https://sealevel.info/satellite_altimetry.html
Here’s the best long, continuous sea-level measurement record in the Pacific…
At my sealevel.info site: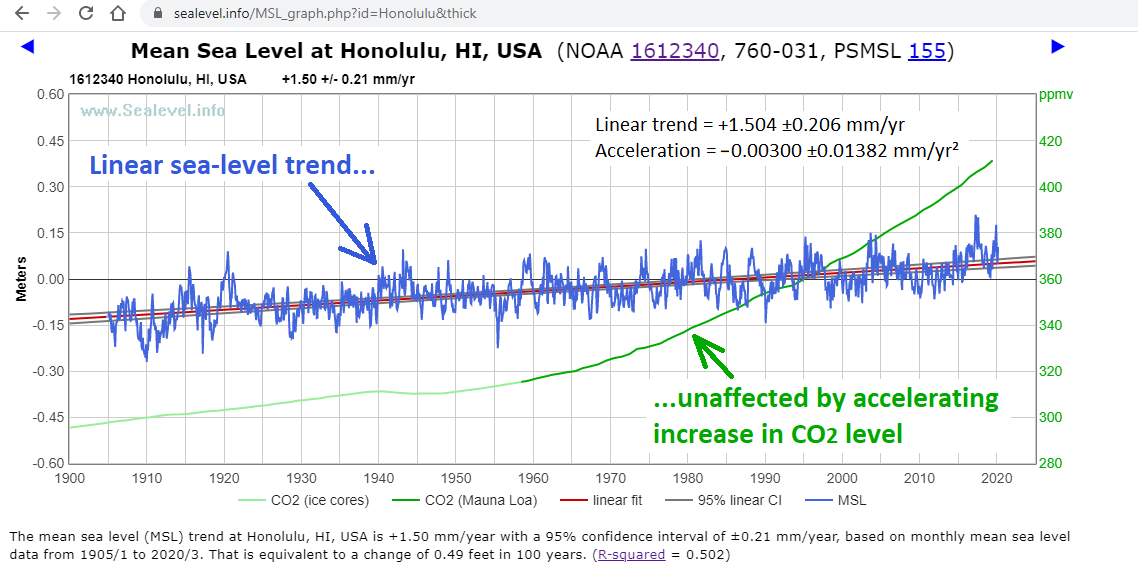
●
● https://sealevel.info/MSL_graph.php?id=Honolulu
At NOAA:
● https://tidesandcurrents.noaa.gov/sltrends/sltrends_station.shtml?id=1612340
That measurement record is vastly better than the satellite altimetry measurements.
+100%
Also much less expensive.
Gold standard means that which ensures the most money in research grants , maybe you misunderstood the term !
So once again the result is declared before the spacecraft is even on the launch pad. An objective scientific mission would be going out measure sea levels.
Funny how the precision of the altimeter isn’t mentioned except in vague terms like “millimeter-level precision” and “precision and accuracy compared to the currently-flying Jason-2 mission”. The precision of Jason-2 may be about 2.5 centimeters, hardly “millimeter-level precision” and certainly not as accurate as tide gauges.
The first records at the french tide-gauge of Brest (France) are as old as 2 centuries, in a time when Napoleon was still alive. This tide gauge’s first continuous and reliable records began by the year 1845.
My sealevel.info site has sea-level measurements for Swinoujscie, Poland from January, 1811 through December, 2019, with just two gap totaling 6½ years. That’s more than 202 years of reliable data.
https://sealevel.info/MSL_graph.php?id=2&boxcar=1&boxwidth=3
Like Brest, Swinoujscie did record some acceleration in its sea-level measurement record, but most of it was before WWII.
https://sealevel.info/MSL_graph.php?id=2&boxcar=1&boxwidth=3&c_date=1933/1-2024/12
Perhaps the satellite will also detect changes in sea levels associated with other mechanisms like plate tectonic movements, glacial isostatic adjustment and all other wholly natural effects. One wonders how such effects will be separated from the headline issue of oceans rising because of anthropogenic global warming or as it is now called climate change?
Like trying to detect the smell of roses in somebody’s garden by sticking your head out the window while driving by on the highway.
But, absolutely fit for purpose of generating ominous fake data at odds with real world tide gauges. Since the measurement is basically impossible, it opens the door to “adjustments”!
You see, we take this random noise and superimpose on it our hopes and dreams encoded into our model, and voilà!—worse than we thought.
I can imagine satellite may help to improve “week-weather” forecasts.
I can’t understand how the satellite will improve the “30-year-weather” forecast models.
The Sea is not rising. What moron doesn’t understand this ???? The land is sinking. We float on molten lava. We go up and down. That’s what we should be measuring. Who’s in charge here ???? Someone stealing tax dollars, or some brainwashed man made climate change look ????
So much trouble and expense to try to support “global warming” aka “climate change” theories.
….and if the oceans rise and/or fall the cause of this is related to a trace gas in the atmosphere because…..?
They’re trying to answer a loaded question. “Have you stopped beating your wife?” assumes you beat your wife and …how our oceans are rising in response to climate change. assumes that oceans are rising in response to climate change.
In other sea level news:
CU’s Sea Level Research Group
https://sealevel.colorado.edu/
has released 2020rel_1 after nearly three years of inactivity.
Sea Level Rise acceleration now appears on their home page graph, it’s increased from 0.084 mm/y² to 0.097 mm/y² from their paper of two years ago:
Climate-change–driven accelerated sea-level rise detected in the altimeter era
The rate has been increased from 3.1 mm/yr in 2018 to 3.3 mm/yr today.
Thanks.
3.1 to 3.3 does not sound like a lot, but it adds up, and after only 2 tears. They claim acceleration of 0.097 mm/yr.
I will plot this up to the year 2100 and see when all our cities flood out.
I propose a new unit of SLR: the “Statue of Liberty“, how much SLR we need to submerge that iconic statue in New York harbor.
> … prime mission to collect the most accurate data yet on global sea level and how our oceans are rising in response to climate change.
That’s not science. That’s confirmation bias.
Science isnt even able to selectively measure just any component of a gross physical measurement.
Rob_Dawg November 7, 2020 at 3:08 am
That’s confirmation bias.
BINGO!
I was gonna say the same. Nothing like a conclusion before the experiment to start your science day.
Quote:
prime mission to collect the most accurate data yet on global sea level and how our oceans are rising in response to climate change
If that’s the case, why even bother launching the Sputnik?
They know exactly what they’re gonna find an matter what comes out of Sputnik, it will be made to fit
Quote:
….collect precise data of atmospheric temperature an….
Oh yeah
Could even Starship Enterprise do that?
As I understand, the temp measuring, a-la Doctor Spencer at UAH, is from seeing the microwave emissions at between 55 and 60GHz of (primarily) oxygen.
MASSIVELY dependant on both temperatures AND pressure
After months of calibration (flying Sputnik over ground based thermometers) the Sputnik can record air temperature to plus or minus 2 Celsius after the data has been through A Model
Mosh will assure about those
Do you laugh or cry….
This is just part of the global warming racket. The Chinese must be real interested in this data. China has built islands in the South China Sea….will they have to build higher?
And the palm tree shaped islands adjacent to Dubai – unless they are floating.
how our oceans are rising in response to climate change.
Looks like we all caught the same thing. If you announce the result before you start data collection we know already the data will be garbage and the conclusion is predetermined.
Kind of like elections in Democrat controlled counties in the USA.
Yeah, sort of jumps out at you doesn’t it.
But hey, what really matters here is that it’s a US-European partnership. It must have required dozens of dinners at Michelin 3-star restaurants, building on the legacy of hundreds of prior gastronomical experiences to achieve this pinnacle of crap data!
It’s very important that the same lies are told by everyone on the team. Telling the truth is easy, but when you’re lying, there’s so much to remember. The team needs to work together closely to avoid anyone inadvertently telling the truth or a contradictory lie.
Strangely, no word about the sharks with frickin’ laser beams on their heads.
‘Most accurate’ may be true but still irrelevant. I discussed this at length in my guest post “sentinel six and sea level rise”.
Found here:
https://wattsupwiththat.com/2020/09/07/sentinel-6-and-sea-level-rise/
Poseidon4 altimeter shows no improvement. 3.2cm accuracy.
http://database.eohandbook.com/database/instrumentsummary.aspx?instrumentID=1723
Showing “Being Developed” and “Updated for 2021”
I ran a search on dr michael freilich .publications. Result:
Not many results contain publications.
Search only for dr michael freilich “publications”?
This tells you how to become a famous scientist.
I use DuckDuckGo for a search engine.
Curious George
When you will have reached what this man has achieved, please tell it us!
https://www.ametsoc.org/index.cfm/ams/about-ams/ams-election-information/2019-ams-elections/2020-ams-president-elect/michael-h-freilich/
https://www.eumetsat.int/website/home/News/DAT_5129549.html?lang=EN&pState=1
Who are you? What exactly are you doing?
J.-P. D.
Why not just upgrade/maintain the tidal-gauge network? There’s little interpretation w/that — you know, measuring the sea-level directly.
Actually, correctly interpreting tidal gauges to measure true global sea-level (and its rate-of-rise) requires a lot of “interpretation”.
Primarily, one needs to correct each tidal gauge’s vertical position against a reference geoid of Earth to properly account for land subsidence or uplift where each gauge is located. And Earth’s geoid has not been determined (i.e., mapped with sufficient resolution) to the degree of accuracy needed for eliminating vertical errors associated with the exact geographic location of each and every tidal gauge on Earth.
Also, one needs to correct tidal gauge data for local—sometimes transitory for weeks to months timespans—effects of wind, ocean currents, water temperature and atmospheric pressure variations.
A fortiori, these problems will also afflict satellite measurements of sea level. How will the satellite be calibrated? Which datum will it use?
It seems the old tide gauges aren’t giving the “correct” result.
I don’t believe that satellites need to correct for land subsidence or land uplift when measuring global sea-level.
AFAIK, satellite measurements are/will be referenced to same vertical datum(s) used by land-based tide gauges: the Earth’s reference ellipsoid and/or the Earth’s reference geoid, as agreed-upon internationally.
The Aviso folks add 0.3 mm/yr isostatic adjustment to all their reported sea-level trends, from satellite altimetry. That’s the estimate they use for the amount by which sea-level would be falling due to ongoing sinking & broadening of ocean basins, due to meltwater load from the last deglaciation, were there no other factors affecting sea-level.
AVISO used to make adding the isostatic adjustment optional in their graphs, but they removed that feature. I wrote to them and asked them to restore the feature. They politely refused.
Note: As you can see (above), Aviso told me, “We do include the corresponding uncertainties in our total uncertainty assessment of 0.5 mm/yr (PGR participates by 0.05mm/yr at 90% CL).”
But to the best of my knowledge Prof. Peltier and his colleagues have not published uncertainty estimates for their 0.3 mm/yr ocean basin GIA estimate, nor for any of their other GIA / PGR figures. Tamisiea, 2011 gives a much broader range: 0.15 to 0.5 mm/year.
I wonder whether Aviso just assumed that they could approximate Peltier’s uncertainty by using half of his last (only!) significant digit? “±0.05mm/yr” seems very optimistic compared to Tamisiea’s 3.5× larger interval: 0.325 ±0.175
Dave Burton stated: “The Aviso folks add 0.3 mm/yr isostatic adjustment to all their reported sea-level trends, from satellite altimetry.”
Well, such an estimate might be more-or-less properly applied to the majority of deep ocean areas subjected to satellite altimetry, but what glacial isostatic adjustment (both magnitude and direction) should be applied to costal areas . . . i.e, those areas where most tidal gauges are located . . . is not at all clear. Where great depths of ice once overlaid land, that land should be undergoing uplift, or movement opposite to the subsidence being experienced by some costal areas (aka “forebulge collapse”) and continental shelves.
As but one example,
“New research using GPS and prehistoric data has shown that nearly the entire coast is affected, from Massachusetts to Florida and parts of Maine.
“The study, published this month in Geophysical Research Letters, outlines a hot spot from Delaware and Maryland into northern North Carolina where the effects of groundwater pumping are compounding the sinking effects of natural processes”
—John Upton, “Sinking Atlantic Coastline Meets Rapidly Rising Seas”, Scientific American, 14 April 2016
Thus, precision surveys (land or satellite based) of some costal areas indicate a wide range of land subsidence whereas other precision surveys of other costal areas indicate a wide range of land uplift. And not all these differences can be associated with simple GIA . . . some is due to plate tectonics and some is due to pumping water out of underground aquifers.
In simpler terms, it’s a mess.
And, FWIW, I wished AVISO has incorporated your recommendation.
I don’t believe that satellites need to correct for land subsidence or land uplift when measuring global sea-level
“Global sea-level” is like “global temperatures” — mostly meaningless. Specific locations are where people live/deal with and what matters.
I suppose it’s a similar problem to overcome if you want to measure subsidence or isostatic rebound of the land. What is your fixed datum for the measurement? Maybe someone can explain how we are doing that and whether the method is better than sentinel 6.
In principle it seems to me to be more practical to continuously measure the vertical movement of land near a few hundred established tide gauges than to estimate the distance from a low earth orbit satellite to a wavy, variably reflective sea surface subject to storm surges and ebbs, over the entire ocean surface of the earth.
Rich asked: “What is your fixed datum for the measurement?”
Well the reference datum is not established by a fixed, physical set of locations, but is instead a theoretically-computed 3D reference surface.
In fact, there is a major effort presently underway, the NOAA-National Geodetic Survey’s “Gravity for the Redefinition of the American Vertical Datum” (GRAV-D) project to provide much-improved topographic elevation measurements for most of the US . . . but to only 2 cm accuracy, which itself is about a factor of ten better than existing topographic elevation accuracy (Ref: https://www.ngs.noaa.gov/GRAV-D/ ). This website provides a link to a free pdf download of the GRAV-D project plan, wherein beginning on page 1 there is a good description of the difference between reference ellipsoid vertical height (which GPS determines) and reference geoid orthometric vertical height (“colloquially—although not quite appropriately—referred to by the more common term ‘height above sea level’ “)
Yet the earth is not a perfect ellipsoid and is also not a static irregular shape, so I’m not immediately convinced that an accurate datum can be established. I will read your link but with great skepticism.
When you want to measure a 0.01mm/yr^2 acceleration in slr, but your measurement is only accurate to 10-20 mm, how is that justified?
At least with a tide gauge, true vertical position is not oscillating irregularly at anywhere near the amplitude of the sea surface (surely many orders of magnitude less). The net change in vertical position from isostatic rebound minus subsidence due to aquifer depletion is probably two logarithmic functions superimposed, both trending asymptotically toward zero movement. I would guess that in many places, we can confidently state that vertical movement is almost zero or has a perfectly linear slope compared to a putatively accelerating sea level rise. Therefore any real slr acceleration should “bend the curve up” on virtually every tide gauge on earth.
Are we seeing that? I think not.
The direct measurement of relative sea level is obviously still affected by storm surges and ebbs, and must properly account for astronomical tidal effects. The satellites have all those confounding factors but with a much bigger uncertainty of the position of the satellite and the phase of wave height at the brief moment of measurement.
In a world where the scientific method was used, the null hypothesis would be that sea level rise is not accelerating.
We would be seeking out evidence of tide gauges that show a linear trend contrary to the predicted non-linear curve. Linear tide records could only be reconciled with an accelerating sea level rise by positing an equal and opposite acceleration of isostatic rebound or an equal and opposite deceleration of subsidence. While an opposing change is not impossible, an exactly equal and opposite effect perfectly cancelling out the slr acceleration is not a reasonable assumption and certainly could not be observed at widely dispersed sites around the globe.
Rich, you posted: “At least with a tide gauge, true vertical position is not oscillating irregularly at anywhere near the amplitude of the sea surface (surely many orders of magnitude less).”
Well, that’s true as far as it goes when considering tide gauge vertical position relative to measured local sea-level vertical position.
I’ll just comment that sea-level atmospheric pressure, normally 29.92 inches Hg, can vary from a typical “maximal high” of 31 inches to a typical “minimal low” of 29 inches. This is equivalent to about +/- 0.5 psi, or about +/- 343 mm variation in water height (note: based on seawater s.g. = 1.025).
So, atmospheric pressure variations about any give tide gauge, if left uncorrected, will overwhelm whatever measurements of sea-level are being made to mm vertical resolution, even accounting for land subsidence/uplift rates. I am not aware of tide gauge reporting measurements typically being corrected for atmospheric pressure (due to local, varying weather conditions) at time-of-measurement. I guess the (unconfirmed) assumption is that all tide gauges will always average to have 29.92 inches Hg ambient pressure . . . I question this assumption.
Just one issue, among many I mentioned above, in asserting that tide gauges (or even satellite altimetry) can be used to accurately (i.e., with mm resolution) reflect the actual local sea-level over any given geographic area and length of time.
Gordon,
I have never disputed that it is *almost* as difficult to measure slr by a tide gauge as it would be by satellite altimetry.
I don’t think that you have identified any confounding factor for tide gauges that is not also a confounding factor for satellite altimetry. Would you dispute that?
At the same time, we have a better idea of where the top of the tide gauge is relative to some hypothetical geoid surface than you can have about the height of the satellite.
In any case, it does not actually matter if you perform ANY adjustments to the individual data points of the tide gauge raw data. You just need to do a linear regression and determine if it is a good fit.
You must expect that in the face of accelerating sea level rise, it should be a rare site indeed where the tide gauge could show a strongly linear trend. That could only happen if the acceleration of vertical displacement of the land is exactly equal but opposite in sign to the acceleration of sea level rise. The more sites you find with linear trend lines rather than the upward curving trends that are predicted, the less probable that all of them have miraculously equal and opposite land displacement acceleration. Many linear trends should be seen as evidence for the null hypothesis that sea level rise is not accelerating.
For any actual sea level rise acceleration to be meaningful in a human lifetime, the acceleration can’t be so minor that it cannot be detected. For example, starting from a 3.3mm/yr rate, in order to see a meter rise in 30 years, we’d need to see 2mm/yr^2 acceleration. 5.3mm/yr next year, 7.3mm/yr in 2022, 9.3mm/yr in 2023, and so on for 30 years.
Certainly nothing close to that has been seen.
“mission to collect the most accurate data yet on global sea level and how our oceans are rising in response to climate change.”
So they state the conclusions before launch! I guess this helps with ‘truthing the data’ afterwards to fit the desired findings. It’s so well established a process that they now use it to correct US elections.
In the photo they even look like a bunch of clowns. Very appropriate.
But it is cheap, only $97 million.
From the above article: “. . . the Sentinel-6 Michael Freilich spacecraft will begin a five-and-a-half-year prime mission to collect the most accurate data yet on global sea level and how our oceans are rising in response to climate change.”
OK, time for a reality check. To wit:
NOAA currently documents that global SLR has been in a LINEAR trend of 3.0 +/- 0.4 mm/year since 1993, based on satellite altimetry data from the TOPEX, Jason-1, Jason-2 and Jason-3 satellites. (Ref: https://www.star.nesdis.noaa.gov/socd/lsa/SeaLevelRise/LSA_SLR_timeseries.php )
So, first, we can conclude that to the extent that “climate change’ may have worsened over the last 27 years, it is not being reflected by any satellite-measured changes in the rate-of-rise of global sea-level.
And second, with an existing implied measurement precision of 0.1 mm/year, coupled with an implied reduced data accuracy for global SLR of +/- 0.4/3.0 = +/- 13% over those same 27 years, do we really need “the most accurate data yet” on global SLR?
So what? I’m glad it’s climate change and not global warming. When we get a pause or La Niña plus solar cooling the change may well be downwards. Personally I go down to Newlyn and worship the gauge.
Looks like a show and tell promotional to legitimize climate change theory. As someone noted it should also measure land change in elevation.
It is always good to know when your at the waters edge when launching a boat or landing a sea plane. Or fishing. Or diving. Or swimming. And good to know the depth at any given time since the moon pulls on more than water.