Reposted from Polar Bear Science
Posted on September 20, 2020 | Comments Off on Potential impact of the second-lowest sea ice minimum since 1979 on polar bear survival
The annual summer sea ice minimum in the Arctic has been reached and while the precise extent has not yet been officially determined, it’s clear this will be the ‘second lowest’ minimum (after 2012) since 1979. However, as there is no evidence that polar bears were harmed by the 2012 ‘lowest’ summer sea ice this year’s ‘second-lowest’ is unlikely to have any negative effect.

This is not surprising since even 2nd lowest leaves summer ice coverage in the Arctic at the level sea ice experts wrongly predicted in 2005 wouldn’t be seen until 2050 (ACIA 2005; Amstrup et al. 2007; Wang and Overland 2012) and this is the same amount of summer sea ice that polar bear experts incorrectly predicted would cause 2/3 of all polar bears to disappear. My book explains how it all went wrong: The Polar Bear Catastrophe That Never Happened.
In this summary of how polar bears have been doing since the the lowest sea ice minimum in 2012, I show that contrary to all predictions, polar bears have been thriving despite reduced summer ice in the Barents, Chukchi and Southern Beaufort Seas, and because of unexpectedly short ice-free seasons in Hudson Bay and less multiyear ice in the Canadian Arctic Archipelago.
Polar bear specialist Andrew Derocher claimed a couple weeks ago that low summer sea ice – such as occurred in 2012 – harmed polar bear ‘energetics’:
Arctic sea ice has dropped to incredibly low levels. 2012 was the record low & 2020 is already the 2nd lowest. Low summer sea ice negatively affects the energetics of polar bears & has huge impacts on the ecosystem from top to bottom. pic.twitter.com/0rxJ8NYlAv
— Andrew Derocher (@AEDerocher) September 8, 2020
This statement implies that overall Arctic summer ice at 2012 had a direct detrimental effect on health and survival because bears were not getting enough to eat – and by extension, spelled imminent disaster for the species. In fact, no evidence exists that the especially low summer sea ice levels in 2012 negatively impacted polar bears – or surely, Derocher would have provided it. On the contrary, what evidence does exist (from the Southern Beaufort, the Canadian Archipelago, and the Barents and Chukchi Seas), shows that polar bears in many areas have done better with less summer ice since 2007 or have had no negative effects. Other examples discussed here.
Southern Beaufort Sea
If low summer sea ice was going to decimate the Southern Beaufort subpopulation – as polar bear expert Steven Amstrup keeps insisting it will do – it should have done so in 2012. In 2012 the Arctic pack ice retracted a huge distance north of the coast of Alaska (see ice chart below for 13 Sept).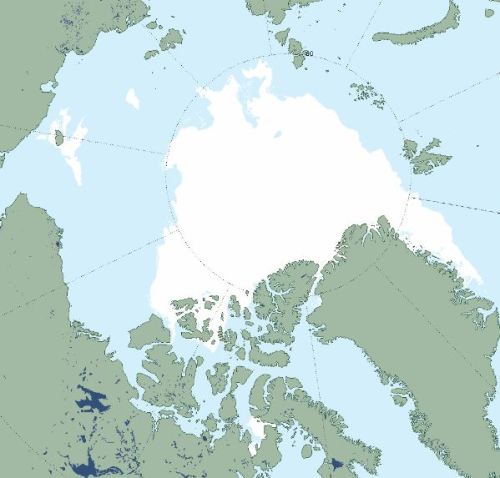
NISDC Masie ice chart at 13 September 2012.
But if there was a negative impact of low summer sea ice in 2012 on Southern Beaufort bear, it wasn’t evident by 2013, when researchers were doing field research in the area (Rode et al 2013, 2014, 2018) – in other words, there were no public alarms raised by biologists that polar bears were starving or that they were seeing much reduced numbers of cubs.
Any harmful effects were similarly not evident by July 2019, when more bears since 2012 (when a US Fish and Wildlife Service fall survey found numbers were higher than they had been in a decade, see USFWS 2013:17), were seen onshore – all fat and healthy – during a fall survey of the Alaskan coast (below).

This year (see chart below), there is a lot more multiyear ice off the north coast of Alaska that has survived this year’s melt than there was in 2012, which means when freeze-up comes the ice will move sooner back against the shore (which didn’t happen until the end of October in 2012).
NSIDC Masie ice chart at 14 September 2020.
Barents Sea/Svalbard
The Barents Sea is considered by polar bear experts to be at high risk of population decline due to loss of summer sea ice (Amstrup et al. 2007). As of 2015, the area had lost the highest percentage of summer sea ice since 1979 of all polar bear regions (Regehr et al. 2016). Despite this massive decline in summer ice, Barents Sea polar bear numbers have not declined at all since 2004: rather, the Svalbard area population has seen a documented but ‘statistically insignificant’ increase of 42% that almost certainly can be extrapolated to the entire Barents Sea region (Aars 2018; Aars et al. 2017; Crockford 2019) – although the IUCN Polar Bear Specialist Group will only concede the population is ‘likely stable‘.
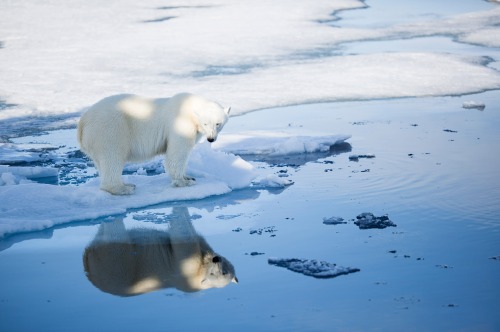
Moreover, the body condition of females has increased significantly (that’s statistically significant) since 2004 while the condition of males has been stable (Lippold et al. 2019) – bears captured during the August 2015 population count were in excellent condition (above).

In other words, as far as can be determined, the low summer ice levels of 2012 in the Barents Sea (above) had zero impact on the health or survival of these bears in this region. There is therefore no reason to suggest this year (below) would be any different, especially since the previous ‘second lowest’ summer sea ice year of 2016 also produced no evidence of harm to Svalbard area bears.

Note that one of the reasons there has been no impact from such low summer ice is that there is a natural movement of Svalbard area pregnant females to the polar pack ice or to Franz Josef Land in the eastern Barents Sea when summer sea ice levels around Svalbard are low (Andersen et al. 2012; Derocher et al 2002). This behavioural response to changing sea ice conditions is normal for polar bears and is a critical feature of their success in an ever-changing Arctic habitat (Crockford 2015).
Chukchi Sea
The Chukchi Sea polar bear subpopulation is also considered by polar bear experts to be at high risk of population decline due to loss of summer ice (Amstrup et al. 2007; Durner et al. 2009). However, to the astonishment of polar bear researchers, Chukchi Sea polar bears are thriving by all measures used to assess individual and population heath despite marked declines in summer sea ice since 2007.
Body condition has been better in recent years than it was in the 1980s when there was a shorter ice-free period and females are reproducing well (Rode et al. 2013, 2014, 2018). A 2016 survey put the population size at about 3,000 bears, considerably higher than the estimate of about 2,000 bears used in the 2015 Red List assessment (AC SWG 2018; Regehr et al. 2016, 2018; Wiig et al. 2015). In August 2018, polar bear biologist Eric Regehr was quoted as saying:
“Chukchi bears remain larger and fatter and have not seen downward trends in cub production and survival, according to new preliminary information on the health and numbers of bears.”
This positive result for Chukchi Sea bears is a direct result of the fact that Chukchi Sea ringed and bearded seals – the primary prey of polar bears – were also found to be doing much better up to 2013 than they were in the 1980s when the open-water period was much shorter (Crawford and Quakenbush 2013; Crawford et al. 2015; Rode et al. 2018), and preliminary data from on-going studies suggest this continues to be the case (Adam et al. 2019). These results strongly contradict predictions that ringed and bearded seals numbers would decline markedly due to summer sea ice loss, which formed the basis of classifying both species of seals as ‘threatened‘ in the US in 2012 (USFWS 2008, 2012).
Arctic Archipelago
As I’ve pointed out previously, polar bears are almost certainly thriving in most areas of the Canadian Arctic Archipelago (CAA; ‘Archipelago’ areas in gold in the sea ice ecoregion map below). This is because the ice has changed from primarily multiyear ice in winter to first year ice (‘seasonal’) in most of the Archipelago region.
In 2007, US government biologists predicted that when summer sea ice declined dramatically by 2050, all of the polar bears in the green and purple regions would be wiped out, leaving only about 8,100 remaining.
First year ice over shallow water is overall the best habitat for polar bears because it is the best habitat for ringed seals in the winter and spring. The multiyear ice that dominated some areas of the CAA during the 1970s and 1980s (like Viscount Melville) kept densities of ringed and bearded seals low (Amstrup 2003: 593; Stirling and Øritsland 1995), which meant that polar bear populations were also low. However, several eastern regions of the CAA, like Lancaster Sound and the Gulf of Boothia, which have more seasonal ice mixed with multiyear ice, have much higher densities of seals and bears.
The shift from multiyear to first year ice in parts of the CAA has happened much sooner than expected. Wang and Overland (2012) used the same sea ice models used by USGS biologists to predict the future survival of polar bears based on habitat loss and they all expected ice in the CAA to persist up to 2030 even as ice in the Arctic Basin declined. But they were wrong: instead, multiyear ice has been scarce in the CAA in all but the northern-most region since 2007 (and especially in 2012, see below). This means that since 2007 much of the ice in the CAA has been the relatively ‘thin’ first year ice habitat (<2m thick) in which polar bears and ice seals thrive.

In 2005, about 5000 bears were thought to live in the Archipelago ecoregion (Amstrup et al. 2007): that number has almost certainly increased markedly, although only data from Kane Basin has been published. In Kane Basin, we now know the population more than doubled even though bears went from having ice all summer long (>50% ice covered) in the 1990s to being virtually ice-free (<5% ice covered) for a month (SWG 2016:447, 464).

I previously suggested that polar bear numbers in M’Clintock Channel were likely to have changed by the largest percentage (like Kane Basin), while Gulf of Boothia and Lancaster Sound have probably changed much less.
We are still waiting for final reports and survey results from Gulf of Boothia (completed 2017), Viscount Melville (completed 2014), and M’Clintook Channel (completed 2016) (Crockford 2020). However, polar bear expert Ian Stirling recently admitted that the M’Clintook Channel population “seems to be increasing” (as I predicted), although the report with details on the study and the amount of increase has still not been made public.
Southern Hudson Bay
The newest rendition of polar bear survival predictions (using a complex climate model merged with a body condition model), recently suggested climate change could starve polar bears into extinction by 2100 but only because it used implausible climate model inputs (Hausfather and Peters 2020) and stale data. The model’s creators (Molnar et al. 2020) warned that some polar bear subpopulations, but especially Southern Hudson Bay, could face ‘reproductive failure’ due to an extended ice-free season within the next decade. However, because they based their model on seriously out-of-date information from Western Hudson Bay, the results generated do not reflect the fact that the ice-free season in western and southern Hudson Bay has been much shorter than it was in the early 2000s (and more like the 1980s for the last three years) and that conditions for Hudson Bay polar bears have been excellent for the last six years at least. The length of the ice-free season for Southern Hudson Bay polar bears is usually very similar to Western Hudson Bay.
Given recent conditions, including the late breakup of sea ice this summer in Western Hudson Bay and early freezeup for the last three years, reproductive failure for Southern Hudson Bay bears within 10 years seems very unlikely. An honest revision of the dates that polar bears move onshore and offshore (at sea ice breakup in summer and freeze-up in fall) for Western Hudson Bay (e.g. as presented by Castro de la Guardia and colleagues in 2017) will almost certainly show that the length of time that Hudson Bay polar bears spend onshore in summer has shortened since 2007. This change was not anticipated and polar bear experts seem to be struggling to come to terms with it, when they are not denying it is happening.
Conclusion
The lack of a negative response of polar bear populations to the abrupt decline of summer sea ice in 2012 – the lowest since 1979 – suggests that this year’s ‘second-lowest’ extent will be similarly non-eventful as far as polar bears are concerned. This ‘second-lowest’ extent is indeed part of a continued long-term decline since 1979 but it also maintains the continued pattern of sea ice coverage stalled at about 3-5 mkm2 since 2007, as the graph below from NSIDC shows, although CO2 levels have continued to rise.
This 3-5 mkm2 ice extent in September is the disaster that polar bear experts anticipated in 2007 and which they wrongly claimed would cause 2/3 of the world’s polar bears to disappear. In fact, contrary to all predictions, polar bears have been thriving in recent years despite reduced summer ice in the Barents, Chukchi and Southern Beaufort Seas, and because of unexpectedly short ice-free seasons in Hudson Bay and less multiyear ice in the Canadian Arctic Archipelago.

References
ACIA 2005. Arctic Climate Impact Assessment: Scientific Report. Cambridge University Press. See their graphics package of sea ice projections here.
Aars, J. 2018. Population changes in polar bears: protected, but quickly losing habitat. Fram Forum Newsletter 2018. Fram Centre, Tromso. Download pdf here (32 mb).
Aars, J., Marques,T.A, Lone, K., Anderson, M., Wiig, Ø., Fløystad, I.M.B., Hagen, S.B. and Buckland, S.T. 2017. The number and distribution of polar bears in the western Barents Sea. Polar Research 36:1. 1374125. doi:10.1080/17518369.2017.1374125
AC SWG 2018. Chukchi-Alaska polar bear population demographic parameter estimation. Eric Regehr, Scientific Working Group (SWG. Report of the Proceedings of the 10th meeting of the Russian-American Commission on Polar Bears, 27-28 July 2018), pg. 5. Published 30 July 2018. US Fish and Wildlife Service. https://www.fws.gov/alaska/fisheries/mmm/polarbear/bilateral.htm pdf here.
Adam, R., Bryan, A., Quakenbush, L., Crawford, J., and Biderman, L.2019. Bearded seal productivity in Alaska using harvest-based monitoring, 1975-2016. Poster presentation, Alaska Marine Science Symposium, 28 January-1 February.
Amstrup, S.C., Marcot, B.G. & Douglas, D.C. 2007. Forecasting the rangewide status of polar bears at selected times in the 21st century. US Geological Survey. Reston, VA. Pdf here
Andersen, M., Derocher, A.E., Wiig, Ø. and Aars, J. 2012. Polar bear (Ursus maritimus) maternity den distribution in Svalbard, Norway. Polar Biology 35:499-508.
Castro de la Guardia, L., Myers, P.G., Derocher, A.E., Lunn, N.J., Terwisscha van Scheltinga, A.D. 2017. Sea ice cycle in western Hudson Bay, Canada, from a polar bear perspective. Marine Ecology Progress Series 564: 225–233. http://www.int-res.com/abstracts/meps/v564/p225-233/
Crawford, J. and Quakenbush, L. 2013. Ringed seals and climate change: early predictions versus recent observations in Alaska. Oral presentation by Justin Crawfort, 28th Lowell Wakefield Fisheries Symposium, March 26-29. Anchorage, AK. Abstract below, find pdf here:http://seagrant.uaf.edu/conferences/2013/wakefield-arctic-ecosystems/program.php
Crawford, J.A., Quakenbush, L.T. and Citta, J.J. 2015. A comparison of ringed and bearded seal diet, condition and productivity between historical (1975–1984) and recent (2003–2012) periods in the Alaskan Bering and Chukchi seas. Progress in Oceanography 136:133-150.
Crockford, S.J. 2015. The Arctic Fallacy: Sea Ice Stability and the Polar Bear. Global Warming Policy Foundation Briefing Paper 16. London. Pdf here. Available at http://www.thegwpf.org/susan-crockford-the-arctic-fallacy-2/
Crockford, S.J. 2019. The Polar Bear Catastrophe That Never Happened. Global Warming Policy Foundation, London. Available in paperback and ebook formats.
Crockford, S.J. 2020. State of the Polar Bear Report 2019. Global Warming Policy Foundation Report 39, London. pdf here.
Derocher, A.E., Wiig, Ø., and Andersen, M. 2002. Diet composition of polar bears in Svalbard and the western Barents Sea. Polar Biology 25 (6): 448-452. http://link.springer.com/article/10.1007/s00300-002-0364-0
Durner, G.M., Douglas, D.C., Nielson, R.M., Amstrup, S.C., McDonald, T.L., et al. 2009. Predicting 21st-century polar bear habitat distribution from global climate models. Ecology Monographs 79: 25–58.
Hausfather, Z. and Peters, G.P. 2020. Emissions – the ‘business as usual’ story is misleading [“Stop using the worst-case scenario for climate warming as the most likely outcome — more-realistic baselines make for better policy”]. Nature 577: 618-620.
Lippold, A., Bourgeon, S., Aars, J., Andersen, M., Polder, A., Lyche, J.L., Bytingsvik, J., Jenssen, B.M., Derocher, A.E., Welker, J.M. and Routti, H. 2019. Temporal trends of persistent organic pollutants in Barents Sea polar bears (Ursus maritimus) in relation to changes in feeding habits and body condition. Environmental Science and Technology 53(2):984-995.
Molnar, P.K., Derocher, A.E., Theimann, G., and Lewis, M.A. 2010. Predicting survival, reproduction and abundance of polar bears under climate change. Biological Conservation 143:1612-1622.
Regehr, E.V., Laidre, K.L, Akçakaya, H.R., Amstrup, S.C., Atwood, T.C., Lunn, N.J., Obbard, M., Stern, H., Thiemann, G.W., & Wiig, Ø. 2016. Conservation status of polar bears (Ursus maritimus) in relation to projected sea-ice declines. Biology Letters 12: 20160556. http://rsbl.royalsocietypublishing.org/content/12/12/20160556 Supplementary data here.
Regehr, E.V., Hostetter, N.J., Wilson, R.R., Rode, K.D., St. Martin, M., Converse, S.J. 2018. Integrated population modeling provides the first empirical estimates of vital rates and abundance for polar bears in the Chukchi Sea. Scientific Reports 8 (1) DOI: 10.1038/s41598-018-34824-7 https://www.nature.com/articles/s41598-018-34824-7
Rode, K.D., Douglas, D., Durner, G., Derocher, A.E., Thiemann, G.W., and Budge, S. 2013. Variation in the response of an Arctic top predator experiencing habitat loss: feeding and reproductive ecology of two polar bear populations. Oral presentation by Karyn Rode, 28th Lowell Wakefield Fisheries Symposium, March 26-29. Anchorage, AK.
Rode, K.D., Regehr, E.V., Douglas, D., Durner, G., Derocher, A.E., Thiemann, G.W., and Budge, S. 2014. Variation in the response of an Arctic top predator experiencing habitat loss: feeding and reproductive ecology of two polar bear populations. Global Change Biology 20(1):76-88. http://onlinelibrary.wiley.com/doi/10.1111/gcb.12339/abstract
Rode, K. D., R. R. Wilson, D. C. Douglas, V. Muhlenbruch, T.C. Atwood, E. V. Regehr, E.S. Richardson, N.W. Pilfold, A.E. Derocher, G.M Durner, I. Stirling, S.C. Amstrup, M. S. Martin, A.M. Pagano, and K. Simac. 2018. Spring fasting behavior in a marine apex predator provides an index of ecosystem productivity. Global Change Biology http://onlinelibrary.wiley.com/doi/10.1111/gcb.13933/full
Stirling, I. and Øritsland, N. A. 1995. Relationships between estimates of ringed seal (Phoca hispida) and polar bear (Ursus maritimus) populations in the Canadian Arctic. Canadian Journal of Fisheries and Aquatic Sciences 52: 2594 – 2612. http://www.nrcresearchpress.com/doi/abs/10.1139/f95-849#.VNep0y5v_gU
SWG [Scientific Working Group to the Canada-Greenland Joint Commission on Polar Bear]. 2016. Re-Assessment of the Baffin Bay and Kane Basin Polar Bear Subpopulations: Final Report to the Canada-Greenland Joint Commission on Polar Bear. +636 pp. http://www.gov.nu.ca/documents-publications/349
US Fish and Wildlife Service (USFWS). 2008. Determination of threatened status for the polar bear (Ursus maritimus) throughout its range. Federal Register 73: 28212-28303.
US Fish and Wildlife Service (USFWS). 2012. Threatened status for the Arctic, Okhotsk and Baltic subspecies of the ringed seal. Federal Register 77: 76706–76738.
US Fish and Wildlife Service (USFWS) 2013. Polar Bear News 2013-14. Newsletter of the US Fish & Wildlife Service, Anchorage, Alaska. Pdf here.
Wang, M. and Overland, J. E. 2012. A sea ice free summer Arctic within 30 years: An update from CMIP5 models. Geophysical Research Letters 39: L18501. doi:10.1029/2012GL052868
Wiig, Ø., Amstrup, S., Atwood, T., Laidre, K., Lunn, N., Obbard, M., et al. 2015. Ursus maritimus. The IUCN Red List of Threatened Species 2015: e.T22823A14871490. Available from http://www.iucnredlist.org/details/22823/0 [accessed Nov. 28, 2015]. See the supplement for population figures.
Sometimes I wonder if Maurice Strong was a double agent that propelled the quest for communism down a rediculous path that when reached to conclusion would leave a sour taste in the mouths of the people.
But then I get a grip and just be glad that noble corruption is always a foundation on sand. CO2 hysterics will eventually drift away.
It’s ok, the alarmists at the BBC have a new, larger, climate change poster boy, elephants!
https://www.bbc.co.uk/news/world-africa-54234396
I suspect in this case, that weather may actually be a factor.
There have been several prolonged attempts to assert global warming will harm various animals. Polar bears are most noteworthy. But Jim Steel recently pointed out american pikas on the Rocky and Sierra mountain chain high talus slopes. I noted Adelie penguins in Antarctic in essay No Bodies in ebook Blowing Smoke.
All have failed because these species have thrived. Their ecosystem habitat was either misunderstood or deliberately mis-stated in all three cases.
we should send a bunch of climate change advocates up there for a very close examination to see if the polar bears are hungry
And if they don’t come back it means the bears are even more endangered and more studies need to be done by sending more “experts”.
Hey, mom, what’s for dinner?
Looks like some of the “researchers”can’t bear to bare their bear facts…
😉
Great just stick to climate stuff dont touch coronaviruses my advice you are a meteorolologist like my father was because you dont know anything about viruses, I however have four degrees inBiology and do know about viruses. As Willis said Lockdowns Dont work they make it worse Keep safe
Yes, the record shows that the epidemiology of the virus is the same across jurisdictions. Only in areas where they implement “social” distancing, masks, and perhaps external factors, are there recurring spikes after the contagion has reached suppression in the population. Also, there is evidence that the primary transmission mode is contact (e.g. fecal), not aerosol or droplet.
The primary transmission mode for coronavirus information is fecal : the govt. and their propagandists in MSM have been feeding us shyte for the last six months !!
” ….Great just stick to climate stuff dont touch coronaviruses my advice you are a meteorolologist like my father was because you dont know anything about viruses …”
Dr Crockford is a meteorologist ??
Clearly Doc Crockford knows more about virusi than Eliza knows about bears and meteorology combined.
So if viruses were bears, and you lock down 90% of the population so that they can’t go out in the snow where the bears are, wouldn’t 90% fewer people be eaten by bears ? Like approximately ? Or my expectations just absurd cuz there is only one bear out there and he only eats like one person a month regardless ? Just askin’. /sarc
The problem I have seen on the science blogs is that the people who do ‘know’ about viruses show a rather poor understanding of everything else.
Having had China’s Gift To The World unwrapped back earlier in the year many of these virus experts suddenly became very excited about finally being able to talk on subjects they had studied and started throwing in phrases like ‘text book solutions’, ‘no brainers’ and talking about lab environments.
There was one here in Oz who unironically stated that the entire Australian manufacturing capacity needed to be switched to making masks and respirators. Ignoring the fact that manufacturing doesn’t function that way, does anyone remember when respirators were still considered vital or even recommended for treatment?
Text books are fine, but people need to remember that text book examples are designed to demonstrate learning points. They are rarely the entire picture and any factor that detracts from the educational point being made is usually omitted for clarity.
The Real World omits nothing, which is why in the real world you deal in terms of ‘As Far As Is Reasonably Practical’ and endeavour to ensure that any ‘solution’ to a problem doesn’t cause complications worse than the original fault.
Also, Polar Bears… what were we talking about? 🙂
I’m trying to figure out how you switch a steel mill over to start making masks or ventilators.
If you know so much about virusi then you know it has to pass through the population, diminishing with each iteration, until it burns itself out and the population achieves the dreaded Herd Immunity. Only those at highest risk of death from said virusi should be quarantined, not the entire population. What governments have done is destructive and stupid, which is precisely why Lefists/Democrats/Progressives are pushing so hard to continue doing it.
Oh, and Polar Bears are doing just fine, thanks a bunch to their ability to ADAPT to changing conditions from season to season.
“In fact, no evidence exists that the especially low summer sea ice levels in 2012 negatively impacted polar bears”
There is hidden food. The food is in the ocean. The ocean has 97% of the heat and 99% of the hidden food.
It’s black food. You can’t see it even with a telescope. Black food is invisible to light or any measurement we know of. Only bears can find black food. Black food makes up most of the food chain.
The theory is safe.
Black Food Matters ! 😉
A quick web search for seasonally ice free arctic holocene turns up evidence of just that. example As far as I can tell, none of the alarmists have adequately dealt with that tiny technical detail.
The Arctic ocean has often been seasonally ice free previously in the last 10,000 years. Why did that not cause extinction of the Polar Bears?
We need a serious revamp of PhD training. Time after time, scientists show an astounding lack of breadth of knowledge, even of fields closely related to their own. Earning a PhD is a hefty challenge. In fact there seem to be a lot more tears involved than when I was a pup. The joke is that you learn more and more about less and less until eventually you know everything about nothing. That’s probably not a good thing. That’s demonstrated by a whole bunch of Polar Bear PhDs seeming not to be curious about previous ice conditions during this interglacial.
Something just occurred to me. If the ice is heavy, seals should have a harder time maintaining breathing holes. You’d think that would reduce the number of seals available to feed Polar Bears. Hmmm …
“We need a serious revamp of PhD training.”
Getting a PhD is the academic equivalent of a fraternity hazing. Candidates live in deathly fear of doing or saying something that might directly or indirectly offend some member of their committee. That mentality tends to persist even after getting tenure (which process is more of the same).
Current Arctic sea ice levels are in the top 5-10% of the Holocene.
The LIA and the late 1970s was a period of anomalous high extent
Sea ice extents have been FAR LOWER for most of the last 10,000 years, and the polar bears are still with us.
Its too bad that tenure is all that matters in “climate science”.
Ice extent has decreased since 1980, no one seriously disputes that. All part of warming up since the LIA. But from this came pure conjecture that less ice means less polar bears.
Because its fashionable i suppose.
A lot of counter-intuitive stuff going on back then but it seems impossible for people to simply admit they were wrong.
Less ice=less polar bears is proven wrong.
The bears are fat, happy and increasing (just like people) because less ice is better for their prey hence better for them.
If i post this link, all i will get is comments on how Crockford isn’t a Polar bear scientist, i guess she didn’t get her badge or button for that.
Is it because she is a womanand the “scientists” she disputes are men?
Certainly our PM Trudeau has demonstrated the ability to bully women who dare to stand up to him, seems like these polar bear guys are the same.
But i guess now the prediction is 2100 for polar bear extinction, safely beyond their lifetimes.
Crisis averted.
I guess that if the Polar Bears survived record low sea ice in 2012 they should be able to survive this low ice episode. How much longer before we see pictures of “starving” Polar Bears popping up in the media?
Sea ice has been FAR lower than current extent for most of the last 10,000 years
There are still polar bears.
But he is right about the propaganda shots showing up in all the hair-on-fire algore publications. They’ll find some bear that broke a paw in an encounter with a walrus and hasn’t been able to hunt and claim it as a victim of global warming to place next to their hair-on-fire proclamations that sea ice extent is “worse than we thought”!
So, essentially, the steady growth in the number of Polar Bears will continue to not go away anytime soon? That about sum it up? How will this continued growth in Polar Bear population effect the price of tags for taking of said Polar Bears? Just asking for a friend. 😉
Don’t have much use for polar bears or any other bear. Had some bear salami once. Too greasy.
Current levels probably around same as in the 1940s
Recovery from the 1979 anomalously high extent, which made hunting difficult for PBs, seems to have stalled.
Let’s hope it doesn’t grow too much during the next AMO down cycle.
So sea ice in the arctic in September has decreased by 82,000 km^2 per year since 1979?
That is astounding.
So gone in 50 years on the current trajectory then?
ROFLMAO.. been said many times before..
Still about 4 Wadhams.. LOTS of Arctic sea ice. Far more than for most of the Holocene
You do know that the “anomaly” was the extreme high extent during the LIA and around 1979… don’t you ?
Comparing millennial scale variability to the last fifty years? That seems like an awfully stupid thing to do- even for the readers of this site.
Seems like the decrease in ice cover is pretty unprecedented over the last century and a half.
Walsh & Chapman 2001, Annals of Glaciology, 33, 444-448.
Walsh, J. E., Fetterer, F., Stewart, J. S. and Chapman, W. L. (2016) A database for depicting Arctic sea ice variations back to 1850. Geographical Review, doi:10.1111/j.1931-0846.2016.12195.x
DENYING the actual climate history seems like a pretty stupid thing to do.
1979 was an extreme high anomaly in Arctic sea ice, up there with the LIA.
The LIA was the COLDEST period in 10,000 years
Thank goodness there has been a slight recovery toward more normal levels since then.
Current levels are FAR above the Holocene norm.. GET OVER IT !
IGNORE the facts as much as you like, it only makes you look like more of a dumb climate change denier.
Reading this it’s easy to visualize the veins bulging in your forehead and the spittle frothing at your mouth. But but the LIA! But but the Holocene! Not presenting any data or peer reviewed publications for your ridiculous assertions and school boy misunderstandings of time scale.
If you had actually bothered to read the peer reviewed literature you’d sea that arctic sea ice has fluctuated little over the last 150 years, until quite recently where it has trended downwards spectacularly over a very short time frame.
DENIAL of climate history is the ONLY way you idiots can make a story.
“that arctic sea ice has fluctuated little over the last 150 years”
and now the LIES as well..
And still sticking to the COLDEST PERIOD in 10,000 years as a starting point.
DUMB and/or just plain scientifically IGNORANT. !
Perhaps you should start at a time when ice was 1km thick over Canada, and complain about loss of ice since then. !
Current levels of Arctic sea ice are FAR higher than for most of the last 10,000 years
Face the FACTS and stop your mindless and deliberate climate change denial.
” But since 1940 there has been a distinct drop in average global temperature….
Sea ice has returned to Iceland’s coast after more than 40 years of virtual absence.”
Steve45 … emulating griff forlies, misinformation, CLIMATE CHANGE DENIAL….
….. and just plain IGNORANCE.
Can you cure yourself by educating yourself….
…. or are you stuck in the brain-washed zero information AGW miasma like griff is. !
Freddie, Freddie, Freddie
If you are not going to point to peer reviewed sources, no one is going to take you seriously are they?
Like the seas off Iceland, the ice in my pond has also increased over the last century, but no one cares do they? What’s important is the whole of the arctic.
Now take a deep breath, your daily medication, and get back to us with some proper peer reviewed research, not silly little graphs you’ve photoshopped.
Poor little stevey.. DENIAL of climate history
DUMB. ! but the only way you can support your IGNORANCE.
So sad that you have shown you are either not capable or totally unwilling to face reality
Current levels of sea ice are far higher than for most of the last 10,000 years
Face the facts or just be a mindless climate change denier.
You are making a monumental FOOL of yourself.
Poor griff II
Obviously destined to remain in deep climate change DENIAL.
Sea ice extents have been FAR LOWER for most of the last 10,000 years,
Stick with your IGNORANCE, griff II…
.. its the only way you can defend your brain-washed AGW miasma.
LIA was a COLD extreme anomaly
Real questions is what sort of twisted, whacked-out mind thinks that this was normal or in any way desirable. !
Bet you live somewhere that isn’t frozen solid all year
From your willful ignorance, in an air-conditioned unit in some inner-city urban heat island in a temperature warm climate. right.! Not Siberia…
For someone who complains about others not producing data, I don’t see Steve producing any. Just proclaiming that only the studies that he agrees with are authoritative.
What’s funny is that Steve actually believes that citing non-existent studies trumps actual data.
So Freddie, shall I take it that you can’t post any peer reviewed research backing up your statements? I’m guessing that’s a no. Doing an Abraham Simpson and yelling at the clouds in a spittle fueled rage isn’t going to make you any more credible.
Here’s mine (again):
Walsh & Chapman 2001, Annals of Glaciology, 33, 444-448.
Walsh, J. E., Fetterer, F., Stewart, J. S. and Chapman, W. L. (2016) A database for depicting Arctic sea ice variations back to 1850. Geographical Review, doi:10.1111/j.1931-0846.2016.12195.x
Still starting at the coldest period in 10,000 years
Why are you doubling down on being DUMB !
Why are you DENYING anything during the previous 9000 or so years
Sea ice extents have been FAR LOWER for most of the last 10,000 years
Get over it. !
Stick with your IGNORANCE and CLIMATE CHANGE DENIAL….. griff II…
… its all you have.
What griff-II is saying is that Arctic Sea Ice is not driven by Arctic temperatures.
Thus he DESTROYS the whole Arctic sea ice meme.
Well done , bozo ! 🙂
Great to have you on the climate realist side. 🙂
NoPol temps this century..
Only warming was from 2015/16 El Nino
and from 1980-1995
No warming at all.
A step up around the 1998 El Nino.
So all El Nino.. 100% natural warming.
Still not as warm as MWP and 8000-9000 years before that.
Its decidedly CHILLY up there in the Arctic.!!
And there’s STILL far more sea ice than for MOST of the last 10,000 years.
“you can’t post any peer reviewed research backing up your statements”
The dumber you get….. so DUMB.
All three graphs are from peer-review, as is the Alekseev graph.
Data too difficult for you to comprehend ????
Stop your scientifically illiterate climate change denial.
So hilariously DUMB that you think the LIA was a desirable or normal level of sea ice.
Not just dumb or dumber.. DUMBEST !!!
Quite HILARIOUS how griff cherry-picks one of the extreme high anomalies in sea ice as his starting point…
And you cherry-pick the end of the LIA as the starting point……… just DUMB !!
Both of you trying to PRETEND that those periods were “normal”… they WEREN’T
Those periods were the anomaly.. current is a slight recovery back towards Holocene norms.
Nothing unusual about the rate of loss. Just as there was nothing unusual about the rate of gain from the 1950’s through the 1970’s.
Still want to know what griff II thinks might happen as the global temperature climbs naturally from the COLDEST period in 10,000 years
The Alekseev chart at least matched recorded Arctic temperatures and the DOE data…..
… which is more than can be said for other fabrications.
Next thing, these drones will be DENYING that the LIA even existed.
So DUMB !!
Fraud
“Next thing, these drones will be DENYING that the LIA even existed.”
You keep banging on about the LIA like it was some huge moment in climate history.
This graph from NOAA”S site shows it was notable, but not much more.
https://www.ncdc.noaa.gov/file/comparisons-simulated-and-reconstructed-northern-hemisphere-temperature-changes-v2jpg
So I’ll make the point again, saying todays warming is because we are coming out of an ice age just doesn’t cut it. It’s meaningless unless you can say what conditions prevail that are causing us to warm? So here’s another chance Fraud… why is today warmer than any time in the last 1,000 years (10,000 actually)? Is it the sun, the clouds, father Christmas maybe? What is it Fraud? Till you can answer that, you are just blowing wind.
Poor Slimo.. have to go into DENIAL mode again I see.
So funny.. I predicted the AGW scammers would try to DENY it even existed..
Where real data (except alarmist concoctions) shows that it most certainly did…
The CLOWN acts just keep on coming. 🙂
Iceland and Arctic temps
Oh…. Look how COLD it was before 1900, and look how COLD it was in the 1970’s
And not just the Arctic
“Till you can answer that,”
Noted that you are still in total evasion/distraction mode.. ie headless-chook routine..
STILL WAITING for empirical evidence of warming by atmospheric CO2
Don’t be a FAILURE all your pitiful life. !!
Fraud250
Haha more of your sharpie graphs. Gee I wonder where you learnt that. My graph is the real thing. NOAA no less. State of the art, quaity. What your Trump government pays the best scientists in the US to produce. The fact you you don’t like it because it doesn’t fit your climate fairy tale is your problem. Keep howling at the moon Fraud.
Poor slimo.
STILL thinking the world started in 1940, or perhaps 1850
STILL unable to produce any evidence of anything.
NOAA graphs..e the instigators of the scam.. the high priests.
The data torturers supreme.
They will try anything to DENY that the LIA , MWP etc existed because they know the facts destroy their lies and fabrication.
FACTS say otherwise… LIA was an anomalously cold period.
Current sea ice levels are STILL in the top 5-10% of the last 10,000 years
DENIAL is all you have, poor little sad-sack…
STILL WAITING for empirical evidence of warming by atmospheric CO2
Don’t be a FAILURE all your pitiful life. !!
Even the IPCC reports ADMIT that it was an anomalously cold period
Do try to keep up
They then tried every piece of data malfeaces to try to get rid of it. possible
“This graph from NOAA”S site”
where they put one purpose designed model against another purpose-designed model using the same biases and aim of flattening out reality (like the they did with the 1940s peak temperatures),..
… and then pretend they match. well duh ! That was the aim of the fabrications.
Be pretty DUMB if they didn’t match, now wouldn’t it.
Notice their is absolutely no methodology to go with the graph… So funny.
But what is even funnier than the fact that you so DUMB that you actually fell for it.
Measurement based REAL data tells the REALITY.
https://lh3.googleusercontent.com/proxy/vS_p1MkGv6j2Fb4bMM3DEdZex5zb31_ioEQHtJD7uiyIIKWy1_pPEoWCr76MpWf9kEi6nPrkbhmHtNcTeLPLI3LgF2viyGuzTRw2Rw
Oh look, nearly all the last 10,000 years has been warmer than now.
I’d say that explains why current Arctic sea ice extent is still SO FAR ABOVE the Holocene norm.
The fact that reports are being kept away from the public for so long is very telling. They obviously contain good news otherwise it would have been splashed about all over the media.
What a sinister world we live in that scientists are willing to suppress data like this, how do they sleep at night?
“This behavioural response to changing sea ice conditions is normal for polar bears and is a critical feature of their success in an ever-changing Arctic habitat (Crockford 2015). ”
Thank you for the link to this very important part of the puzzle, very thoroughly explained.
I’m sorry, but this just can’t be true.
The ice edge has retreated very far from land on the Russian and Atlantic sides of the ice… north of 85N in places.
Either the bears are on land and seeking alternate food sources and struggling or they are way. way out on the ice and far from winter denning sites. An late refreeze seems inevitable.
4th lowest ice 2016, third lowest ice 2019, 2nd lowest ice 2020. see where this is going?
There’s that STUPIDLY SMALL period of sea ice, down from the 1979 extreme high (still longer in years than griff’s IQ” though)
And the continued CLIMATE CHANGE DENIAL, or just plain IGNORANCE, of not knowing that current levels are in the top 5-10% of the last 10,000 years
Sea ice has been at FAR LOWER EXTENT for MOST of the Holocene..
There are still polar bears.
Try not to be a WILLFULLY IGNORANT clown all your life , griff.
Well- no psychopathology there!
Still not posting any links to the peer reviewed literature? Is it because no one of any importance agrees with your nonsensical ravings?
Love the use of capitals by the way. It *definitely* makes your case more convincing.
So , still nothing in the way of SCIENCE from little griffool-II
Poor cretin cannot even read basic graphs from peer-reviewed papers,
Or comprehend actual real data..
Brain-dead , for sure.
In complete DENIAL of climate change
Or is is just WILLFUL IGNORANCE and utter stupidity.
Willfully ignorant is all it has.
…and the Bears are thriving. See where that got you?
Griffo, hi
When a periodic osculation reaches its minimum than then the 1st, 2nd, 3rd .. & n-th lowest values will be located in the vicinity of the minimum. Not clear enough for you, well see my comment further bellow at 4:58 am.
Griffo, learning is a life long process, it’s never late to start.
I’m sorry you have zero credibility here, either make a counter argument with references or you will be shown as the ridiculous uneducated cretin that you most certainly are.
I don’t like insults, but you do nothing to further your cause by continually showing your utter ignorance on any subject that you happen to trip over.
What’s not true?
” In other words, as far as can be determined, the low summer ice levels of 2012 in the Barents Sea had zero impact on the health or survival of these bears in this region. There is therefore no reason to suggest this year would be any different, especially since the previous ‘second lowest’ summer sea ice year of 2016 also produced no evidence of harm to Svalbard area bears.”
If you have evidence to the contrary….. show us.
Sea ice will probably expand at a rate of about 35,000 Km² (13,500 Mi²) per day towards the end of September, which will roughly be the same as it was in 1989.
Last October (2019) Sea ice extent around Svalbard had returned to the 1981 to 2010 median position for that time of year.
Please get help for your masochism, it’s not doing you any favours.
How come the population of Polar Bears REMAINS high for the last 14 years, despite the late summer ice cover reductions?
How come many are well fed, despite the low summer sea ice cover?
How come you keep ignoring this fact and also a couple other facts, such as Polar Bears survived long periods of time of little to no summer ice cover in the early part of the interglacial, or that there has been NO further in sea ice reduction trend since 2007.
You are going to ignore the replies to your typical drive bye postings., because you KNOW you can’t address the reasonable refutations of your ideology you keep promoting.
How come many are well fed, despite the low summer sea ice cover?
“despite” should read.. because of…..
And the level is only “low” compared to the extremes of the late 1970s and the LIA.
Can we please stop feeding the LIE that current sea ice extent is “low”….
…. when its actually way above the Holocene norm.
Anything that goes against what the griff collective wants to believe, just simply can’t be true.
Obviously, what griff knows about polar bears is both miniscule, and wrong.
My first visit here. I’m impressed with how many intelligent and well educated people there are in the comments. Ditto for the articles as well. What a refreshing change from the usual things I run into. I’ll definitely be a regular here.
Welcome.
Is there anyone on WUWT who actually finished their University degree? (Anthony certainly didn’t)
MarkW, how ’bout you? Any relevant qualifications to speak of, or just lots of hyperbole with nothing backing it up?
Many here would swipe your high-school drop-out social science nonsense.
You certainly have not got past junior high school science..
…. your mind is too closed to have done that.
You are devoid of rational scientific thought, griff-II
You want to play the “degrees” game…… you will lose.
” just lots of hyperbole with nothing backing it up?”
griff-II continues to huff and puff…
The display of arrogant ignorance is HILARIOUS. ! 🙂
Let’s see how you go with basic science, griffool-II
1. Produce empirical evidence of warming by atmospheric CO2 ?
2. In what way has the global climate changed in the last 50 years that can SCIENTIFICALLY be proven to be of human cause.?
( note, models and “feelings” and baseless rhetoric…. are not science.)
Steve-IQ-45
In my case
1. Biology with Oceanography, BSc (2i) Southampton University, 1986
2. Applied Fish Biology, MSc (honours), Plymouth Polytechnic, 1987
3. Radiations in Industry, the Environment and Medicine, St Andrews University, Scotland, MSc (honours), 1990
4. PhD, Bristol University, Tyndall Physics Laboratory, “Biokinetics and Radiation Dosimetry of 210Pb and 210 Po in human tissues”, 1998.
What about yours?
2nd class honours? A polytechnic? Not exactly Oxbridge is it? Did it take you 8 years to submit? A quick search of your publication record suggests you’ve been a bit of a failure.
Poor little stevie, just another a zero academic and zero knowledge nonce. !
The Ice extent graph (at the article’s end) and in particular its long term trend line it gives misleading impression while the short term trend lines are of little or no consequence.
Adding Area data and presenting values as percentiles it can be seen that there is about 20-25% ‘oscillation’ around 40 years average.
http://www.vukcevic.co.uk/ArcticIce.htm
The polynomial trend line suggest that the Arctic Ice Extent and Area are most likely following a natural oscillation with (40 years being about a half a cycle- max to min) with periodicity of about 80 years, as it is indeed case with the Arctic’s temperature (see the inset).
Vuk, There are traces of the AMO type 60-80 year cycle all through the LIA cold anomaly, as marked here in the Icelandic sea ice record.
You can also see the LIA clearly, then a drop for 50 or so years then the peak at the end of the 1970’s, nearly as high as those of the LIA.
That 1979 point that AGW scammers so like to start at, really was an extreme high extent anomaly.
Hmm…. Today is the Autumn Equinox so things should start getting colder and the extend of ice should start to grow. I wonder how much the continental scale smoke plume will affect the coming winter temps. It covers most of North America and a big chunk of the Atlantic. Here’s a site that shows the extent of the plume….
https://fire.airnow.gov/#
It started some days ago, mimimum was on 9/13
Engineers deal with facts and I provide a few:
When I left grad school, long ago, the US provided about 90% of its electricity from burning carbon, mostly coal, a little residual oil (almost tar) and gas. The operating plants today date back to the Korea war and are worn out. Today’s fleet of nukes are also far beyond their design life. Together they support roughly 1/2 of the grid. Both are filled with relays; transistors, chips and the internet came later. The experts who designed, manufactured and built these complex designs lie in graves, our engineering colleges dropped the course work decades ago. Their graduates could not find a job. Most of our heavy equipment now comes for China; we no longer have that capability.
The facts from China are hard to believe, depending on the source. But she is/has built some 700 – 1600 very large coal plants in recent years and burns four to ten times the coal we burn. The ratio will increase for a long time as their well made plants will run, like ours, for generations. Our CO2 emissions are trivial compared to Asia’s. She also has/is building 50 large nukes, cheaper, faster and more advanced than anything we ever made.
If we could run an extension cord to China, we would have no power plants except the green ones which cost too much and do not work well. They can not, never will, due to inherent technical weaknesses.
I do not worry about polar bears or any other climate change problem. I am certain we will lose a grid, for years. There are three big ones in the contiguous states. Without electricity, we will experience a die-off far worse than this pandemic.
U.S. capacity additions and retirements by year…….
https://www.eia.gov/electricity/annual/html/epa_04_05.html
Oops, wrong place
With arctic sea ice it’s always ” Since 1979″.
As if nothing happened before 1979. The year 1979 was about the coldest year in the last century. At the time, climate scientists were speculating that the Earth was entering into another ice age. So when you say “since 1979” what you are really saying is “since the coldest period in the last 100 years”.
It was just as warm in the 1930’s as it is today and the arctic sea ice was pretty thin then, too.
There’s nothing unprecedented going on in the artic today.