Reposted from Dr Roy Spencer’s blog
July 10th, 2020 by Roy W. Spencer, Ph. D.
Overview: Death certificate data, corrected for recent under-reporting, reveals a 10-20% decrease in weekly deaths compared to seasonal norms commencing in early March, 2020. This date coincides with the widespread closing of public schools. It is hypothesized that a decrease in traffic accidents is the most likely explanation for the decrease, a conclusion which would be confirmed from detailed analysis of the death certificate data.
I had previously blogged on the caution needed when analyzing the death counts from death certificate data compiled by the CDC. The most recent weeks always have under-counted totals because it takes weeks to months for all of the death certificates to trickle in and be counted. Use of the data without knowing this can lead to false conclusions about recently declining death rates. I outlined a simple method for doing a first-order correction of the data based upon the number of additional death reports in each successive week, a method which I use here.
The CDC data report weekly deaths in three age groups: less than 18 years old (“child”), 18-64, and 65 on up. The data are updated weekly, and the data online extend back to week 40 in 2015. I examined the death totals for the under-18 year old group versus the totals for the 18-and-older (combined) group. (Only those recent reports that were labeled as “100% reporting” were used, but this notation is misleading because the CDC means 100% of the locations around the country had submitted reports, not that all of the reports were complete.)
I removed the average seasonal cycle (2016-2019) from the weekly totals, which show a seasonal ~11% peak in deaths in early January for adults, and a weaker ~6% peak in children’s deaths in early June (Fig. 1).
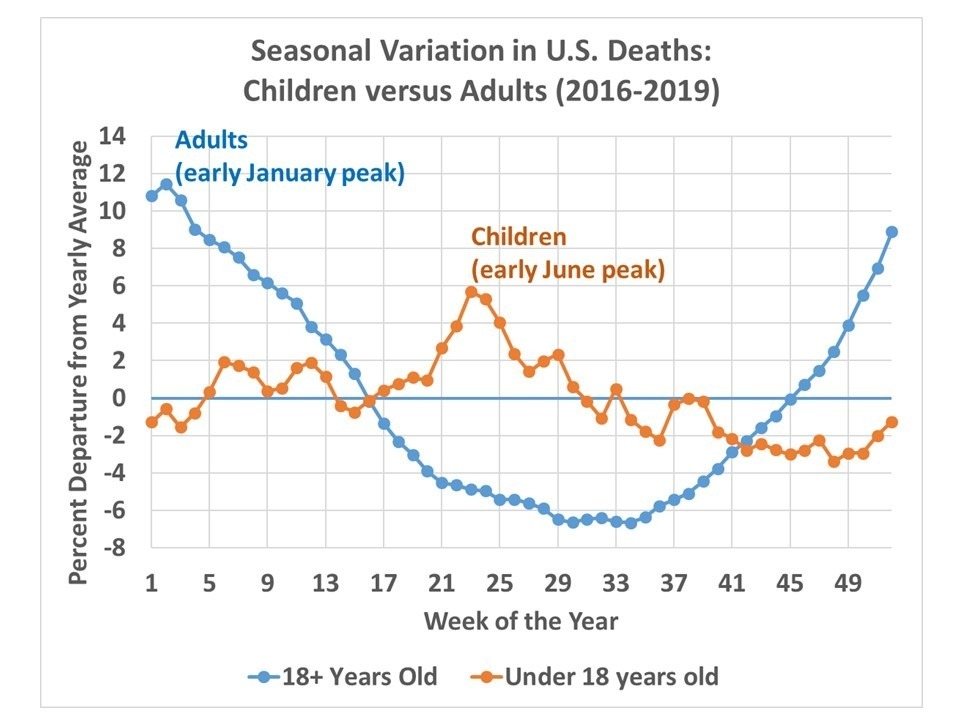


In order to corrected for under-reporting of recent deaths, I used the data from 4 successive weeks earlier this year to correct the most recent 52 weeks of data. Those 4 successive weeks yielded average week-to-week adjustments which accumulated to 16.5% under-reporting for 1 week previous to latest reported week; 10.4% at 2 weeks previous; 7.8% at 3 weeks; 6.4% at 4 weeks, dropping below 1% at 10 weeks previous, etc.
I then computed the weekly percent departures from the average seasonal cycle for the entire time period (since week 40 of 2015). The results (Fig. 2) show the unusually bad peak in seasonal flu and pneumonia deaths in 2017-18, which as expected results in a larger increase in adults that children.
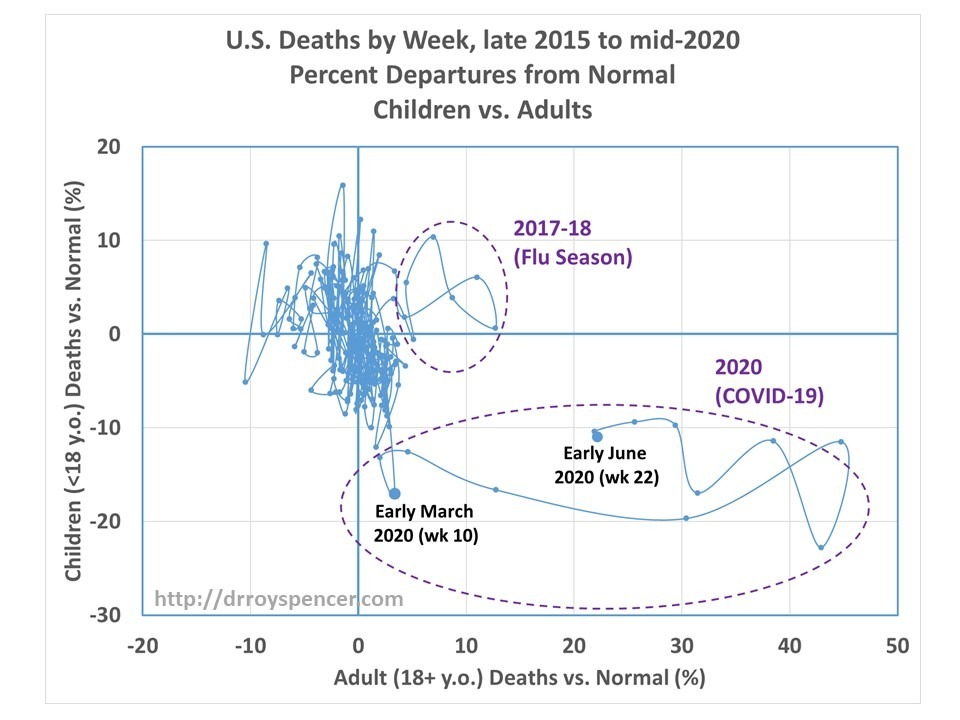
Note that there is a 10-20% decrease in child deaths beginning in early March, which is when most schools in the U.S closed down. Since the most frequent cause of death in the under-18 age group is auto accidents, it makes sense that the greatly reduced traffic activity during “lockdown” led to fewer deaths.
Of course, the same kind of reduction would be expected in the adult age category, but it is completely overwhelmed in Fig. 2 by the large increase due to COVID-19 deaths, which peaked in mid-April. Since there have been very few COVID-19 deaths in children we more clearly see the reduction in that age group. In absolute terms, a 15% reduction in childhood deaths equates to about 85 children per week.
Sorry, but Diagram 2 is incomprehensible to me.
It is weekly 2015 – mid2020 deaths reported as percent child variation deaths vs normal for that week plotted against percent adult variation deaths vs normal for that week. The consecutive weekly data points are linked by the (curved) line.
It seems very clear.
And that reply is incomprehensible to me.
Phew! Thought I was the only one. Watching that line loop back and double over itself defies any logic my brain can discern. I see that time is not one of the scales … so instead, time is represented by the line itself? New for me. 3-variables, eh?
Yes, ordinal time, not the cardinality with which y’all are familiar; buried in the hairball is FIRST data point at (X,Y), as time passes the data occupies the 2nd quadrant, and later the 3rd quadrant. We can see the FINAL data point clearly labeled wk22-2020.
Now imagine a complex phase space, as of a reactor’s safe operating envelope. At some point even the quantitative display of relations fail and one is reduced to an asterisk-diagram of labeled processes lines on un-scaled final condition plotted versus initial condition. Now try teaching Rx accident safety analysis.
Eighty five children saved each week saved because missed government mandated vaccination ‘s. Can someone find a link?
No, because there isn’t one.
There would be a link only if the reduction in children’s deaths were ONLY in the age cohort that got the vaccinations, or immediately after vaccination. Three, four, five years after, due to the introduction of myriad other factors and causes, the correlation would be too remote to tease out of the data.
The executive summary of what I said was said by Adam Gallon.
Being a chemical engineer, I am trying to conduct a material balance of the numbers in this post. I found a report from the NIH which noted changes in cause and mortality rate from 1900 to 1999 (1999.https://www.ncbi.nlm.nih.gov/books/NBK220806/). Table 2.1 showed deaths by accident for children 0 to 14 was 5834. The data was not grouped conveniently so I estimated the deaths for the 15-17 year-olds to give appro. 9900 deaths per year for 0-17. 85 children per week is 4420 deaths per year, or a reduction in deaths by accident of 45%. Auto accidents killed approximately 2000 children 14 or younger each year in 1999. I did not find the 15-18 slice but it will be larger as a percentage. So a very large drop in deaths due to auto accident, and also a significant drop in other fatal accidents for this age group could make the numbers balance. It will take about a year for the data for 2020 to be finalized to the point where we could make some firm conclusions. It is an interesting side effect of the pandemic – thanks for pointing it out.
Roy, you are definitely not a one-trick pony. Your elucidating excursions into interesting, non climate areas seems to be uncommon to climate science practitioners (e.g. hockey stick conjured in 1998 and arguing and suing people over it making it a whole lucrative career).
Your analysis showing a lower incidence of Covid among populations of malarial regions of the globe as a proxy indicator for the efficacy of HCQ/Q as a therapy was novel and convincing before the main backlash against Trump’s suggestion of it’s possible usefulness. The backlash by the left, including outlawing its use by several Blue State governors and interfering in physicians’ prescriptions by warnings to pharmacists undoubtedly resulted in many unnecessary deaths that I hope these nefarious folk have to pay for.
Unlikely any of them will pay. The states where they govern have people who if the Democrat party told them to bang their head against a wall they would, and then blame Trump for their headache. Why bother being upright when you can be a paragon of corruption with no political repercussions? The media won’t hold them accountable either because the majority of the media are card-carrying Democrats. They are the kind of people that would blame Trump if they were arrested driving drunk on the highway.
They never pay. They just get promoted to bigger and better SNAFUs.
In Victoria Australia road fatalities have dropped
https://www.tac.vic.gov.au/road-safety/statistics/lives-lost-year-to-date
I’m a civil engineer involved in road construction projects, and am often on the road before 7am.
My observation is less pedestrians and cars but people who are on the road are driving faster, hence the 26 to 40 year old group is not seeing a reduction in road deaths.
Will be interesting to see if that holds true.
The earlier graphs at euromomo were indicating a lower number of deaths for 0-14y but that didn’t survive the back reporting over time:
https://www.euromomo.eu/graphs-and-maps/
No age group is below average excess deaths. The most recent four weeks trend is now since months indicating that the rate might go down below the average but it never hold true over time. It always bounced back.
Only time will tell.
I suggest it is due to fewer anchor births that might result in infant and mother deaths.
The biggest drop in mortality is 0-1yr. So you are looking at schools? Is the CDC reporting SIDS rates for this period? Also, are they reporting the drop in well baby visits? I would definitely like to get to the bottom of this unless it has something to do with vaccines –because I believe in science. #VaccinesWork
The Wuhan “vaccine”, combined with Planned Parent in Democrat districts, reduced excess childhood mortality attributed to reproductive rites (i.e. selective-child) and Planned Parenthood (e.g. Mengele clinics).
I suggest the reported lower incidence of death in children may be due to more direct supervision of children by their parents during this period. The parent(s) are at home, taking care of the kids, rather than dropping them off at day care where supervision is not as focused and transmission of infectious diseases is more prevalent, along with the increased transportation risks to and from the day cares mentioned by Dr. Spencer.
NZ has reported that total population mortality is down , yes , down for the first half of the year (23 weeks) by 548 persons.
That’s -548 compared to the “projected” + tens of thousands.
Some of this reduction can be attributed to fewer road deaths; fewer hospital admissions for planned surgery ; fewer crowded doctors’ waiting rooms. All of those happened.
Still leaves a large % unexplained.
This is very interesting. Hospital and medical errors lead to around 700000 pr year in the US, so less hospital visits should save a lot of lives.
The leading cause of excess childhold mortality is the Progressive Church’s Pro-Choice religion, specifically reproductive rites (“wicked solution”). It’s possible that after excess deaths attributed to Wuhan virus under Planned Parent in Democrat districts, women avoided selective-child or “her Choice” at Planned Parenthood abortion chambers and Mengele clinics, acutely phobic that they too would be deemed unworthy of life or the second victim of abortion without medical services. Ironically, Her Choice (i.e. Gaia), and Democrat’s Choice, reduced excess deaths caused by her Choice.
Whatever policies this data suggests we should follow, I hope it maximises my particular demographic’s lifespan.
I like phase-space diagrams. It would be interesting to see CO2 v Temperature through time.
The 40%+ excess mortality rate is suspect.
We have seen the same in Europe, Euromomo website. In fact not just kids, but under 20s in general. Accident and emergency at hospitals have also been very quiet. People staying in means people not having accidents of all sorts, not just car.
Without comment on the subject matter, enjoy this high-dimensional phase space.
The Mathematical Impossibility of Compromise by Alan ‘Uncle Al’ Schwartz
https://www.mazepath.com/uncleal/comprom.htm
hmm- lock down killing thousands of children a day-
“A study published in the Lancet in May predicted that globally possibly an additional 6,000 children could die every day from preventable causes over the next six months as the response to COVID-19 continues to weaken health systems and disrupt routine services. Based on the worst of three scenarios in 118 low- and middle-income countries, the analysis estimates that an additional 1.2 million under-five deaths could occur in just six months due to reductions in routine health service coverage levels and an increase in child wasting.
These potential child deaths will be in addition to the 2.5 million children who already die before their 5th birthday every six months in the 118 countries included in the study. Some 56,700 more maternal deaths could also occur in just six months.
The study warns that in the least severe scenario, there would be a 9.8 per cent increase in under-five child deaths, or an estimated 1,400 a day, and an 8.3 per cent increase in maternal deaths.
In the worst-case scenario, where health interventions are reduced by around 45 per cent, there could be as much as a 44.7 per cent increase in under-five child deaths and a 38.6 per cent increase in maternal deaths per month. If routine health care is disrupted and access to food is decreased, the increase in child and maternal deaths will be devastating”