Guest post by Paul Dorian,
***A remarkable cold air outbreak on the way for Friday night and Saturday…powerful winds to 50 mph or so will accompany the cold blast…rain-changing-to-snow scenario for interior sections of the Mid-Atlantic/Northeast US…warmer pattern finally on the horizon***
Overview
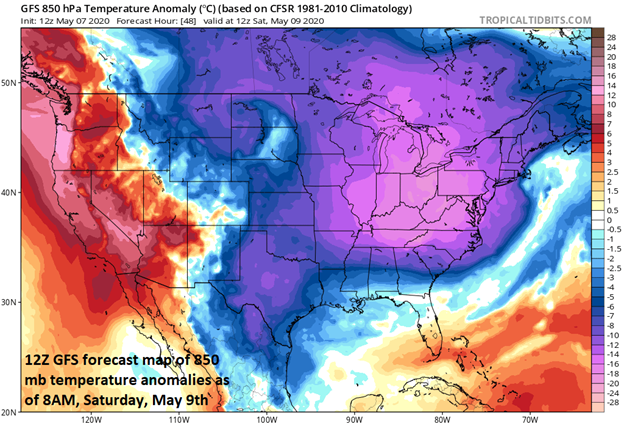
A remarkable cold air outbreak is coming to the northeastern quadrant of the nation for Friday night and Saturday and it will be accompanied by a rain-changing-to-snow event for many interior sections of the Mid-Atlantic/Northeast US. This cold blast is likely to result in some of the coldest daily temperatures ever recorded both at the surface and in the upper atmosphere and, in some cases, monthly temperature records may be set. In addition, some spots might see their latest measurable snowfall in the Friday night/Saturday time period. Some interesting notes…in Philadelphia, there has not been a temperature in the 30’s on May 9th or later in more than fifty years (1966) and it could happen on both Saturday (9th) and Sunday (10th) mornings. In Buffalo, the predicted temperature of -40°C this weekend at the 500 millibar level would shatter the previous record of -35.7°C for the entire month of May. In Baltimore, there has not been a measurable snowfall in the month of May since 1872 and the latest on record there is May 9th (1923).

In addition to the cold and potential snow, winds will become an important factor as well on Saturday with gusts past 50 mph on the table in the Mid-Atlantic/Northeast US and this will raise the chance for scattered power outages. Looking ahead, the overall weather pattern that has resulted in multiple cold air outbreaks from Canada into the central and eastern US during the past several weeks is likely to finally break down during the third week of May, but we’ll have to endure some pain before we get to those expected warmer-than-normal conditions.
Details
Generally speaking, there are two requirements for significantly colder-than-normal weather this time of year in the Mid-Atlantic region and they include thick cloud cover and low-level easterly winds which bring the still quite cold ocean air into the area from the western Atlantic. Indeed, temperatures peaked on Wednesday at 52 degrees for highs in Lancaster, PA which was the lowest high temperature ever recorded there and in State College, PA, the high of 43 degrees was the lowest in the month of May since 1989. These two examples were pretty representative of the chill experienced throughout the rest of the Mid-Atlantic region on Wednesday. The chill of mid-week will ease considerably on Thursday with the return of sunshine and a change of the low-level flow of air from east-to-west and high temperatures will be in the low-to-middle 60’s in many spots. The weather will become quite a bit more active later Friday as a strong cold front advances this way from the Upper Midwest and low pressure begin to develop over the Tennessee Valley.
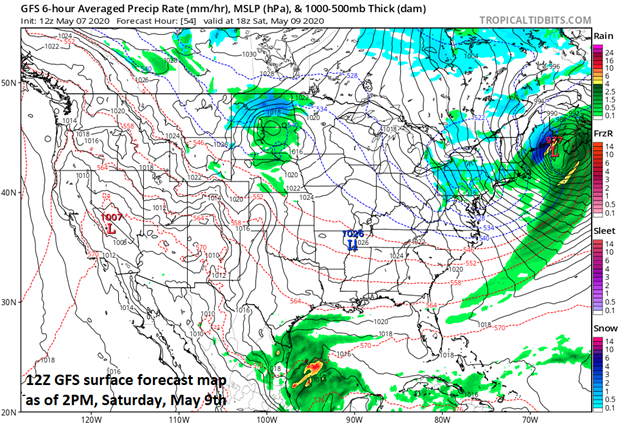
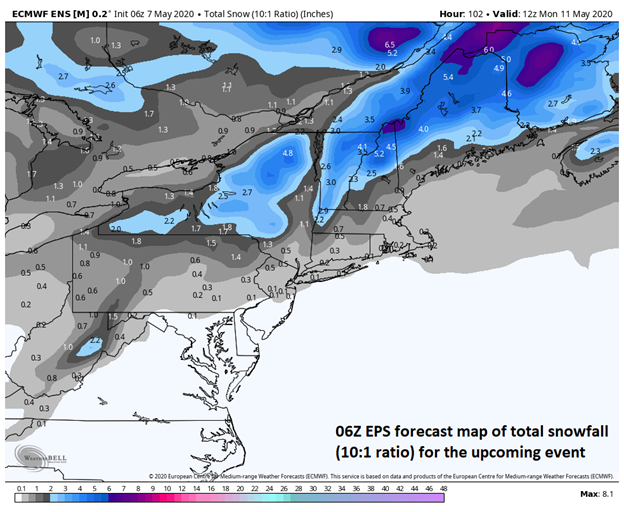
This low pressure system will push along the southeastward-advancing cold frontal boundary zone on Friday and rain is likely return to the Mid-Atlantic region during the afternoon and evening hours. As colder air wraps into the system on Friday night, the rain is likely to change to snow in a good part of the Mid-Atlantic/Northeast US; especially, across interior higher elevation locations of upstate PA, NY and New England where accumulations are possible. In fact, there can be a changeover from rain-to-snow showers later Friday night all the way into the suburban locations just to the north and west of Route I-95 in the DC-to-Philly-to-NYC corridor. This low pressure system will intensify dramatically by the time it reaches the Gulf of Maine on and a deepening pressure gradient will result in powerful winds to go along with the unusual cold. In fact, the low pressure reading expected for this storm on Saturday could rival the lowest ever recorded in Maine during the month of May. Winds on Saturday can gust to 50 mph or so in the Mid-Atlantic region/Northeast US raising the chance for scattered power outages.
By the late morning and mid-day hours on Saturday, an extremely anomalous upper-level low will slide over the Northeast US and the quite amazingly cold air aloft will create a very unstable environment. As a result, while the low pressure and frontal-induced precipitation may have ended, a re-development of snow showers is quite possible during the late morning and mid-day hours on Saturday in the unstable atmosphere and this could take place all the way into the I-95 corridor. Mother’s Day (Sunday) will get off to a very cold start for this time of year and it’ll stay quite a bit colder-than-normal; however, the afternoon will be much more bearable when compared to Saturday as the winds should be far less noticeable and there should be some sunshine although it might fade behind increasing clouds ahead of the next system.
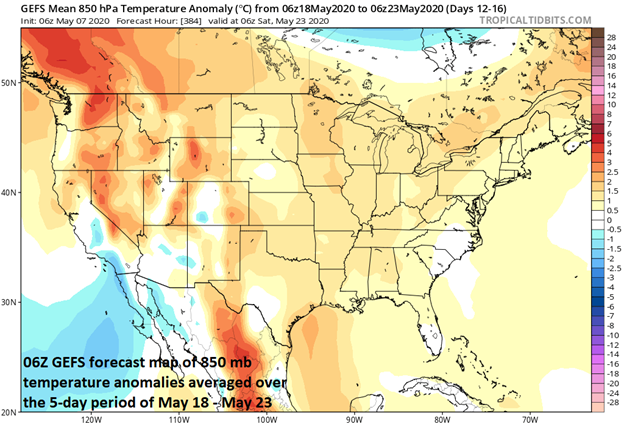
Looking ahead, the overall weather pattern that has resulted in cold air outbreaks from Canada into the central and eastern US during the past several weeks looks like it may finally break down during the third week of May. It should remain generally colder-than-normal for much of next week in the Mid-Atlantic/Northeast US, but then a transition to warmer weather looks likely once we get past the middle of the month. The temperature at Philadelphia has not reached the 80 degree mark yet this year and the latest that that has happened for the first time in a given year was May 20th in 1984 – something of interest to monitor in coming days. Once we transition to a warmer weather pattern during the second half of the month, the Atlantic Basin tropical season may not be too far behind as, often times, the tropical season begins rather early when there is a chilly spring in the central and eastern US.
Meteorologist Paul Dorian
Perspecta, Inc.
Follow us on Facebook, Twitter, YouTube
And I had just packed up the winter coats.
As I look down at my sweater and pants I note that I am not covered in critter fur. Does that mean Princess Fenrir the 1023rd is holding on to her winter coat?
I am looking out my patio door and watching it snow sideways right now. The temp is on the way down but not quite at freezing yet.
TODAY’S WEATHER 9MAY2020 – I BLAME GLOBAL WARMING. 🙂
https://www.accuweather.com/en/winter-weather/freeze-warning-midwest-northeast-brace-for-record-cold-and-accumulating-snow/734932
WAY TOO COLD FOR MAY IN THE EAST
Even though strong May sunshine will work to negate some of the chill by day, where thick clouds linger and rain or snow falls, daytime temperatures can hover in the 30s to lower 40s F through the weekend, which is about 20-30 degrees below normal in the Midwest and Northeast.
Some locations can still rival record low maximum temperatures as the air coming in is from the Arctic. Washington, D.C., will challenge a record low maximum temperature of 52 on Saturday — a mark that has stood since 1877. The 143-year-old record at stake in the nation’s capital is a testament to the magnitude of the frigid air coming into the region.
Several record lows were broken on Saturday morning, including in Pittsburgh, Detroit, and Central Park in New York City where temperatures dipped into the upper 20s and lower 30s.
Living just East of the spine of the Green Mountains in Southern Vermont we have seen snow before around Mother’s Day. It is not all that unusual, at 1800 feet we expect about 2-3 inches by Saturday AM.
Living just west of the Baltimore Washington parkway between Baltimore and the Nations Capitol. It is extremely rare for temperatures to dip down to freezing at night by the 2nd week of May. I guess normal depends on where you live.
Not good for the food supply.
Thanks for more CO2, last year’s corn and soybean crop was robust despite a very cold and very late start. CO2 is great for life.
It might be delaying the beginning of the next glacial period.
Luke wrote:
“Last year’s corn and soybean crop was robust despite a very cold and very late start.” Luke you are wrong – here is why:.
Planting was ~one month across the Great Plains of North America for the past two years 2018 and 2019. In 2018 the growing season was warm and the crop recovered, but in 2019 there was a huge crop failure across the Great Plains; however the harvest was good in the USA East and South. In 2019 fully 30% of the huge USA corn crop was never planted because of wet ground. Much of the grain crop across the Great Plains was not harvested because of early cold and snow in the Fall. Read the paper by Joe D’Aleo and me. Joe is one of the top meteorologists on the planet, based on his successful predictive track record.
THE REAL CLIMATE CRISIS IS NOT GLOBAL WARMING, IT IS COOLING, AND IT MAY HAVE ALREADY STARTED
By Allan M.R. MacRae and Joseph D’Aleo, October 27, 2019. Published on wattsup.
Hope we have a good grain crop this year, but don’t bet on it. Here is why:
Walter Dnes wrote: “… Nino 3.4 has crashed from almost +0.7 on April 18th down to zero today (May 7th).”
5. UAH LT Global Temperatures can be predicted ~4 months in the future with just two parameters:
UAHLT (+4 months) = 0.2*Nino34Anomaly + 0.15 – 5*SatoGlobalAerosolOpticalDepth (Figs. 5a and 5b)
CO2, GLOBAL WARMING, CLIMATE AND ENERGY
by Allan M.R. MacRae, B.A.Sc., M.Eng., June 15, 2019. Published on wattsup c/w spreadsheet of all data and calculations.
Four months from now is early September 2020 – harvest time.
This is the second year in a row like this in the Midwest. What a coincidence.
But, but…. man made global warming???
No, its COLD so its just WEATHER.
They are talking about snow in May .. in May !!
It will be in southern England JMac – we’re expecting an unseasonably very high 26C over the coming weekend. So, yes, weather in the USA, AGW in Britain. As Willis E likes to say “go figure”.
Just looked for the London temps this weekend 15c tops with drizzle and a north easterly wind
Dont see were you get 26 c anywhere in the UK this weekend.
/sarc tag added just in case anybody thinks I’m serious, although expect to see the above headline in the MSM any day soon.
No but really, it is simple physics.
It goes all the way back to when there were canals on Mars.
But, but…. man made global
warmingweirding???Yes, once the correction is applied. All bases covered.
By the time all the “corrections” have been applied, this May will be the (global) warmest evah! (No – I’m dead serious.)
Tombstone: this has been the best darn May of the whole year!
his May will be the (global) warmest evah!
Not even close where I’m at, and that’s what I care about.
I just read an article at CNBC explaining that it’s abnormally cold because of global warming. I’m sure all my liberal friends will nod along in agreement.
Regarding: “in Philadelphia, there has not been a temperature in the 30’s on May 9th or later in more than fifty years (1966) and it could happen on both Saturday (9th) and Sunday (10th) mornings.”:
Philadelphia’s record lows from May 9th through 17th are:
5/09: 33 in 1947
5/10: 33 in 1966
5/11: 28 in 1966
5/12: 37 in 1962
5/13: 37 in 1967
5/14: 40 in 1966
5/15: 39 in 1966
5/16: 40 in 1984
5/17: 37 in 1956
Philly officially got into the 30s (or 20s) 7 times in May 9th or later more than 50 years ago, counting only dates when the temperature set or tied a record that still stands and that hasn’t been tied since.
https://www.stormfax.com/phlminmax2.html
Typo: Make that 8 times in the 30s and 1 other time in the 20s. Also, notably 7 of these 8 record low temperature times 1966 and earlier with temperature in the 30s and the time with temperature in the 20s have happened after Philadelphia’s “official thermometer” started being the official one at PHL airport sometime in the 1940s, 1949 (maybe 1948) according to most sources. I have noticed in WUWT complaining about moving official thermometers to airports. Philly’s official temperature records go back to 1872.
Donald:
Forgive me for probably completely missing what you’re obviously trying to say here. I’ve even read it more than once.
Are you trying to factually contradict, or confirm, the following statement:
“in Philadelphia, there has not been a temperature in the 30’s on May 9th or later in more than fifty years (1966) and it could happen on both Saturday (9th) and Sunday (10th) mornings.”
I am confirming that if Philly gets below 40 on or after the 9th, it would be the first time in more than 50 years. Below 40 on or after the 9th is happening less often than in Philly than it did more than 50 years ago.
Your data does not prove the point you are trying to make.
Just because a single record is more than 50 years old is not evidence that there has been a change in climate.
I imagine that what Donald wants to say is that if we start replacing all the coldest evah records from the last periodic natural cold period in the 1960s, that will prove that the climate fluctuates in a 60-yr cycle and is on an inexorable long-term decline where the cold records get colder in each trough of the cycle and warm records are not broken (necessitating some aggressive adjustments to erase the old warm records to keep the AGW farce rolling).
Yeah, I’m sure that’s what he meant.
Rich Davis: The adjustments used in the major indices of global temperature are confined to within the methods for these determinations of global temperature (such as GISS) and major subsets of global temperature datasets (such as adjusted USHCN). The weather records that people can look up remain unadjusted. That is with few exceptions, such as one location’s official figure for one snowstorm being adjusted by the NCDC in the few days or couple weeks after the snowstorm due to a roughly 2000 change in the way most snowfall accumulation figures at airports was done (as mentioned in a WUWT article shortly after that February 2010 snowstorm).
What about all 7 low temperature records below 40 F in Philly for May dates on or after the 9th being more than 50 years old and looking like they’ll survive this cold spell?
Or this weekend could begin a new temperature trend back to what was happening more than 50 years ago. Based on your chosen method of evaluation, how do we know?
And then what about record highs using the same dates?
From your source:
5/09: 93 in 1936
5/10: 93 in 1896
5/11: 93 in 1896
5/12: 91 in 1881
5/13: 92 in 1881
5/14: 92 in 1956
5/15: 93 in 1900
5/16: 90 in 1998
5/17: 92 in 1974
Only 2 of these record highs are less than 50 years ago, and of these 2, one of them was only less than 50 by 4 years, hence using your logic why can’t I argue that for the same dates record highs are happening less often than they did more than 50 years ago?
Or would you rather agree with me that both our arguments using your logic are really meaningless?
It is known to Philadelphia’s meteorologists that the 1940s move of Philadelphia’s official thermometer to by the Delaware River, where southwesterly winds can spend miles blowing over the river before reaching the thermometer, often causes the thermometer to read lower than the temperature in most of the Philly area on Philly’s hottest days.
Thanks Don, that’s an interesting claim. It doesn’t make any difference to the argument though.
What you’ve just said is that it’s hotter on the days I listed than what’s actually reported. That doesn’t change the fact that those are still the record high days.
So again, using your logic, “why can’t I argue that for the same dates record highs are happening less often than they did more than 50 years ago?”
Skycomputing: It did not get hotter in the pre-late-1940s days you mentioned (78% of the ones you cited) than was reported. After sometime in the late 1940s, it often got hotter in Philly than was reported from PHL Airport on Philly’s hottest days. It was sometime in the 1940s, according to most sources 1949 or 1948, when Philly’s official thermometer started being one in a location that often gets cooling breezes from the Delaware River on hot days.
Thanks Don. I stand corrected.
What you’ve just said is that it’s hotter on three of the days I listed than what’s actually reported. That doesn’t change the fact that those are still the record high days.
So again, using your logic, “why can’t I argue that for the same dates record highs are happening less often than they did more than 50 years ago?”
Remember the Ice Age Cometh period at the time. Just because GISS homogenized it out of official records doesnt mean it didn’t happen.
Although GISS did, HadCRUT didn’t. All versions of HadCRUT show global temperature slightly decreasing from the early 1940s to the mid 1970s. Also, the ice age stuff was mostly in American news, when the eastern roughly 70% of the US was getting hit hard by a string of mostly harsh winters that started with the one of 1976-1977. Many major records were set in that winter, such as Philadelphia’s coldest November, coldest December and coldest January and coldest December-February “meteorological winter” on record, which still stand.
A) D starts with fuzzy math.
2020 minus fifty years is 1970, not 1966.
B) Completely ignore that Earth was in a cool period in the 1960s.
C) Pretend that low temperatures back in the 1960s makes low temperatures in 2020 proof of global warming.
More daytime fantasies from the world of warmists.
1) Any logic supporting global warming is valid.
2) All facts, dates, figures an temperatures disproving AGW are just weather and therefore false.
A) D starts with fuzzy math.
Actually, it’s even more basically fuzzy than that, ATheoK.
D starts with a post talking about weather. Then he moves to turning that weather forecast into evidence for an argument about climate.
Now where have we seen THAT before?
But don’t tell him . . . I’m hoping to lead him into seeing this for himself. We’ll see. Cross your fingers.
The low Saturday morning 5/9 was 35. The record of 33 from 1947 still stands. I admit this is not proof of global warming, although all 7 times before today when Philly got below 40 in May on or after the 9th (excluding any times that did not break or tie records) happened from 53 to 73 years ago. All except one of these times were during the first two decades of Philly’s official thermometer being at PHL airport.
You of all people Donnie – tsk, tsk. It was fun at the beginning, but I’m getting bored now. I’m going back to the big boys table, but before I do make it 7 in 7 so we can call it “even”?
🙂
But it is for your specific dates that you cited, thus, using your logic, “why can’t I argue that for the same dates record highs are happening less often than they did more than 50 years ago?”
Philly’s official low for Sunday morning 5/10 was 39. The record of 33 from 1966 still stands.
Thanks for the update Donald.
Since you’ve agreed we’re now talking about weather, let me point out that the record high of 93 on 5/10 in 1896 still stands as well.
😉
Sycomp: Good point, speaking of weather:
Asheville, NC tied record lows set in 1906 and 1966 at 32F today, May 10. Allegedly:
1906: CO2 295 ppm = 32F record lo
1966: CO2 311 ppm = 32 record lo
2020: CO2 418 ppm = 32F record lo
Howz this CO2 stuff work exactly?
According to the best available evidence thus far, I’d have to say beneficially.
93 on 5/10 in 1896 still stands, and ability of that record to continue standing got easier around 1948 when Philly moved the location of their official thermometer to a place that usually gets cooling breezes from the Delaware River on hot days.
Donald: Do records get adjusted along with all the other data cited in this sort of discussion?
I know it’s just my imagination but around where I am noaa lows get rounded up and highs get rounded up. It’s almost like a bias exists. Meanwhile the local city data seem to consistently come in lower than noaa.
meiggs: Regarding record low temperatures in Asheville: The current location of the official thermometer for Asheville is at Asheville Regional Airport, 9 miles away from the center of Asheville in Fletcher. That airport first opened in 1961. Before 1961 or before sometime after 1961, Asheville’s official thermometer was in a more downtown location.
Also: Where do you get 1966 CO2 being 311 PPM? I saw 321.38 for the year 1966 at
ftp://aftp.cmdl.noaa.gov/products/trends/co2/co2_annmean_mlo.txt
Donald: Don’t know where the Asheville station is, one blogger on this site sent me info that made it appear to be N of town not far above 1-26 and E. And I don’t believe anything I can’t measure for myself even if I hear it on TWC or read it on the WWW. The big airport S of town makes perfect sense though. The big airport international at GSP (not far away in SC) very often if not always reads significantly higher than the regional local little airport in the Greenville, SC. I keep a thermo-meter on the deck (good to 1/10ths F). It rarely matches either but perhaps favors the little airport.
I got my CO2 from https://sealevel.info/co2.html?co2scale=2 to impose on other data for AVL (NOAA ave T, precip, and along with sunspot counts). I was too lazy to enter each point on my excel file of yr vs ave T & Precip & spots & CO2). So, I just slopped in the CO2 reading for every decade and let excel trend it on a 3rd order polynomial. Close enough in my world where my children wouldn’t know what snow is. But good point 1966, CO2 is was allegedly higher than I slopped in as. Nevertheless the gov records say it got to 32F that day anyway! Just like it did at 418 ppm.
Still trying to figure out how this CO2 stuff works. Been having fun with an IR camera, got sky reads in the days before the record though was out back packing when the record happened and left the IR at the flat:
Thursday eve, Tamb ~66F, sky straight up -25F, RH ~28%, clear
Friday eve, Tamb ~61F, sky straight up 39F, RH ~54%, cloudy
Sat morn, Tamb ~43F, sky straight up -37F, RH ~70%, clear
Record low was tied Sat nite in AVL
Next task is to remember actual H20 ppm as function of RH & temp at fixed altitude (~1060 ft).
Thanks Donald.
Wow I’m just not sure how you’re able to continually misunderstand how that proves my argument.
Let’s say I grant you that the thermometer has been moved and is affected by the breeze from the river. Let’s further assume the temperature recorded with the breeze is 93, but the actual temp is 94. That means those days we cited that fall after the thermometer move are 1 degree hotter than recorded. This doesn’t change the fact that for all the dates in question post the move date of the thermometer those high temps are still the record highs for those days. It just means the recorded temp is COOLER than actual. Naturally, since the record highs pre-move are still the record highs for those days, ALL of the record highs, pre and post move, are still the record highs, regardless. Or would you disagree?
If you don’t disagree, then using your logic, why can’t I argue that for the same dates you claim record lows are happening less often than they did more than 50 years ago, record highs are happening less often than they did more than 50 years ago?
Moreover, about this whole matter I’ve been wondering:
“It is known to Philadelphia’s meteorologists that the 1940s move of Philadelphia’s official thermometer to by the Delaware River . . . ”
Does anyone ELSE know about the move? Like for example the PA State Climatologist that provided the temperature records for your (our) cited source?
If PA meterologists know about the move in the 40’s, I’m sure they’ve adjusted the data to homogenize with “actual” temps have they not? If not, are they just knowingly publishing bad data for the record temps at your cited source? And if that’s true, why should I believe ANY of the published records there, whether record highs or lows?
Maybe you could clear up the confusion by offering any proof whatsoever of any of your claims? I’d appreciate the opportunity to catch up on the details myself.
Until then, I just don’t see any logical reason to do anything other than go with the published data as you provided it, since it is YOU who provided it.
Standing by for your reply!
Sycomp:
https://theearthintime.com/
Skycomputing: The ~1948 move of Philadelphia’s official thermometer to by the breezes from the Delaware River often made it read 2-3 degrees F less than the thermometer at PNE airport on Philly’s hotter days.
Pennsylvania’s state climatologist is aware of this move and its effects, or should be, because it is well known by Philly-area and even central PA meteorologists. I wonder why you ask if PA’s state climatologist is aware of this.
As for effect of this move on low temperature records: The move to outside downtown or nearly-downtown allowed lower temperatures to be recorded. The Delaware River becoming a presence nearby to the southeast usually didn’t matter much for low temperature records, because at the colder times the wind was generally from the northwest, as opposed to usually from the southwest when Philly gets hot weather.
Adjustments / homogenizations for the move are not applied to the official weather records such as cited by Stormfax. Such adjustments are only done within calculations for global temperature datasets and significant subsets of those, such as GHCN and USHCN and the GISS further adjustments. That is explained in the reasonings for the adjustments/homeginations, by those who do that (sources of GHCN and USHCN, NOAA and GISS by NASA). For that matter, PHL airport’s thermometer isn’t even part of GHCN or USHCN.
Thanks for getting back in touch Don. It’s great to hear from you again. You’re wonderful comic relief for my poor, old, tired eyes young man!
Wow I’m just not sure why you purposefully continue to misdirect from how that proves my argument. How many times have you avoided the question now? By my count, at least 5 times over 7 days, and counting!
Let’s see if you’ll do it again, shall we? 🙂
Assume I grant you that the thermometer has been moved and is affected by the breeze from the river. Let’s further assume the temperature recorded with the breeze is 93 F, thus by your own admission the actual temp is 95-96 F. That means those days we cited that fall after the thermometer move are 2-3 degrees F hotter than recorded. This doesn’t change the fact that for all the dates in question post the move date of the thermometer those high temps are still the record highs for those days. It just means the actual temp is HOTTER than recorded. Naturally, since the record highs pre-move are still the record highs for those days, ALL of the record highs, pre and post move, are still the record highs, regardless. Or would you disagree?
If you don’t disagree, then using your logic, why can’t I argue that for the same dates you claim record lows are happening less often than they did more than 50 years ago, record highs are happening less often than they did more than 50 years ago?
Skycomputing: You said in part “That means those days we cited that fall after the thermometer move are 2-3 degrees F hotter than recorded.” That’s not all of the days when Philly a mile or more from the Delaware River got hotter than its pre-1948 records for specific dates, most of which still officially stand. On some of the dates where the official record is pre-1948, after 1948 it got a degree or sometimes 2 degrees hotter (a mile or more from the Delaware River) afterwards without a new or tied record being officially recorded where the official thermometer was moved away from.
(Oops – let me try that again – okay here we go, cross yer fingers!)
You of all people Donnie – tsk, tsk. It was fun at the beginning, but I’m getting bored now. I’m going back to the big boys table, but before I do make it 7 in 7 so we can call it “even”?
🙂
But it is for your specific dates that you cited, thus, using your logic, “why can’t I argue that for the same dates record highs are happening less often than they did more than 50 years ago?”
Skycomputing: You said recently on 5/15 in part: “But it is for your specific dates that you cited, thus, using your logic, ‘why can’t I argue that for the same dates record highs are happening less often than they did more than 50 years ago?'”
My answer here: Because some of the pre-1948 record highs were afterwards exceeded without becoming new official record highs because they weren’t recorded by the official thermometer after its ~1948 move to a place where it gets cooling breezes from the Delaware River on most hot days.
Question pretty-much repeated from before, so my answer is similar to what I said before. Do you have a refutation against this better than the non-technical 5/15-stated “going back to the big boys table”?
Well then I’m sorry Donald, but if the previous official thermometer with the official highs isn’t exceeded by the official highs of the new official thermometer, then I’m going to have to assume the previous official highs are official, after all, that’s what the officials compiling the official climatology records have decreed as official. And I’m sure they know what they’re doing, otherwise you wouldn’t have cited them as official in your original argument.
Now, I think your desperation knickers are showing, and I’m having second thoughts as to your sincerity. I thought at first you surely were having a bit of fun and didn’t possibly believe anything you were saying, so I went along for a little sword sharpening.
Now, however, I’m afraid you actually believe yourself. I can’t pile on to someone like that. It just isn’t decent. I can no longer be party to the continued participation of you progressively making a parody of yourself. I’m off to the official Sandbox of the Sane.
Take care!
sycomp:
offal or official?
The former likely is closer to the fact.
meiggs:
Aha, I see you noticed my noting that I couldn’t “pile” on . . .
🙂
Skycomputing: There is substantial chance that the specific pre-1948 record high temperature for one date in May that you most recently cited, survived past ~1948 because of Philadelphia’s official thermometer having moved in ~1948 to close to the Delaware River and getting cool breezes on most hot days in Philly.
Apparently, there is no record of a snowfall in Philadelphia in May
Since Philadelphia’s weather records started at the beginning of 1872 it has snowed in Philly six times in May, as far back as 1885 and as recently as 2010 and as late in the month as 5/24 (in 2000), with none of those six times having an officially measurable accumulation. At least according to: https://philadelphia.cbslocal.com/2020/05/06/philadelphia-weather-snow-in-may-parts-of-region-could-see-snowflakes-wind-chills-dipping-into-20s/
I just found something different from the National Weather Service. According to their Philadelphia / Mt. Holly weather forecast office, since the 1872 start of weather records it snowed 5 times in Philly in May, all 5 times only a trace: 5/6/1891, 5/8/1898, 5/8/1947, 5/1/1953, and 5/1/1963. They also mention a storm that caused snow from PHL to Maine on 5/5/1812. https://www.weather.gov/phi/hist_phi
That was the Ice Age Cometh period that BEST, GISS etc. erased ..er.. I mean homogenized.. some years ago. Where are you getting such figures from!!! I have forecast a cool summer for most of Canada this year using a method that is infallible:
Hope for weeks that it will warm up and then finally give up.
I did some looking and found that from 1874 (as far back as I was able to go) through 2019, there were 8 times that temperatures colder than 40 officially happened in Philadelphia in May on or after the 9th other than times that set records that still stand and haven’t since been tied:
5/12/1907 (38)
5/11/1913 (39)
5/10/1923 (38)
5/10/1947 (34)
5/11/1947 (39)
5/9/1950 (39)
5/10/1962 (37)
5/9/1966 (38)
https://w2.weather.gov/climate/xmacis.php?wfo=phi
This is what global warming looks like, why can’t you fools understand that we predicted this would happen when we said global weirding! Our models precisely account for all of the strange weather events to occur at random times. No other models can come close enough to make such a claim, but we called it!
Do I need a sarc/?
Is this at all related to ENSO? According to Tropical Tidbits, Nino 3.4 has crashed from almost +0.7 on April 18th down to zero today (May 7th).
Imo, yes it is. Note my remark from Feb 1st “…forecast for a negative ENSO starting around April/May of this year…”. … https://wattsupwiththat.com/2020/01/31/rutgers-university-global-snow-lab-and-the-snows-of-yesteryear/#comment-2907038
I made that remark to kick off my attempt to accurately forecast temp shifts in the ENSO 3..4 region. This should be the beginning of a deep and long La Nina. The 3.4 region will really see a drop in temps when the first significant sunspot groups start showing themselves. As long as the sunspots are mainly in the northern hemisphere of the sun. I expect to see the 3.4 region down to -1 C by the end of the year as a consequence.
Goldminor wrote 1Feb2020:
“@ur momisugly Javier …forecast for a negative ENSO starting around April/May of this year.”
Good call. Was this your forecast or someone else’s?
What was your methodology or source for this prediction?
This is my prediction from 2015, and my more current updated forecast on Feb 1st. My method for analyzing when temp shifts will take place, and the sign of the change is based on which hemisphere of the sun is the more active with sunspots. I expect groups of sunspots to begin appearing around July. That from July to September sunspots will still be intermittent, and then become more regular in the last 1/4 of the year. That is a forecast which I made over at Spaceweather in December.
The discussion was about what month should be considered as the minimum, and how abruptly would the minimum end. I was of the opinion that there would be a minimum of 150 spotless days for 2020 which was contrary to what the author of the post thought. My reasoning for that number stemmed from noting the 800+ spotless days from the previous minimum. Current number for spotless days at the end of 2019 were only 636. That said to me that the final numbers should be much closer to 800 at a minimum, especially given what the trend of the Oulo daily graph shows. I read the Oulo graph as suggesting another longish minimum similar to the length of the 2008/09 minimum.
I also stated that the first half of 2020 would have the most spotless days with the second half being the restart towards the max, and the gradual end of spotless days. So far most of the few sunspots this year have been in the northern hemisphere with occasional southern sunspots of late. If the northern hemisphere of the sun remains dominant in sunspot count, then the ENSO regions will swiftly respond by moving towards a la Nina state. I expect the northern hemisphere of the sun to be mostly dominant for sunspot count for the next 16 years. As a result I would expect to see the ENSO regions strongly favor negative temps. In the near term I think that we will see Dr Spencer’s UAH graph drop to the zero trend line by August, and then drop into negative numbers through the end of the year. The ENSO 3.4 should read around -1 C at the end of the year. That is how I read the tea leaves from my solar/ocean theory.
This year is show and tell time for my theory. Now I will find out what nature thinks about my thoughts.
goldm – today in SC:
1916 Record Hi = 97F @ur momisugly ~300 ppm atm CO2
1989 Record Lo = 31F @ur momisugly ~ 337 ppm
2020 Ave T = 53F (2F under ave Lo) @ur momisugly ~ 418 ppm
Strange is it not? We’ll test record Lo’s this weekend but don’t think we’ll break any here.
I’ll be watching UAH, the indigenous trees around here seem to think the weather is improving from their point of view.
Hi goldminor – Successful predictions are rare.
Consider submitting a paper to wattsup and Joe D’Aleo at icecap.us.
Regards, Allan
@ur momisugly Allan … I have wanted to share my ideas with all here for years. However, given my unusual approach to science it has been hard to show to others that I may have found that which others did not see. Finally though, I think that nature is about to come to my aid by proving to me as well as to others that my thoughts were following the right path.
My speculative theory was always lacking proof. The only way to achieve proof of concept, or the lack of proof is validation from nature. I believe that I can now predict all changes in the ENSO regions with the same accuracy as my Feb 1st forecast. This means that I will prove that all climate models have been wrong as they miss the primary interaction between solar phases and the effect on the oceans. The ENSO region is not an oscillation. the ENSO regions are directly driven by solar factors which directly cause warm trends and cool trends. This is the missing heart of climate understanding, imo.
What is needed now is to fill in the blanks of the many interactions which must take place for solar cyclic activity to cause temp changes in the ENSO regions. I have my limits. This is where everyone here who has greater understandings of the natural processes of our planet and solar system can fill in the blanks which I can not see because of my limited education. I have always thought of my concept as a collaborative effort of WUWT minds. I would have never seen that which I now see without the aid of all of the clear thinking from those who frequent this site. It is my mind that connected the dots, but I could have never done so without WUWT.
Now for the final phase though. Nature still has to confirm that my picture is correct. I have made a few correct predictions before only to later see that the concept did not hold up over time. Obviously, I think that I am on the right path, but I need others to also see the same path. So this is going to be an interesting year. If all works out as I think it will, then this concept based on the pages from WUWT will prove to the world just how the climate of our planet works.
I think you use the site exactly as intended, I’m following what you say about solar cycles and ENSO I’m very interested in the subject ,and have always believed solar cycles govern our climate.
The question is, just how much cooling does there need to be before GISS et al stop their warming trend 😉
As the glaciers engulf GISS, they will be saying “9 of the warmest years have been in the last decade”. Temperatures from the 1930s will have been adjusted down to about absolute zero by then.
You will have to wait, maybe several months.
http://www.solen.info/solar/images/AR_CH_20200507.png
Walter wrote: “… Nino 3.4 has crashed from almost +0.7 on April 18th down to zero today (May 7th).”

5. UAH LT Global Temperatures can be predicted ~4 months in the future with just two parameters:
UAHLT (+4 months) = 0.2*Nino34Anomaly + 0.15 – 5*SatoGlobalAerosolOpticalDepth (Figs. 5a and 5b)
CO2, GLOBAL WARMING, CLIMATE AND ENERGY
by Allan M.R. MacRae, B.A.Sc., M.Eng., June 15, 2019
Published on wattsup c/w spreadsheet of all data and calculations.
Four months from now is early September 2020. Planting was ~one month across the Great Plains of North America for the past two years 2018 and 2019. In 2018 the growing season was warm and the crop recovered, but in 2019 there was a huge crop failure across the Great Plains.
THE REAL CLIMATE CRISIS IS NOT GLOBAL WARMING, IT IS COOLING, AND IT MAY HAVE ALREADY STARTED
By Allan M.R. MacRae and Joseph D’Aleo, October 27, 2019
Published on wattsup.
I published in the Calgary Herald on September 1, 2002, based on a conversation with Dr. Tim Patterson:
“If [as we believe] solar activity is the main driver of surface temperature rather than CO2, we should begin the next cooling period by 2020 to 2030.”
I modified my (our) global cooling prediction in 2013:
“I suggest global cooling starts by 2020 or sooner. Bundle up.”
Cross your fingers – I hope we have a good grain crop this year, but don’t bet on it.
Regards, Allan
Crop failure in 2019? 2019’s US corn harvest was 13.7 billion bushels, down about 9.3 % from 2015’s record of 15.1 billion bushels, and more than for every year before 2013. 2019’s US soybean production dropped about 20% from its 2018 record, and was more than what was produced in every year before 2014.
Notably the 2019 planting delay wasn’t caused by cold, but by rain. And it happened at least as far east as eastern Ohio.
Donald K, we know that. The 2019 grain crop failed across the Great Plains but was good in the USA East and South – read the paper by Joe D’Aleo and me.
On the Plains, wet typically correlates with cold, and hot with dry. This is evident from river flows.
Joe is one of the top meteorologists on the planet, in terms of his successful predictive track record.
Repeating, “hope we have a good grain crop this year, but don’t bet on it.”
THE REAL CLIMATE CRISIS IS NOT GLOBAL WARMING, IT IS COOLING, AND IT MAY HAVE ALREADY STARTED
By Allan M.R. MacRae and Joseph D’Aleo, October 27, 2019
https://wattsupwiththat.com/2019/10/27/the-real-climate-crisis-is-not-global-warming-it-is-cooling-and-it-may-have-already-started/
Yes, the Plains (and Midwest) were famously dry when they had a century-plus-class multi-year warm period in the 1930s, with temperatures being more volatile (due to dryness) including extreme high daily high temperatures in early July 1936 that set statewide records in several states, that still stand. (Including Pennsylvania in a formerly industrial river valley town shortly northwest of Philadelphia, more out of reach of cooling sea breezes than Philadelphia is, and Philadelphia sometimes gets those on its hottest summer days.)
Their recent wetness could be a sign of them being in a multidecadal phase of being cooler than their longer-term trend. My point is that with modern global warming that is mostly manmade, these decadal-class cool times for the Plains and Midwest do not have a great threat of crop-killing cold. As I said, the crop yield dip was not due to temperatures getting harmfully cold, but from rain. The rain made fields soggy. I am not hearing of planting-impairing rain happening the way I did this time of the year in 2019. This time of the year in 2019, there was a lot of chat in Ohio about building arks.
Paging Bill McKibben from his post “Planet of the Humans” depressive mood. Any comment on this abnormal cold ??? ……….. Thought not.
He can’t talk. This rump is temporarily closed.
Regarding: “In Buffalo, the predicted temperature of -40°C this weekend at the 500 millibar level would shatter the previous record of -35.7°C for the entire month of May.”:
How long ago has that been measured? How long ago have computer models been analyzing, let alone predicting that? Regular radiosonde weather balloon launches in the US are twice daily roughly 200 miles apart and started probably not much before the start of computerized “reduction” of their data which began in the late 1960s and was still a work in progress into the early 1970s.
As you say Donald, it must be pretty rare to measure air temperature at 16,000 to 20,000 feet. Just the occasional radiosonde up there.
Too bad airplanes don’t measure temperature and radio it back to earth where it could be used to validate models.
A week or so ago there was an article on WUWT about fewer plane flights over the Pacific meant that there was less data for the weather models to use in making their predictions.
Yeah, that’s what my implied /sarc was referring to
Less flights but obviously not limited to a few radiosondes
Wow, so I guess we’re not depending on just a few radiosondes after all. Have you heard about this Donald?
News to me!/sarc
And how far back were temperature readings from airplanes a significant part of weather data and being used on a daily and widespread basis? My guess is when forecast models started using such data, which I think is something modern. None of the modern forecast models existed in the mid 1980s, except maybe one which some call outdated (the NAM).
Update on the bottoming out of the temperature at the 500 millibar level over Buffalo NY: I did not actually search for radiosonde soundings, but I did look at short term forecasts and “analyses” (“zero hour projections”) of several runs each of the GFS, NAM and RAP models. All of these agree on the temperature at the 500 millibar level over Buffalo having bottomed out between -36 and -37 degrees C and mostly closer to -36 than to -37, and that happened close to or a few hours before 12Z (8 AM EDT) on Saturday 5/9. So, I think the record of -35.7 degrees C was broken by less than 1 degree C.
Is Michael Mann sequestered in State College or visiting one of his buddies in South Florida?
Nooo… This can’t be right. It’s hotter then we thought and bridges are going to melt. You are just a bunch of deniers!
(I am hoping for a moderate Texas summer… Plz, oh plz…)
Another bad week for snow deniers.
I bet that there will be an uptick in new covid cases, and a rise in the daily death rate as a consequence of this late cold spell/ It has been an interesting spring with these outbursts of cold air dropping far south, mainly over Iran and Turkey. Italy had a cold pocket overhead earlier on iin the winter which only gave way about 3 weeks ago. Moscow and the surrounding region have had a substantial overlay of cold air for some time. Now they are posting over 10,000 new cases per day. They should become number two in 5 or 6 days just below the US.
eegads, proof that Covid19 is capable of altering the climate in order to preserve itself.
We’re all gonna die I tell ya.
/sarc for those who are /sarc intolerant
I can’t help but wonder if the cold layer has some impact on the strength/longevity of the virus. I came upon this thought as I have paid attention to the ever changing numbers since the start of the outbreak, and because every day I take a good look at the planet using earthnull while taking pics of 22 locations around the planet. I have been doing this mostly every day since 2016. This means that I always have a good picture in my mind of planetary conditions
Because of the above daily observations around 10 days ago my thoughts told me that there was a possible correlation to the cold air patterns at 500 hPa with the intensity of the outbreak at the surface. There is also some common sense to this. The virus thrives in cold dry conditions. This overlay at 500 hPa causes cold dry conditions down to the underlying surface. So the question came to mind is there a change on the ground in new cases/death rate when the cold air shifts in or out of a region?
I saw several decent examples of just that, and then one particularly strong correlation which occurred in France. This happened just last week. I even made note of it on WUWT. That was on the 1st of this month. Heavy cloud cover engulfed most of France, and new virus cases and deaths dropped substantially for 4 days in a row as the cloud cover made its way across the nation. The cloud cover meant some warming effect from the clouds moving in off of the ocean, and of course an increase in humidity. Is that why numbers in France dropped so dramatically at that time? The new case/death rate then rose a bit on the 4th when the cloud cover had completely dissipated. Coincidence?
At 2,240 feet elevation on the east slopes of the Cascades of WA State, this morning was the second frost for this May. Seems the cold has moved east.
Suck it up buttercups!
Beware the dooming as Accuweather has increased the number of predicted hurricanes to be more predictable-
https://www.accuweather.com/en/hurricane/accuweather-issues-2020-atlantic-hurricane-season-forecast-update/735844
“As they say, hope is not a strategy,” Cates told AccuWeather. “You have to plan on if a hurricane does come and that’s what we’re dealing with now. Luckily, we have a lot of experience with hurricanes.”
Abandon hope all ye who venture there and leave it to the experienced old hands from 2005 by all accounts.
And it all averages out over the rest of the US….
In Tucson we just had a couple of record breaking hot days in the last week.
This doesn’t look like its averaging out, … https://earth.nullschool.net/#current/wind/surface/level/overlay=temp/orthographic=-104.02,37.30,746/loc=-100.087,35.815
It’s the same type of forecast for a blast of icy weather in the UK:
https://www.bbc.co.uk/weather/features/52583609
These forecasts may turn out to be completely accurate … but then again they might not. So they’re interesting, but in the end it’s only actual temperatures that matter. Let’s wait a couple of days.
In Gernany we will have snow around monday…
Where have all the warmists gone?” Long time passing.
Where have all the warmists gone? Long time ago…..
Where have all the warmists gone ?
Piqued by Swede’s girl every one.
When will they ever learn?
When will they ever learn?
If this global warming continues for much longer, I am going to need another set of winter clothes!!
Apologies to Peter Paul and Mary.
Bless.
The USA isn’t the G in AGW.
And it isn’t even anomalously cold everywhere there.
Weather moves “heat” around.
It’s the totality of it that comprises “climate”.
This from the side that assured us that snow was going to be a thing of the past.
If there is cold air coming south over N America and Europe is it being replaced , in the High Arctic, by warm air, from the Pacific, say? is this the reason for the warmer than normal temperatures reported by DMI:
http://ocean.dmi.dk/arctic/meant80n.uk.php
and the lower than normal ( for this time of year ) extent of Arctic ice?
This is somewhat different this year with long arms of cold air reaching out to the south at 500 hpa. … https://earth.nullschool.net/#current/wind/isobaric/500hPa/overlay=temp/orthographic=-188.84,85.00,546/loc=-100.087,35.815
Same forcast here in the UK for Saturday and Sunday.
But hey, nothing to see here. Just weather, because of global warming in action.
Extremely frosty air will now be moving over the northeast US.

Russia has been having 10+K new virus cases every day for a week now. Both Iran and Turkey have continued new daily cases ranging from 1,500 to 2,000/day. Now look at this persistent cold pattern which has overhung the region for some time now, … https://earth.nullschool.net/#current/wind/isobaric/700hPa/overlay=temp/orthographic=48.25,42.57,827/loc=-40.160,70.041
And so on.
https://earth.nullschool.net/#2020/05/14/0000Z/wind/isobaric/850hPa/overlay=temp/orthographic=-333.27,54.69,1358
It was hot in the 30s, cold in the 60s, hot in the 90s. What does that pattern predict for the 20s?
Completely random correlation
I live in Alberta
In the 90’s I visited the great sand hill area in eastern AB western Sask
Sand as far as the eye can see, so hot it was hard to stand still even in shoes
Took my family there 2 years ago, grass as far as you can see, only a few open dune faces.
Last few years in calgary, hard to get off a crop of tomatoes and peppers, just not enough heat, wet and cold
Late 90’s into ~2010 my rain barrels would be empty by end of June then had to water continually
So hot and dry
All gone now
Will be -3 low next few nights
kerbob: more random, same grads on your time line, longer span, for upstate of South Carolina:
yr precip, in ave T, F
1870 41 54
1900 45 –
1930 24 55
1960 38 55
1990 56 58
2010 44 55
2019 57 58
At this level of resolution trend 1.008x in abs T, 1.39x in precip.
If your precip is trending up it may explain the grass. 32 inches precip here already this year, ave annual is ~48 inches. Looks like another wet one.
Also, here in calgary we have an outdoor eating area, rarely used in last few years, very few evenings where it is warm enough to comfortably eat outdoors
I would have no complaints with some warming
“An extremely anomalous upper-level low will move on top of the Mid-Atlantic/Northeast US”
ALL weather is anomalous. Every static observation of weather will mostly show temp, rainfall as being above or below average with the occasional extremes. To average out all weather observations and then say this is where temps and rainfall should be is unbelievably intellectually immature.
And…What are these tipping points and where is the empirical evidence or observations of how such a phenomena work in a global atmospheric system?
Antarctica froze over a good 30,000,000 years before the Arctic froze. As CO2 is distributed fairly evenly around the globe something else is causing the great ice sheets to form and that would be the massive re-direction of heat around the planet that happens as continents move and either compliment or disrupt the main atmospheric cells.