Reposted from Dr. Roy Spencer’s Blog
March 22nd, 2020 by Roy W. Spencer, Ph. D.
Some global warming alarmists are celebrating the current economic downturn as just what is needed to avert climate catastrophe. I’ve seen a couple estimates that China’s manufacturing and commerce might have seen up at 40% reduction recently.
The current global crisis will be a test of just how much economic pain is required to substantially reduce CO2 emissions (assuming there is no reasonably affordable and practical replacement for fossil fuels).
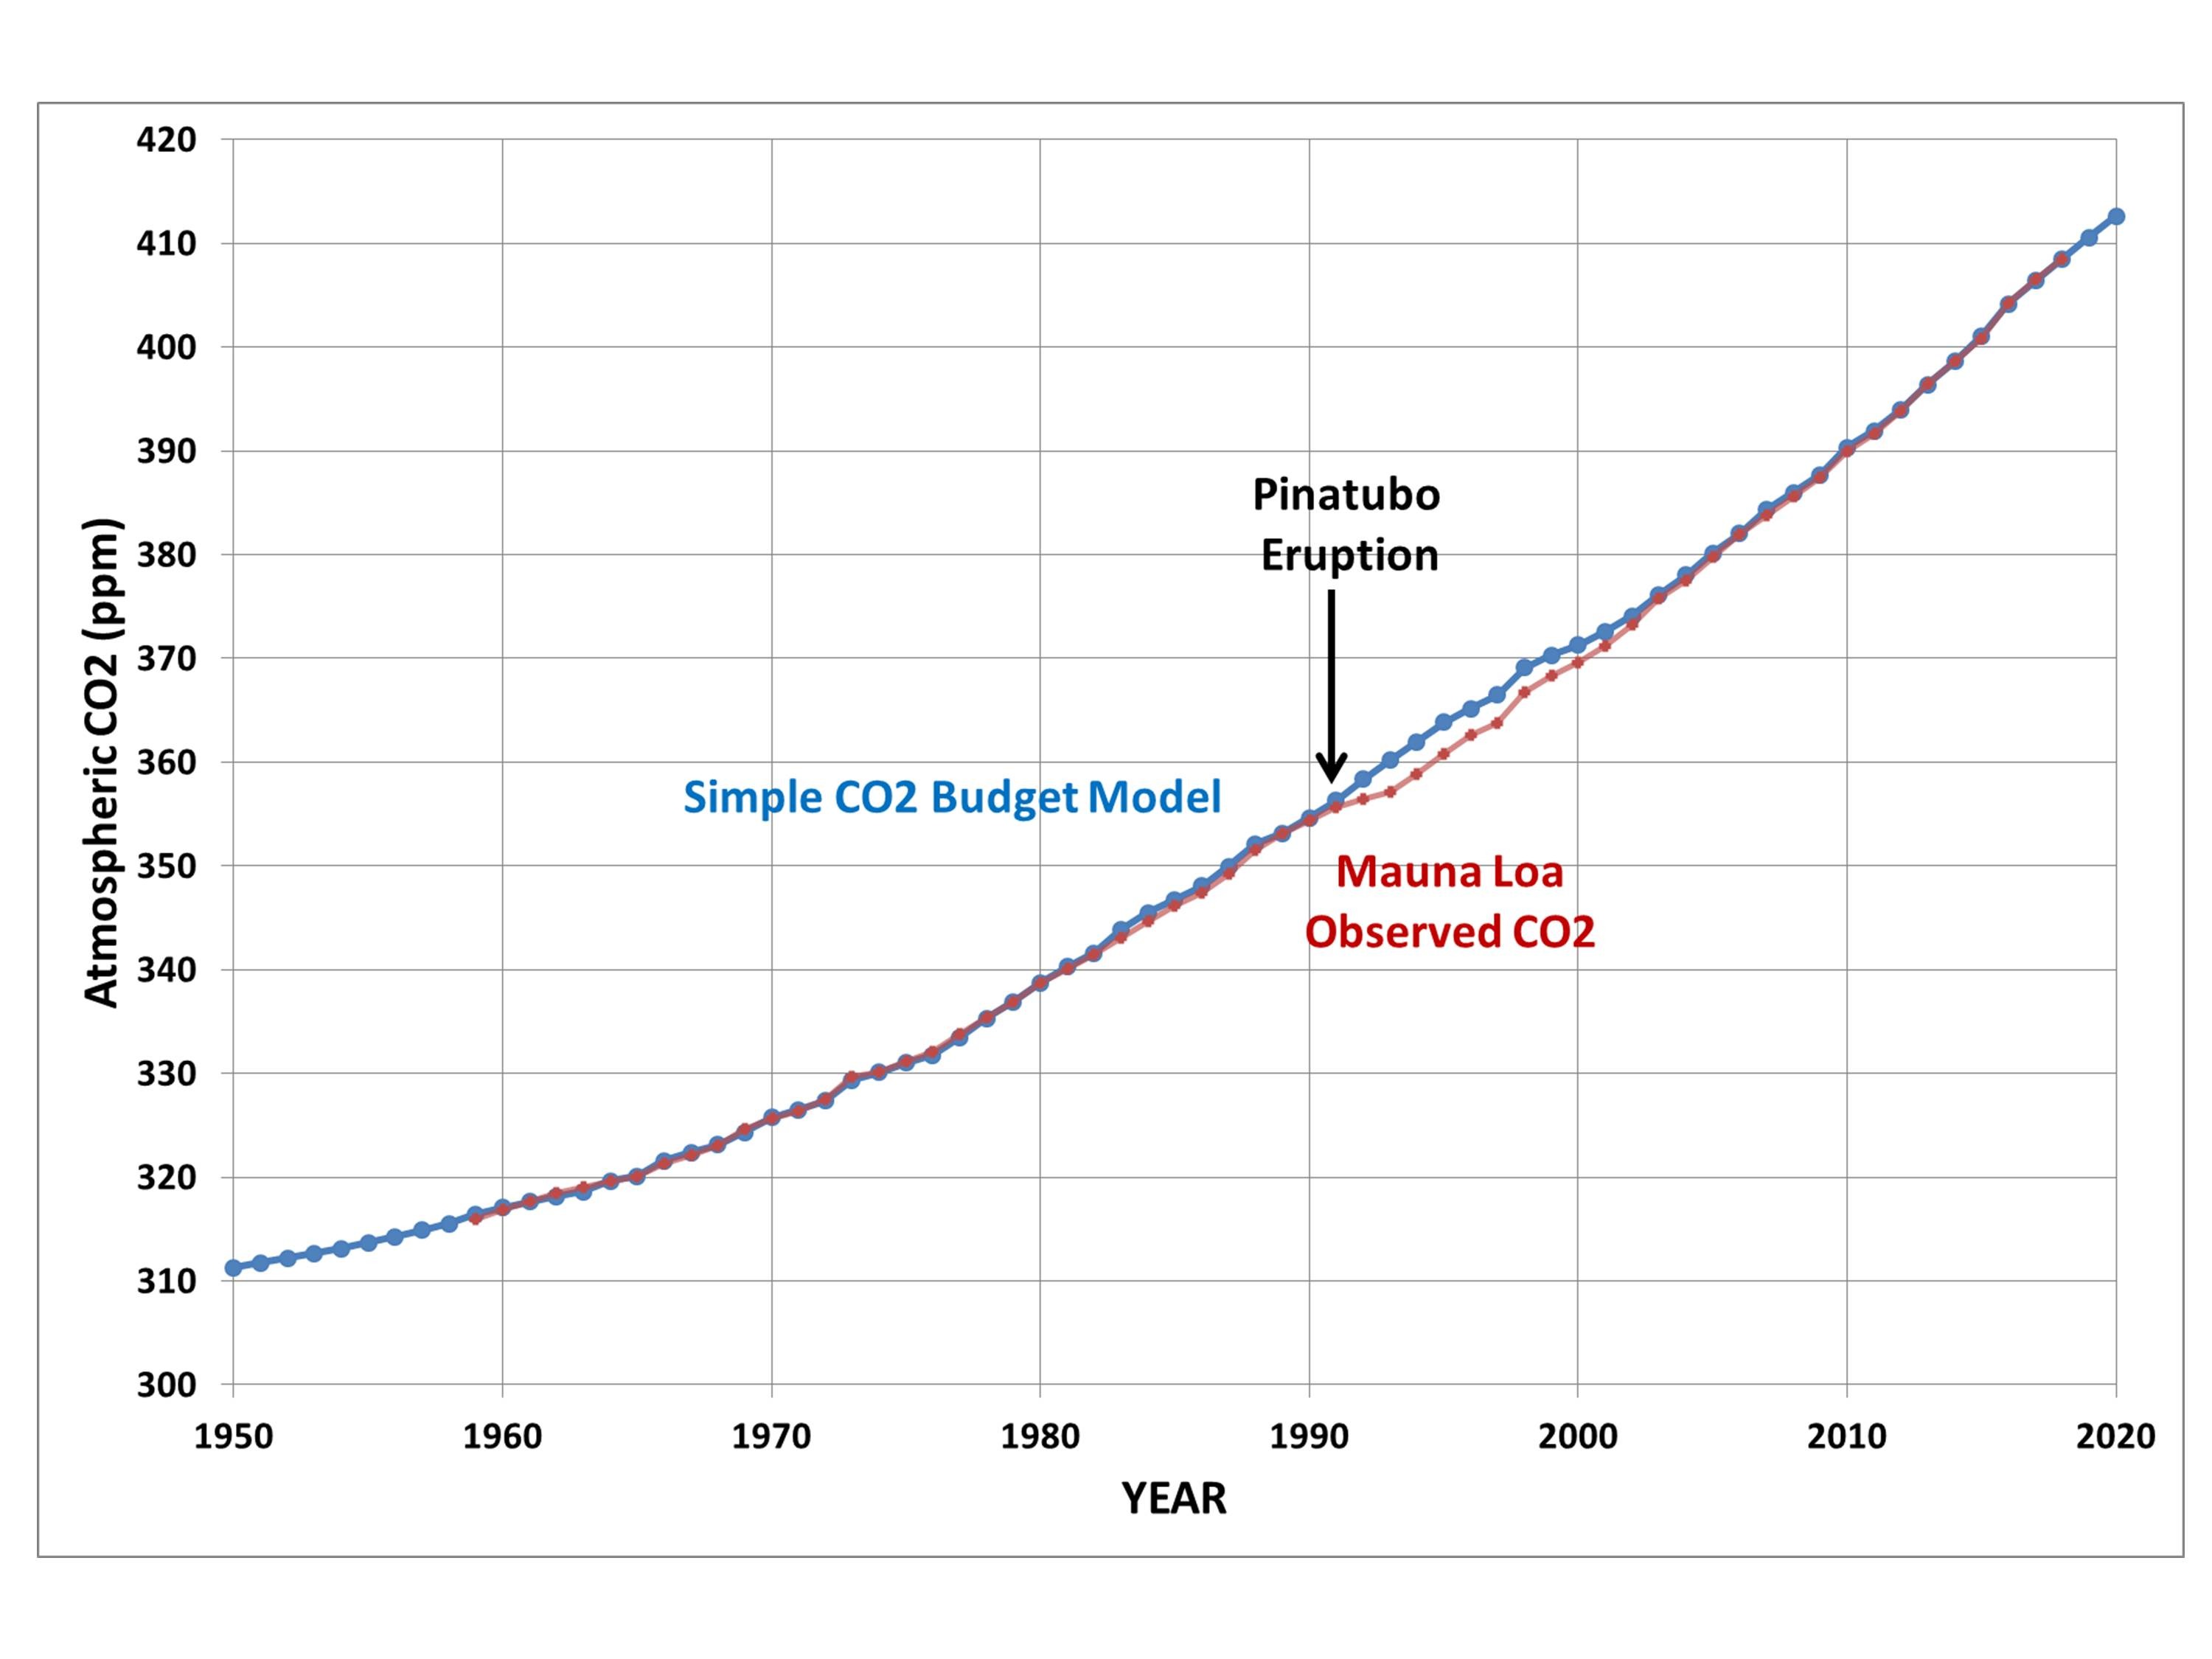
I already know that some of my “deep skeptic” acquaintances (you know who you are) who believe the global CO2 increase is mostly natural will claim a continuing CO2 rise in the face of a decrease in economic activity supports their case. I have previously shown that a simple model of the CO2 variations since 1959 forced with anthropogenic emissions accurately explain the Mauna Loa observations (see Fig. 2 , explanation here). It will take considerable evidence to convince me that the long-term rise in not anthropogenic, and maybe the current “coronavirus experiment” will provide some contrarian evidence.
Of course, for anthropogenic CO2 emissions reductions to have any effect, they actually have to show up in the atmosphere. The most widely cited monitoring location for CO2 is on Mauna Loa in Hawaii. It is at high elevation in a persistent subtropical high pressure zone that should be able to detect large emissions changes in several weeks time as weather systems move around the world.
I’ve had several requests, and seen numerous social media comments, suggesting this is something that should be looked at. So, I’ve analyzed the Mauna Loa CO2 data (updated monthly) through February 2020 to see if there is any hint of a CO2 concentration downturn (or, more accurately, reduced rate of rise).
The short answer is: No… at least not yet.
The Mauna Loa Data: Removing Seasonal and ENSO Effects
While an anthropogenic source of CO2 can explain the long-term rise in CO2, the trouble with finding an anthropogenic signal on time scale of a few months to a couple years is that natural variations swamp any anthropogenic changes on short time scales.
The monthly data (arbitrarily starting 1996, below) shows a continuing long-term rise that has been occurring since monitoring began in 1958. Also seen is the strong seasonal cycle as the vegetation in the Northern Hemisphere goes through its normal seasonal variations in growth and decay.

Obviously, not much can be discerned from the raw monthly average data in the above plot because the seasonal cycle is so strong. So, the first step is to remove the seasonal cycle. I did this by subtracting out a 4th order polynomial fit before removing the average seasonal cycle, then adding that statistical fit back in:

Next, there are some wiggles in the data due to El Nino and La Nina (ENSO) activity, and if we remove an average statistical estimate of that (a time lag and averaging is involved to increase signal), we can get a little better idea of whether the most recent month (February 2020) is out of the ordinary. I have zeroed in on just the most recent 5 years for clarity.

The polynomial fit to the data (thin dotted line) shows what we might expect for the coming months, and we can see that February is not yet departing from the expected values.
Of course, there are a variety of natural variations that impact global average CO2 on a month-to-month basis: Interannual variations in wildfire activity, land vegetation and sea surface temperatures, variations in El Nino and La Nina effects, and short-term fluctuations in anthropogenic emissions immediately come to mind. (The Pinatubo and El Chichon volcano eruptions actually caused a reduction in global CO2, probably due to post-eruption vegetation effects from an increase in diffuse sunlight penetration of forest canopies).
I will try to update this analysis every month as long as the issue is of sufficient interest.
Sudo science is a program that you can input data, but others determine the out come, no matter what you input.
I suspect you mean pseudoscience.
“Overall, we rate Watts Up with That a strong pseudoscience and conspiracy website based on the promotion of consistent human influenced climate denialism propaganda.”
https://mediabiasfactcheck.com/watts-up-with-that/
https://en.wikipedia.org/wiki/Sudo
I say (type) what I mean and mean what I say (type).
climate scientist can input any kind of data and it still come up warming.
Yur link contains at least one big error:
“~factcheck”
😀
mediabiasfactcheck a source for information????
“The Columbia Journalism Review describes Media Bias/Fact Check as an amateur attempt at categorizing media bias and Van Zandt as an “armchair media analyst.”[2] The Poynter Institute notes, “Media Bias/Fact Check is a widely cited source for news stories and even studies about misinformation, despite the fact that its method is in no way scientific”
Thats from wikipedia so make of it what you will.
Overall, Jack Dale is rated as a left wing political activist who supports the pseudoscience of Mann and Hansen and others….he lives in Canada where Comrade Trudeau may build a wall to keep Canadians from fleeing …will Comrade Trudeau go for the Cuban model or the Venezuelan model? Comrade Jack denies climate cycles…the Little Ice Age…the Roman Warming Period…the Dark Ages Cooling…the Medieval Warming Period…why is Comrade Jack a Denier of Climate Cycles? Maybe the coming Grand Solar Minimum will convince him? No, he is a Denier.
Actually we are building a wall to contain Americans who will be leaving to try to take advantage of our universal health care after Trump restarts the economy and the outbreak around Easter.
There will be no cooling.
NASA says so. https://climate.nasa.gov/blog/2953/there-is-no-impending-mini-ice-age/
Science says so.
“Any reduction in global mean near-surface temperature due to a future decline in solar activity is likely to be a small fraction of projected anthropogenic warming. ” https://www.nature.com/articles/ncomms8535
“Here we use a coupled climate model to explore the effect of a 21st‐century grand minimum on future global temperatures, finding a moderate temperature offset of no more than −0.3°C in the year 2100 relative to a scenario with solar activity similar to recent decades. This temperature decrease is much smaller than the warming expected from anthropogenic greenhouse gas emissions by the end of the century.”
https://agupubs.onlinelibrary.wiley.com/doi/full/10.1029/2010GL042710
However, for those who dismiss science, I am selling glacier insurance as sideline to my pet care service who believe in the rapture. Both are cash in advance.
“There will be no cooling.”
You’ve already been corrected on that by me and many others.
It is currently cooling.
So, you are denying.
It is not cooling, nor will it cool.
You are as bad as Don Easterbrook, Syun Akasofu, Habibullo Abdussamatov, Joe D’Aleo, and Nicola Scafetta; all of whom predicted cooling that never happened.
It is warming.
1) never heard of them;
2) I don’t run screaming in panic to other authorities to either refute other’s claims or support mine;
2a) I collect data, parse it, and examine it for the organic sine wave trend that is always evident;
2b) you never do anything else but go running out the room like that.
3) It is cooling now, the downslope of the 35-year 4F cycle;
4) it is cooling now, the downslope consisting of two larger cycles over 140 years;
5) it is cooling now, the downslope of the Holocene since the Younger Dryas;
6) it is cooling now, the downslope of the fiery creation of the sun and earth 4.5 billion years ago.
There is no abnormal warming of the earth.
https://news.yahoo.com/in-the-coronavirus-pandemic-carbon-emissions-have-fallen-but-climate-change-remains-an-existential-threat-140002670.html