Guest Post by Willis Eschenbach [see update at the end]
How much is a “Whole Little”? Well, it’s like a whole lot, only much, much smaller.
There’s a new paper out. As usual, it has a whole bunch of authors, fourteen to be precise. My rule of thumb is that “The quality of research varies inversely with the square of the number of authors” … but I digress.
In this case, they’re mostly Chinese, plus some familiar western hemisphere names like Kevin Trenberth and Michael Mann. Not sure why they’re along for the ride, but it’s all good. The paper is “Record-Setting Ocean Warmth Continued in 2019“. Here’s their money graph:

Now, that would be fairly informative … except that it’s in zettajoules. I renew my protest against the use of zettajoules for displaying or communicating this kind of ocean analysis. It’s not that they are not accurate, they are. It’s that nobody has any idea what that actually means.
So I went to get the data. In the paper, they say:
The data are available at http://159.226.119.60/cheng/ and www.mecp.org.cn/
The second link is in Chinese, and despite translating it, I couldn’t find the data. At the first link, Dr. Cheng’s web page, as far as I could see the data is not there either, but it says:
When I went to that link, it says “Get Data (external)” … which leads to another page, which in turn has a link … back to Dr. Cheng’s web page where I started.
Ouroborous wept.
At that point, I tossed up my hands and decided to just digitize Figure 1 above. The data may certainly be available somewhere between those three sites, but digitizing is incredibly accurate. Figure 2 below is my emulation of their Figure 1. However, I’ve converted it to degrees of temperature change, rather than zettajoules, because it’s a unit we’re all familiar with.

So here’s the hot news. According to these folks, over the last sixty years, the ocean has warmed a little over a tenth of one measly degree … now you can understand why they put it in zettajoules—it’s far more alarming that way.
Next, I’m sorry, but the idea that we can measure the temperature of the top two kilometers of the ocean with an uncertainty of ±0.003°C (three-thousandths of one degree) is simply not believable. For a discussion of their uncertainty calculations, they refer us to an earlier paper here, which says:
When the global ocean is divided into a monthly 1°-by-1° grid, the monthly data coverage is <10% before 1960, <20% from 1960 to 2003, and <30% from 2004 to 2015 (see Materials and Methods for data information and Fig. 1). Coverage is still <30% during the Argo period for a 1°-by-1° grid because the original design specification of the Argo network was to achieve 3°-by-3° near-global coverage (42).
The “Argo” floating buoy system for measuring ocean temperatures was put into operation in 2005. It’s the most widespread and accurate source of ocean temperature data. The floats sleep for nine days down at 1,000 metres, and then wake up, sink down to 2,000 metres, float to the surface measuring temperature and salinity along the way, call home to report the data, and sink back down to 1,000 metres again. The cycle is shown below.

It’s a marvelous system, and there are currently just under 4,000 Argo floats actively measuring the ocean … but the ocean is huge beyond imagining, so despite the Argo floats, more than two-thirds of their global ocean gridded monthly data contains exactly zero observations.
And based on that scanty amount of data, which is missing two-thirds of the monthly temperature data from the surface down, we’re supposed to believe that they can measure the top 651,000,000,000,000,000 cubic metres of the ocean to within ±0.003°C … yeah, that’s totally legit.
Here’s one way to look at it. In general, if we increase the number of measurements we reduce the uncertainty of their average. But the reduction only goes by the square root of the number of measurements. This means that if we want to reduce our uncertainty by one decimal point, say from ±0.03°C to ±0.003°C, we need a hundred times the number of measurements.
And this works in reverse as well. If we have an uncertainty of ±0.003°C and we only want an uncertainty of ±0.03°C, we can use one-hundredth of the number of measurements.
This means that IF we can measure the ocean temperature with an uncertainty of ±0.003°C with 4,000 Argo floats, we could measure it to one decimal less uncertainty, ±0.03°C, with a hundredth of that number, forty floats.
Does anyone think that’s possible? Just forty Argo floats, that’s about one for each area the size of the United States … measuring the ocean temperature of that area down 2,000 metres to within plus or minus three-hundredths of one degree C? Really?
Heck, even with 4,000 floats, that’s one for each area the size of Portugal and two kilometers deep. And call me crazy, but I’m not seeing one thermometer in Portugal telling us a whole lot about the temperature of the entire country … and this is much more complex than just measuring the surface temperature, because the temperature varies vertically in an unpredictable manner as you go down into the ocean.
Perhaps there are some process engineers out there who’ve been tasked with keeping a large water bath at some given temperature, and how many thermometers it would take to measure the average bath temperature to ±0.03°C.
Let me close by saying that with a warming of a bit more than a tenth of a degree Celsius over sixty years it will take about five centuries to warm the upper ocean by one degree C …
Now to be conservative, we could note that the warming seems to have sped up since 1985. But even using that higher recent rate of warming, it will still take three centuries to warm the ocean by one degree Celsius.
So despite the alarmist study title about “RECORD-SETTING OCEAN WARMTH”, we can relax. Thermageddon isn’t around the corner.
Finally, to return to the theme of a “whole little”, I’ve written before about how to me, the amazing thing about the climate is not how much it changes. What has always impressed me is the amazing stability of the climate despite the huge annual energy flows. In this case, the ocean absorbs about 2,015 zettajoules (10^21 joules) of energy per year. That’s an almost unimaginably immense amount of energy—by comparison, the entire human energy usage from all sources, fossil and nuclear and hydro and all the rest, is about 0.6 zettajoules per year …
And of course, the ocean loses almost exactly that much energy as well—if it didn’t, soon we’d either boil or freeze.
So how large is the imbalance between the energy entering and leaving the ocean? Well, over the period of record, the average annual change in ocean heat content per Cheng et al. is 5.5 zettajoules per year … which is about one-third of one percent (0.3%) of the energy entering and leaving the ocean. As I said … amazing stability.
And as a result, the curiously hubristic claim that such a trivial imbalance somehow perforce has to be due to human activities, rather than being a tenth of a percent change due to variations in cloud numbers or timing, or in El Nino frequency, or in the number of thunderstorms, or a tiny change in anything else in the immensely complex climate system, simply cannot be sustained.
Regards to everyone,
w.
h/t to Steve Milloy for giving me a preprint embargoed copy of the paper.
PS: As is my habit, I politely ask that when you comment you quote the exact words you are discussing. Misunderstanding is easy on the intarwebs, but by being specific we can avoid much of it.
[UPDATE] An alert reader in the comments pointed out that the Cheng annual data is here, and the monthly data is here. This, inter alia, is why I do love writing for the web.
This has given me the opportunity to demonstrate how accurate hand digitization actually is. Here’s a scatterplot of the Cheng actual data versus my hand digitized version.

The RMS error of the hand digitized version is 1.13 ZJ, and the mean error is 0.1 ZJ.
Since you asked:
The problem with a temperature sensor is that it reports the temperature of the sensor and one tries to infer some truth about the medium into which it’s been immersed. One doesn’t equip large vessels with multiple TE’s (Temperature Elements: thermocouples, RTD’s take yer pick…); rather, it is better to circulate the vessel contents such that the volume flows often enough past the sensor that there is adequate confidence to have “sampled” the temperature of every gallon. It’s tough enough to keep one sensor calibrated to 0.1C, I’d cringe to think about an instrument with 0.01C or better resolution times the number of them you’d need to “sample” even a modest stretch of ocean as you described.
The other reason designs eschew multiple TE’s (beyond a single redundant unit) is common mode failure. If two properly spec’d, installed and maintained units don’t get the job done, more won’t help.
Depending on the vessel size, one can consider either an immersion mixing impeller (selected for flow and not shear) or an external circulation loop equipped with an eductor return to mix the vessel contents. For a modest size liquid mass (example: Baltic Sea), the immersion impeller is probably a bit past, er, practical. So, you’ll want to go with the circ-pump design.
The flow rate of the loop is determined by the time scale on interest. If one is trying to control a reactor with a nicely exothermic reaction, you’ll want the TE to look-over the vessel contents pretty frequently. However, in your application, an hourly temperature assay will likely do nicely. I would recommend a liquid turn-over of 3-5 turns per hour to provide an adequate level of confidence. If that pump is a bit over your capital budget, you could back it way down to 3-5 turns a day and get a daily temperature.
You’ll want the pump with the two-belt drive.
“we could measure it to one decimal less uncertainty, ±0.03°C, with a hundredth of that number, forty floats.”
How may for 0.3 pseudo-degrees C pseudo-precision?
And how many for a 3 pseudo-degrees pseudo-precision?
Willis, You state “But the reduction only goes by the square root of the number of measurements.” This applies only to homogeneous data. Ocean temperatures are not homogeneous.
Phil Jones made this error many years ago in claiming super high accuracies for Hadcrut data.
In the same way, one could claim a very high accuracy of atmospheric temperatures by getting 8 billion people to put a finger in the air …
Oceans act as a buffer to store energy.
Land surfaces not so much.
More land surface area in the northern Hemisphere.
Larger ocean surface in the southern hemisphere (SH).
Perihelion presently early in the month of January in SH summer.
Oceans gaining heat.
What else would one expect?
http://astropixels.com/ephemeris/perap/perap2401.html
The main problem with ARGO is that the measurements are not randomly distributed. For various oceanographic reasons (currents and sea-ice in particular) measurement are very unevenly distributed, and something like 10% of the ocean is never sampled:
The unsampled areas include almost all continental shelves, but also several areas with deep ocean, e. g. most of the Arctic Ocean, much of the Southern Ocean, the sea of Okhotsk, the Bering Sea, the Norwegian Trench and several deep basins in Indonesia.
The lack of sampling in arctic areas and on shelves are very serious, since these areas may well have a different thermal history. Also the lack of measurements below 2,000 meters of course make any claims of measuring ocean-wide temperatures completely meaningless.
The area of the world’s oceans is estimated at 361 million km^2 = 3.61(10^14) m^2. The volume of the top 2 km would then be 3.61(10^14) * 2000 = 7.22(10^17) m^3. Assuming a density of 1000 kg/m^3, the total mass of the ocean down to 2000 m depth would be 7.22(10^20) kg = 7.22(10^23) g. The heat capacity of water at 25 C is about 4.2 J/g-C, so it would take about 3.02(10^24) Joules, or 3,020 zettajoules, to heat up the top 2 km of the ocean by 1 C.
So if the estimated heat content of the oceans (relative to the datum) went from -80 ZJ in 1987 to +220 ZJ in 2019, the ocean would have gained about 300 ZJ in 32 years, which corresponds to an average temperature rise of about 0.10 C, as mentioned by Willis Eschenbach, or about 0.003 C per year.
But how can anyone guarantee that type of accuracy for a buoy that spends 9 days at 1 km depth, goes down to 2 km depth, then rises to the surface, constantly immersed in salt water? At 2 km depth, the pressure of the surrounding water would be about 19.6 MPa or about 2,850 psi, and the measurement device would have to withstand that pressure. Do we know that the temperature measurement devices perform as well under high pressure as they do near the surface? If the temperature is measured as an electrical signal, is any correction made for the resistance of transmitting the signal over up to 2,000 meters of vertical wire? How is power supplied to the measurement device, and is any correction made for the gradual voltage loss from a battery, or the increase in voltage when a partially discharged battery is replaced by a fully charged battery? Could there be some small stray currents caused by corrosion of the terminals of the thermocouple in salt water that affect the measurement signal?
How often are the measurement devices re-calibrated at the surface, in order to correct for signal drift? A signal drift equivalent to 0.1 C over 32 years, or less than 0.00001 C per day, may not be detectable by those who calibrate the instruments, but it could be responsible for the entire 300 zettajoules reported in the article.
Then there is the issue of spacing of the buoys. If there are currently 4,000 Argo buoys in 361 million km^2 of ocean, that’s about one buoy per 90,000 km^2, or an average spacing of 300 km if they were arranged in a grid. We could be completely missing a current of unusually cold or warm water up to 200 km wide, which would never show up in the data.
Has anyone applied the difference of gravity due to orbit changes of the planets vs the sun to these numbers? It seems to me that this might be a cause of the very slight ‘change’ and not anything man can do.
Excellent post, thank you Willis.
I have read the article in question, Cheng et al. 2020, freely downloadable and only 6 pages.
The following is a very revealing email exchange (total 3 emails) that I had today, with one of the authors (name replaced with XXXX, out of kindness):
EMAIL 3:
Thanks for your comment XXXX. Very illuminating
Quotes from Cheng et al. 2020:
“Human-emitted greenhouse gases (GHGs) have resulted in a long-term and unequivocal warming of the planet (IPCC, 2019).”
“There are no reasonable alternatives aside from anthropogenic emissions of heat-trapping gases (IPCC, 2001, 2007, 2013, 2019; USGCRP, 2017).”
IPCC is mandated to prove ‘man-made global warming’. Fatal bias.
IPCC also neglected to ask GEOLOGISTS, oops …
https://www.researchgate.net/publication/331974185_IPCC_Intergovernmental_Panel_On_Climate_Change_next_report_AR6_due_2022_-_784_authors_yes_784_but_again_NO_geologists
It gets worse …
Cheng et al. 2020:
“These data reveal that the world’s oceans (especially at upper 2000 m) in 2019 were the warmest in recorded human history.”
I assume this over-dramatic statement was intended to say “warmest since humans began reliably measuring ocean temperature, a few decades ago”; rather a big difference. The data in Cheng et al. go back to 1955, i.e. 64 years of data. Earth is 70 million (sic) times older (4.5 billion years old). Just maybe the ocean has been warmer in the past.
Love CO2 …
https://www.researchgate.net/publication/332245803_27_bullet_points_prove_global_warming_by_the_sun_not_CO2_by_a_GEOLOGIST_for_a_change
Cheers,
Roger
EMAIL 2:
From: XXXX
Sent: 15 January 2020 14:37
To: Roger Higgs
Subject: Re: [External] Sun not CO2 controls climate & sea level – New ResearchGate contribution
Thank you for my morning humor!
Sent from my iPhone
EMAIL 1:
On Jan 15, 2020, at 8:12 AM, Roger Higgs wrote:
bcc’d to dozens of colleagues …. (including XXXX)
Dear Colleagues,
You might be interested in this new item, uploaded today …
https://www.researchgate.net/publication/338556345_Synthesis_of_archaeological_astrophysical_geological_and_palaeoclimatological_data_covering_the_last_2000_years_shows_the_Sun_not_CO2_controls_global_temperature_and_portends_a_sea-level_rise_of_3_met
As always, your comments and suggestions for improvement would be more than welcome.
Best wishes for 2020. Please keep up the fight to expose the climate-change industry. In particular, society needs to hear thousands more geologists speaking out. As a group we’ve been strangely silent throughout this whole CO2 farce.
Roger
PS Howard, please forward to groups if appropriate.
Dr Roger HIGGS DPhil
Geoclastica Ltd, Independent Geological Consultant, UK
Dr. Higgs, please accept my apologies in advance for any discomfort you may experience here. Please don’t take this personally, as I respect your complementary research to mine. You made many good points regarding sea level.
I am an independent sun-climate researcher, a BSEE, and do all my own work, having spent many years doing sun-climate science and creating the solar/geo current conditions product linked to my name.
Your work came to my attention via a video of Suspicious Observers, Ben Davidson, who claimed you are the man responsible for discovering the solar modern maximum caused the 20th-century warming.
I dispute his claim vigorously along with several aspects of your work. I am the man who in 2014 determined the modern maximum mathematically and spoke of it often here and elsewhere in that year.
At the time I used Group sunspot number, later that year I used daily and monthly v2 SN to add one year at the start and end to make the Modern Maximum 1935-2004.
Another way to prove my claim is with web image search I did a minute ago for the words “solar modern maximum”, where only two images came up, mine. I couldn’t be prouder, my definition and depiction of the Modern Max and my proof of CO2 outgassing at 25.6C, two of my many discoveries.
Yahoo image search for just ‘modern maximum’ has my image at the #11 spot.
Svensmark is wrong, and there isn’t an 85-year lag as you claim. The sun’s magnetic field does control the climate with a much shorter lag but not according to cosmic rays or low clouds.
Today’s update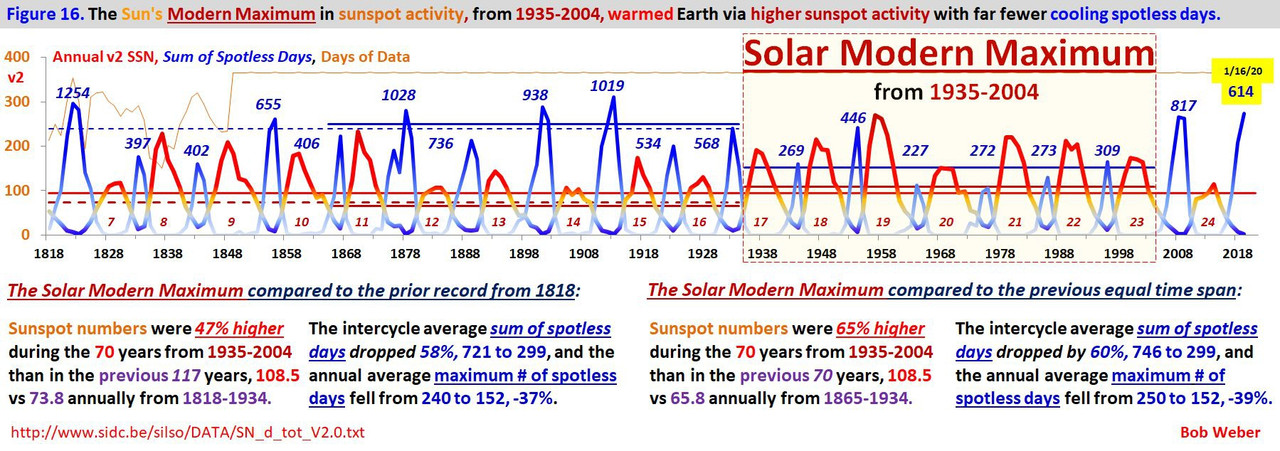
Bob, do you agree with Dr Higgs claimed 3 metres of sea level rise by 2100?
Hell no, but I do agree SL varies with OHC which varies with accumulated absorbed solar energy, but he didn’t say that, I did.
Thanks.
An excellent article well explained, but regrettably unlikely to be read or accepted by the madding crowd.
The reference frame is alarmist. The sun imparts 3,000 Hiroshima Bombs to the earth’s surface per second.
Of the 5 HBs/second they claim, they are probably exaggerating, so let’s say it is 3 HB/second of warming. Of those 3, probably 2 are background warming and 1 could be due to fossil fuel burning.
The 1 additional Hiroshima Bomb per second is 0.03% of the sun’s energy that hits the earth per second.
The sun imparts 100,000,000,000 Hiroshima bombs per year to the earth’s surface.
So basically propagandistic lies and alarmism aimed at taking your money and freedom to give to them for their wealth and power, same as it always was.
Upper OHC had essentially no change between 1963 and 1993 during the cold AMO phase, and has increased since then because of low solar driving a warm AMO phase which reduces low cloud cover. It’s a negative feedback.
Sorry I’m a bit late to the party.
This guy John Abrahams is a serial offender. He has been using the zettajoule scary graph for many years now and what offends me is he is using one of the most egregious of the misuses of graphs to misinform. In particular because it is ‘anomaly’ not ‘absolute’, the uninformed reader can think it is a huge change because he has effectively hidden the zero point on the graph.
He has trotted this out over the years with his pal Dana Nuttiness over at the Guardian and I used to call him out in the comments, asking, so, please tell us the absolute percentage change these ‘anomalies’ represent, and it is effectively a sparrow-farts worth of change.
Additionally, this is a Mechanical Engineer, so why should he be allowed to have a say?
He is one of the John Cook, Stefan Lewendowski crowed of agitators with no actual ‘science’ in their skillset.
Thanks Surfer Dave. Guess who was my sarcastic correspondent in the email exchange I described 4 posts above. Please keep up the great work.
“…plus or minus three-hundredths of one degree C”, etc. Mr. Eschenbach, I have only a very small nit to contribute, and one not at all important to this post (this post which I like tremendously): Back in my day as a practicing chemist, we chemists were taught that temperatures may be measured in “degrees Centrigrade”, but that temperature DIFFERENCES or temperature ERRORS need to be stated as “Centigrade degrees”. (I’m sure you get the point of that without any further elaboration on my part.) Thank you for this post.
Thanks for throwing some cold water on a growing number of Climate Catastrophe hot chicken heads..
I don’t see how they say it is warmer. I looked at the plotted temp anomaly for Nov 16,2004 zonal latitude averages for the 1,975 meters depth. The plot was almost a straight line at minus 0.3C. The same plot but for Nov.16, 2019 gave another ~ straight line but at anomaly close to 0.00. The anomaly is defined as over the average of the 12 year period 2004 -2016. Sure it was slightly cooler in 2004, but as of Dec 2019 the trend anomaly is 0.00. AM I MISSING SOMETHING HERE OR ARE WE GETTING CO2’d again?
Salvatteci et al. 2018 used alkenone proxies to show unprecedented cooling of the seas off Peru, caused by a cooling Humboldt current from Antarctica,
https://agupubs.onlinelibrary.wiley.com/doi/full/10.1029/2018GL080634
Here is figure 3 from this paper, (d) is the ocean temperature off Peru.
This cooling is without equal over the whole Holocene, as fig. 3d shows.
Cool surface waters in the Nino 1-2 region off Peru is the key ingredient in the Bjerknes feedback underlying the ENSO. So a cooling Humboldt might have contributed to some of the very large classic type (not Modoki like 2016) el Nino events such as in 1072, 1982, 1997.
It’s curious however that although Salvatteci et al shows Humboldt cold supply to be ongoing, there have been no big classic (Bjerknes) type el Nino events since 1997. (2016 was an over-rated el Nino of the Modoki type – no engagement of the trades-upwelling Bjerknes feedback, and exaggerated by the change to Pacific SST baselines in 2014 which gave an artificial step up to Pacific, and global, temperatures.)
At the same time that Trenberth trumpets ocean warming, Judith Curry’s site is discussing the recent Dewitte et al. 2020 paper that comes to a different conclusion. These Belgian authors corrected CERES data for instrumental drift, and found the following:
Both earth’s overall energy imbalance (EEI) and the time differential of ocean heat content (OHCTD) have decreased after ~2000.
There is another attempt to reconcile Dewitte et al.’s finding with other recent OHC data by Pierre Gosselin:
https://notrickszone.com/2020/01/02/unsettled-scientists-find-ocean-heat-content-and-earths-energy-imbalance-in-decline-since-2000/
This also reinforces D19’s conclusions.
So it’s not really clear if the oceans as a whole are warming, cooling or static in temperature and what if anything this means in a climate that is always chaotically changing.
This is an important point, especially in light of the fact that two separate measurements must be examined and compared to arrive at what is referred to as the EEI, Earth Energy Imbalance.
And each of them are very difficult to measure.
There have been many separate projects which measure the TSI, Total Solar Irradiance, and although each of them has consistency over the time horizon of the study period for that device, there is very poor agreement from one set of measurements to another.
Here is a graphic showing some of these measurements of TSI:
http://lasp.colorado.edu/media/projects/SORCE/images/news_images/Fig_2-Right_Kopp_final_thumb.jpg
It is readily apparent that whatever the measured imbalance is, if there even is one, is a matter of interpretation, or deciding which data set one wants to use for the incoming part of the equation.
So when the ARGO data initially showed cooling, and this result was deemed incorrect, the data was massaged by various methods, mostly, it seems may be the case, by tossing out data points that showed cooling, until the result agreed with what was expected given the EEI.
If this is how the final results for ARGO data collection are being compiled, that would surely explain how the increases have been so incredibly steady on the part of the graph when the trend became monotonic in an upward direction. They just toss data until ARGO matches EEI!
Read this, then read it between the lines, and consider what it says about the results Willis critiques in this article.
These guys can get any results they want, and coincidently, their conclusions always agree with their prior assumptions perfectly!
They so smart!
https://earthobservatory.nasa.gov/Features/OceanCooling/
Oops, forgot the link…read this I said:
https://earthobservatory.nasa.gov/Features/OceanCooling/
Regarding “Let me close by saying that with a warming of a bit more than a tenth of a degree Celsius over sixty years it will take about five centuries to warm the upper ocean by one degree C … “: So, is this the top 2,000 meters? I haven’t seen anyone else using the term “upper ocean” to refer to that deep a layer of ocean.
Referring to a diagram of the total water column of the ocean, it is readily apparent that a vast amount of water exists below the 2000 meter line.
Here is one such diagram, linked below.
The average depth of the ocean, according to the most recent estimates (and this number changes with every estimate) is nearly twice 2000 meters.
Large areas, the so-called abyssal plains, are at 6000 meters of depth, and the trenches are in places well over 5 times as deep as the ARGO buoys sample to. Note as well that only some of them go to 2000 meters…many are in locations, at any given time, that are not that deep.
2000 meters is very deep, but not compared to the whole body of the ocean.
http://www.seasky.org/deep-sea/assets/images/ocean-layers-diagram.jpg
Here is another diagram, with more scale and additional details:
http://static4.businessinsider.com/image/53b30bda69bedd9c7b39a7d5-1200-/lakes_and_oceans_large.png
“Upper ocean” has a usual meaning of being the ocean above the thermocline. The thermocline is poorly defined in a few places and at least essentially absent in a few others, but in most of the ocean’s area it is identifiable and much closer to the surface than 2,000 meters down. An alternative meaning of “upper ocean” is the ocean that is not below a common depth of the thermocline, and as for numbers for that “one size fits all” I have heard 600 meters a little more than anything else, also 700 meters, and some common mention of 200 meters as a common thermocline depth. I am aware of some small thermocline existence as deep as 1800 meters, but 800 and 1000 meters are examples of numbers cited as below the thermocline in most of the area of the oceans. In a WUWT article more recent than this one (a 1/18/2020 reposting from drroyspencer.com by Charles Rotter), 2000 meters down is referred to as “deep ocean”.
And one more, with less vertical compression in the scaling:

As I have stated before, I prefer the metric of megachicken (the heat generated by 1M standard chickens) or gigaweasel (heat from 1B weasels) when it comes to ocean heat content.
If you want to compare the CO2 forcing with the atmospheric/oceanic response you need to use the time-rate-of-change of the atmospheric/ocean heat content. The following graphs show that the observed rate-of-change of the total ocean heat content is consistent with the observed rate-of-change of the atmospheric heat content.
h/t Javier
I believe that this is strong evidence that most of the warming of the oceans and the atmosphere in the late 20th and early 21st centuries is not being driven by CO2.
Catherine Zeta-Joules IS hot; maybe it her fault.
Good piece of work. Thank goodness all that energy has gone into the oceans. Imagine what the temperature of the atmosphere would be if it had gone there.
Regarding error bars of global Sea Level monitoring: If the widely publicized (scary) signal is SL rise of 1-3 mm/yr, can this be determined with confidence if the uncertainty in satellite obs is 3 cm? How about signal to noise issues? More ‘homogenizing’ like the air temperature fudges?
It seems impossible but the following item appears to have been drawn from the same paper:
https://www.sciencealert.com/the-ocean-is-warming-at-a-rate-of-5-atom-bombs-per-second-says-study
Any comment W ?