By Christopher Monckton of Brenchley
This will be a long posting, because it is necessary to nail the childish myth that global warming caused the bushfires in Australia. The long, severe drought in Australia, culminating in the most extensive bushfires in recent history, ought to have aroused sympathy for the cattle-ranchers who have lost their livestock and the citizens who have lost their homes. But no. Instead, those who profiteer by asserting that global warming is the cause of every extreme-weather event have rushed to state – falsely – that an “overwhelming scientific consensus” (to cite the Greens’ website) blames the incidence, extent, duration and severity of the drought and bushfires on the somewhat warmer weather caused by our having increased the atmospheric CO2 concentration by about 1 part in 10,000 from 0.03% to 0.04% by volume.
Nearly all of the news media have taken the line that capitalism in general and the non-socialist governing coalition in particular are to blame. Nearly all have failed to mention the true causes of the current firestorm.
Some years ago I spent a couple of weeks on a livestock ranch high in the hills north of Adelaide. The rancher, Peter Manuel, and I rounded up sheep and cattle using off-road motorbikes. I got to see the state of the land at first hand, and I asked two crucial questions.
First, I said, why was there so much uncleared scrubland all over Australia? After all, the national poet, Dorothea McKellar, had written in My Country as far back as 1904:
I love a sunburnt country
A land of sweeping plains,
Of ragged mountain ranges,
Of droughts and flooding rains.
Drought, then, is not exactly a new phenomenon in Australia. And with drought comes fire. Indeed, the aborigines or First Nations, or whatever the fashionable woke soubriquet is this week, used to conduct frequent controlled burnings of the scrub on the forest floor, precisely to prevent the continent-wide bushfires that they knew from thousands of years’ experience were bound to occur otherwise.
In 1642 Abel Tasman wrote of the smoke in the sky and the scorched trees wherever his expedition landed. Captain James Cook described the same conditions in 1770. This deliberate burning created the grassland landscapes that dominated pre-European Australia.
There are four further methods of hindering the spread of bushfires: livestock grazing, mechanical clearance of the scrub to create firebreaks; damming streams to keep well-stocked reservoirs so that if a fire starts there is enough water on the spot to put it out; and policing the forests to prevent arson, some of it at the hands of environmentalist extremists trying to “raise awareness” of global warming. Thus, the prophylactic measures available are slashing, burning, grazing, damming and policing.
Yet the first four of these sensible and prudent measures are either banned outright or heavily over-controlled by environmental regulations. Peter Manuel gave me an example. A resident of a small settlement in the bush cleared a small amount of scrub on his own land around his own house. The enviro-Nazis of the local administration took him to court for illegal destruction of valuable natural vegetation. The court – for custard-faced judges these days are increasingly remote from mere reality and easily infected by barmy environmentalism – fined the blameless villager $100,000. Not $100. A breathtakingly disproportionate $100,000.
The innocent citizen got the last laugh, though. A bushfire raged through the district the following summer, destroying every single house, barn and steading in that settlement, except his own, which survived unscathed. And did They refund his $100,000? No, of course not.
Worse, They did not learn the lesson from this incident, which is that the aborigines knew what they were doing because they had been doing it for hundreds of generations. The enviro-zombs, despite the anxious pleas of groups such as Peter Manuel’s Farmers’ and Landowners’ Group Australia, have hitherto refused to alter their insane policy.
It is the savagely-enforced banning of scrubland clearance – a ban enthusiastically endorsed over and over again until very recently by the climate Communists at the dismal Australian Broadcasting Commisariat – that is the direct and principal cause of the extent of the damage from this summer’s bushfires. The ABC has recently been pretending that it had never argued against scrub clearance. According to several accounts, it has been disappearing the many past video clips in which it had done just that. The memory hole has been working overtime.
That is not all. Peter Manuel showed me his own little dam, which held back a few thousand vital gallons from a tiny streamlet so that he could water his cattle and, where necessary, put out bushfires. He told me that the extremists in the State and national legislatures had passed laws requiring that Peter and his fellow-ranchers should pay for the rainwater that fell on their own land, and regulating the volume that they were permitted to retain, and requiring that in dry seasons they were to let the water out to keep the downstream ecosystem going.
Worse still, the so-called “Greens” and their shills in the civil service had let out most of the water from the giant dam that supplied all the water to the city of Adelaide, leaving the state ill-prepared to fight the large-scale bushfires that would inevitably arise the next time there was a widespread drought, and vastly increasing the cost of electricity.

What is more, Peter Manuel said that the environmental restrictions on keeping and running cattle were becoming ever tighter, making it more and more difficult to allow the livestock to keep the ground clear. In the very plainest terms, he told me that as a direct result of these policies, whose real purpose was to destroy ranching because ranchers did not vote Communist, the next big bushfire season would lay waste the land.
His chief criticism was not directed at the Communists but at the currently-ruling Liberal/National coalition – nominally somewhat conservative – which had failed to heed warnings from him and from many others throughout Australia that those who were hell-bent on destroying capitalism would instead destroy much of Australia herself unless their absurd environmental over-regulations were repealed wholesale and forthwith. Peter was so delighted at my support for his attempts to alert the dozy classe politique to the impending disaster that he was kind enough to name his prize bull after me. The disaster is now upon us, for the coalition did far too little to protect the people and the land.
Unsurprisingly, the environmental fanatics whose anti-scientific policies are directly responsible for that disaster are now desperately trying to cover their tracks by reciting over and over again their baseless mantra to the effect that there is an “overwhelming scientific consensus” that the bushfires are all attributable to capitalism’s sins of emission.


Recently an equity partner in one of Sydney’s largest stockbroking firms sent me the two “Charts of the Week” above. His firm had received these graphs from a financial data company (which, to spare its blushes, will remain nameless). CO2 concentration has risen. Temperature has risen. Therefore the former caused the latter. Thus ran the pathetically jejune argument in the data corporation’s propaganda sheet. Regular readers will by now be wearily familiar with this shoddy, shop-worn post hoc ergo propter hoc fallacy.
Now for the scientific truth. The first of many errors in the offending “Charts of the Week” propaganda sheet – errors each of which, significantly, points towards extreme exaggeration of what is in fact a non-problem, suggesting totalitarian prejudice on the part of the compilers – is to provide a visual comparison between an 800,000-year reconstruction of atmospheric CO2 concentration and a mere 120 years of observed temperature change.
The source of the 800,000-year CO2 graph is cryostratigraphy from the Greenland and South Polar ice-caps. Here, based on data in Jouzel et al. (2007), is the temperature reconstruction covering the same period and from the same ice-core data. Note that these data are presented, as is commonplace with data from geological time, recentiores priores: today’s temperature is at top left, and the temperature for 810,000 years ago is at bottom right. The data have been corrected to allow for polar amplification and thus to provide a respectable comparison with today’s global mean surface temperature, represented by the zero line on the graph.

It will at once be seen that, though on the CO2 graph the recent concentration appears as unprecedented in 800,000 years, on the temperature graph today’s temperature has been exceeded at the peaks of each of the past four interglacial climate optima over the past 450,000 years, during each of which CO2 concentration was below today’s.
Despite the CO2 concentration increase since 1950, there has been no corresponding spike in global mean surface temperature.
This absence of a pronounced spike in temperature to match the pronounced spike in CO2 concentration would suggest to a fair-minded observer that the imagined connection between that CO2 spike and the modest recent increase in global temperature is imaginary. That fair-minded observer might want to go back rather further in the temperature record, to see whether the link between CO2 and temperature is evident throughout.

The above 4.6-billion-year record (time on a log scale) compares CO2 concentration (in purple) with global mean surface temperature anomalies (in blue).
It will be seen that in the Cambrian era, about 750 million years ago, CO2 concentration peaked at 0.7% of the atmosphere, 23 times the 0.03% in 1850 and 17 times the 0.04% today, and yet temperature was 1-2 K below today’s. How come, if CO2 is the tuning knob of the climate?
Temperature and CO2 for the most recent 450 million years (I remember them well) are compared below. Again, there has been no spike in temperature to match the spike in CO2:

Given that the data relied upon are chiefly from Greenland, it is worth examining the changes in CO2 concentration compared with changes in temperature at the summit of the Greenland ice sheet over the 10,000 years since the end of the last Ice Age:

It will be seen from the above graph, which was the late Bob Carter’s favorite, that the concentration of CO2 has risen throughout the past 8000 years, and yet the temperature at the summit of the Greenland ice sheet has fallen over the same period.
It is also noteworthy that today’s temperature was exceeded by up to 3 C° in each of the four previous warm periods – the Mediaeval, the Roman, the Minoan and the Holocene (10,000 to 6000 years ago), during which temperatures were above today’s for 4000 years, aside from a brief drop to a little below today’s temperatures about 8200 years ago. From these graphs, the fair-minded observer would deduce that there is nothing unprecedented about today’s temperatures.
We now turn to the temperature record since 1880, presented in the propaganda sheet as though it were somehow terrifying. The warming appears alarming thanks to one of the oldest of all statistical frauds – stretching the y axis. Precisely the same data, plotted on an unstretched y axis, are unremarkable, which is unsurprising given that in absolute terms the global temperature has risen by one-third of one per cent since 1880:

Has the world warmed? Yes, it has. However, closer examination of the temperature record over the past century or so demonstrates that the rate of warming that began with the naturally-occurring Pacific Shift in 1976 has two precedents since 1900: and yet it is only in the third of these periods that the influence of Man could in theory have been significant:

The above graph (without the yellow arrows) was published thrice in the Fourth Assessment Report (2007) of the Intergovernmental Panel on Climate Change, which falsely concluded on each occasion that the rate of global warming was accelerating, and that we were to blame. The three yellow arrows superimposed on IPCC’s graph show that conclusion to be false: all three are parallel to one another.

However, the fraudulent statistical technique adopted by the Panel – inappropriate comparison of multiple trend-lines with varying starting-dates – could equally be applied to a sine-wave (which, by definition, has a zero trend), so as falsely to demonstrate that the sine-wave exhibits a rising trend, as the above graph shows. IPCC refuses to correct this error, from which we may legitimately infer that it is deliberate.

The above graph shows the temperature record in detail, and also demonstrates the least-squares linear-regression trend – the simplest guide to how fast the world is warming. The rate turns out to be a less than exciting 0.5 Celsius degrees per century, or less than nine-tenths of a degree over the past 170 years. What is the rate of warming predicted by the current models? The propaganda sheet does not enlighten us. Here is the answer:

Projected midrange Charney sensitivities (warmings in response to doubled CO2: CMIP5 3.35 K, orange; CMIP6 4.05 K, red) are 2.5-3 times the 1.4 K (green) to be expected given 0.75 K observed global warming from 1850-2011 and 1.87 W m–2 realized anthropogenic forcing to 2011. The 2.5 W m–2 total anthropogenic forcing to 2011 is scaled to the 3.45 W m–2 estimated forcing in response to doubled CO2. Thus, the 4.05 K CMIP6 Charney sensitivity would imply almost 3 K warming to 2011, thrice the 1 K to be expected and four times the 0.75 K observed from 1850-2011.
Nor can it be said that the rate of global warming since 1950 has been unprecedented. The fastest rate of warming in the recent record was in central England between 1694 and 1733, at a rate equivalent to 4.33 C°/century:

Note how small the warming is when compared with the annual fluctuations in temperature.
Let us compare that period with the “Anthropocene” 40-year period from 1979-2018 in the same dataset. The warming in central England has been equivalent to only 3 C°/century. Is that a bad thing? No. In our miserable climate, we want all the warming we can get.

At present, global mitigation policies are based not upon the unexciting observed or expected warming but on the predicted warming, which is currently thrice what is to be expected and four times what has been observed. Only 0.3% of 11,944 climate papers published after peer review in the 21 years 1991-2001 stated that recent warming (what little of it there has been) was chiefly manmade. It is likely, therefore, that our influence on temperature is very small.
Finally, the propaganda sheet says that 11,000 “scientists” have issued a statement that the mild warming we are likely to cause will drive “catastrophic” consequences unless the West is shut down. These “scientists” included Donald Duck and Mickey Mouse. Nearly all have no record of publication on climate. The supposed “11,000 scientists” statement was cobbled together by the usual suspects in response to a statement that there is no “climate emergency” by 800 proper scientists and researchers, all of whose names and qualifications were vetted before inclusion,. Most of the 800 have published on climate and related subjects.
What, then, has been the warming in Australia? Usefully, UAH provides Australian data for the past 31 years:

For comparison, here is the UAH 31-year record for the world as a whole:

Thanks to poleward amplification, the warming in Australia was equivalent to 1.86 C°/century, compared with the global rate of 1.32 C°/century. Since there is no consensus on the extent to which Man has contributed to recent warming, cripplingly expensive measures piously intended to abate CO2 emissions and hence mitigate global warming may not make much difference to global temperatures.
The “overwhelming scientific consensus” of which the frantic Thermageddon fanatics so often speak does say that warmer weather will influence the incidence, duration and severity of forest fires. However, that “consensus” is to the effect that a warmer atmosphere can carry near-exponentially more water vapor as it warms, making droughts less likely, not more likely. The Clausius-Clapeyron equation, one of the very few proven results in the slippery subject of climatology, mandates that a warmer atmosphere will be a moister atmosphere.
So much for the theory, which is not in doubt. But what of the observed reality?

Sure enough, the atmospheric layer at the surface (the red arrow on the above graph) shows an increase in specific humidity precisely in line with Clausius-Clapeyron.
Since specific humidity has increased, one would expect – at the very least – no rising trend in drought intensity globally. Indeed, the Palmer Drought Severity Index shows no trend in more than a century:

The global land area under drought has not increased either. It declined throughout the 30 years to 2014, when the most comprehensive survey ever was conducted:

Since droughts have not increased either in severity or in land area affected, one would not expect forest fires to have increased globally. One would expect them to have declined. And that is just what has happened:

Viv Forbes draws the following conclusions from the scientific evidence:
“Misguided tree lovers and green politicians have locked the gates on ever-increasing areas of land for trees, parks, heritage, wilderness, habitat, weekend retreats, carbon sequestration etc. Never before on this ancient continent has anyone tried to ban land use or limit bush fires on certain land.
“The short-sighted policy of surrounding their massive land-banks with fences, locked gates and fire bans has created a new alien environment in Australia. They have created tinder boxes where the growth of woody weeds and the accumulation of dead vegetation in eucalypt re-growth create the perfect environment for fierce fires.
“Once ignited by lightning, carelessness or arson, the inevitable fire-storms incinerate the park trees and wildlife, and then invade the unfortunate neighbouring properties.
“Many of today’s locked-up areas were created to sequester carbon to fulfil Kyoto obligations. Who pays the carbon tax on the carbon dioxide released to the atmosphere by wildfires?
“The green bureaucracies and politicians are clearly mismanaging their huge land-bank. Aborigines and graziers did a far better job. There should be a moratorium on locking up any more land and a return to sustainable management for existing land holdings.”
Amen to all that. In due course, the drought in Australia will be replaced by the “flooding rains” of which her national poet wrote. A few years back, the ridiculous then climate Commissar of Australia, Tim Flannery, predicted that thanks to global warming the great river systems of the Murray-Darling basin would never see normal flow again.
Within months of that fatuous, ill-informed utterance, I visited Australia and brought some Scottish weather with me. So much rain fell on Australia that global sea level actually fell for a few months, and the entire river system was brimful.
Let us end, then, with Dorothea Mackellar’s words as much of hope as of history:
Core of my heart, my country!
Her pitiless blue sky,
When, sick at heart, around us
We see the cattle die:
But then the grey clouds gather,
And we can bless again
The drumming of an army,
The steady, soaking rain.
But Russell Crowe is Australian and obviously knows better, mi’lord. Crowe’s statement today in accepting a Golden Globe award in abstentia:
“The tragedy unfolding in Australia is climate change-based. We need to act based on science, move our global workforce to renewable energy and respect our planet for the unique and amazing place it is. That way we all have a future, thank you.”
Crowe is a Kiwi.
I think we kind of adopted him…
With statements like that from Crowe, you can have him. As prime minister Muldoon once stated, it will improve the intelligence of both countries.
Regards
Are you not entertained?
He was tight, that’s why there is a corner on the Rimutaka Hill road called Muldoon’s corner, and it is tight.
You mean there’s a difference?
I think there is a difference in the number of sheep…
Patrick why do famous people such as actors, journalists and others whom have enjoyed success in the public arena think that what they have to say is of extreme importance?
They are pure and simply just ‘people’ who are very good at their jobs, and for that I respect them. I am happy to pay to watch their movies and I have been swept up in the way they can take me to places with their craft. But I am not in the least interested in their private lives, how many children they have, who is sleeping with who or are now divorced because of it. I do not care about what should be their private lives and most of all I do not want to here their personal opinions.
Being famous does not mean that you are all knowing or have supreme wisdom. Being famous does not give you the right to insult our Prime Minister as some have done, or pass judgement and assume knowledge about how our country should be run.
Unfortunately the famous leftists enjoy something that we have been denied for some time now, ‘true freedom of speech’ (even if their speech isn’t always true) and easy access to speak out MSM.
The other unfortunate thing is that like skeptic scientists, right of centre actors (if there is such a thing) and other famous people, are afraid to publicly speak their views. They want to keep working, I get that.
You sound just like listening to SKY NEWS PROGRAMS
SKY NEWS PROGRAM
why is it alright for them to comment on CLIMATE CHANGE
Err, no. Are they back on telly?
Steve; Is the argument wrong?
I highly doubt that most of these ‘celebrities’ have any real concern about anything. They simply follow whatever the most popular meme of the day is in order to promote their own image reflecting whatever the MSM applauds or, if they are already riding high in the success stakes, are bought and paid for to do it, even if it is only in kind. Their agents, managers, advisors and even the cat next door would not allow them to do anything else. Their ‘concern’ is as false as the roles they play IMO.
Most of the people who go into entertainment, do so because of a psychological need to have other people pay attention to them. As a result they quickly latch onto any cause that they view to be popular.
So true! They have been told for so long how wonderful they are they assume everything that comes out of their mouths are the words of a sage. They are still playing the ”role” when the movie ends.
It’s quite nauseating to watch.
My guess is they are celebrities and are recognised by most easily. What most people don’t get though is they are great at “following scripts”…and that is all.
Actors and other celebrity “influencers” are paid public speakers. There’s nothing outrageous about assuming that that’s precisely why they are speaking in public about various issues.
And these statements are from people who make their living pretending they are other people. Put that in your pipe and smoke it…
“Put that in your pipe and smoke it” Joe you are the second? person to use that phrase to me in the past week. Doesn’t offend me, I just find it an odd response.
Good point! Why should an actor’s opinion be taken more seriously than a hairdresser’s or shop assistant’s?
We can hardly claim him as he was a kid when he moved there and I don’t want to. :))
“Crowe is a Kiwi.”
He’s a fruit?
Flightless bird.
Was that before or after Rick Gervais’s comment?
https://www.mediaite.com/entertainment/ricky-gervais-torches-hollywood-elite-in-scathing-globes-opener-youre-in-no-position-to-lecture-the-public-about-anything/
Here’s a longer clip that’s worth a look.
https://twitter.com/bennyjohnson/status/1214003226938351617/video/1
now that
WAS FUNNY!
thanks I got a good laugh
… move our global workforce to … China! Already being done!
Russel Crowe is an actor therefore his opinion has value.
What would Lassie say?
Shouldn’t that be Skippy the bush kangaroo? Or for some British readers of a certain age , Tingha and Tucker?
Don’t forget Willy Wombat. Aunty Jean Morgan would never forgive you.
https://youtu.be/N5XcsMDhmXE
Mr. Ed, the talking horse, was more erudite.
Perhaps this quote is applicable to actors as well:
“If you’re listening to a rock star in order to get your information on who to vote for, you’re a bigger moron than they are. Why are we rock stars? Because we’re morons. We sleep all day, we play music at night and very rarely do we sit around reading the Washington Journal.”
Alice Cooper
Simple question: What activism has Mr. Crowe himself performed to move the movie/entertainment industry as a whole to shifting ASAP to green, renewable energy sources to power that industry.
Has he followed the great example of Greta Thunberg and started traveling around the world using only sailboats? If not, why not?
He was wonderful as Captain Jack Aubrey on the great sailing ship Surprise in the movie “Master and Commander”!
As a climate scientist? Not so much
That performance wouldn’t make a list of top 100 all time. But if he moved you, he moved you.
Wonderful example of a medical impaired school drop out ?
You got to be joking Mr Dressler.
Patrick,
Uhhh . . . from what “medical impaired school” did Greta drop out?
Hint: there are outright jokes and then there is sarcasm, some of it perhaps too subtle.
… it is odd he did not add a wish for world peace. You know all in politically correct.
The big news for the Golden Globes was the media’s reactions to Rick Gervais jokes which made fun of Hollywood.
Ricky Gervais reminded the packed room that, “No one cares about movies anymore,” and advised, “If you do win an award tonight, don’t use it as a platform to make a political speech. You’re in no position to lecture the public about anything. You know nothing about the real world.”
It’s rare that I would agree with anything Ricky Gervais says. I find him a contemptible example of the species at best. This time however, I found it hard to disagree with a lot of what he said.
Once again Hollywood cannot pass on any opportunity to demonstrate its remoteness from reality
…knocked it right out of the park…..thank you!
I completely agree, in depth and to the point; very well written.
There is an issue which bugs me when one discusses climate globally. The global climate has never been nor ever will be the same in all locations.
Relatively small geographic features can have a significant influence.
Example, Fairbanks, AK was not under a glacier during the last ice age due to mountains and weather patterns.
Another example, the opening and closing of the Bering Strait, during ice ages, impacts Atlantic currents etc.
Australia is impacted by ENSO, SOI, conditions in the Indian Ocean etc. These conditions have a unique impact on that region. So mitigation needs to account for specific regions.
Perhaps Bill Gates flotilla of ships jetting water vapor thousands of feet in the air during dry seasons is a thought for Australia.
The Cambrian is a period, not an era, and it began about 541 million years ago, not 750.
It’s the first period of the Paleozoic Era of the Phanerozoic Eon.
The problem with this post and any post that attempts to prove CO2 is not at fault, is it’s impossible to to prove a negative. You cannot prove God does not exist and will be attacked by the absolute faithful of God, and you cannot prove CO2 does not warm the climate and will be attacked by those faithful climate alarmists as well. It does no good to attack a faith.
Fair minded sensible people (i.e. often referred to as skeptics) who understand how science works know the burden of proof is on PROVING CO2 causes alarming amounts of warming – something that to my knowledge has never been done. Climate alarmism goes something like this – imagine the world is on fire, now what shall we blame?
Lord Monckton of Brenchley’s remarks ought to cause reasonable people to stop and take stock of their beliefs – are they reasonable or unfounded? But as always they will appear to a skeptic as well thought out and written, and to the alarmists as heresy. It’s like arguing with the wind.
Still, I enjoy his thoughts as always – they help me stay sane. Well said.
Dear Robert of Texas
Good point. Well made. My pet peeve. We skeptics tend to fall for shifting the burden of proof fallacy. When the other side makes unsubstantiated claims we jump in and try to prove that it aint so instead of demanding proof of attribution. As in this post for example
https://tambonthongchai.com/2020/01/04/tbgy-extreme-weather-lecture/
From Marilyn Vos Savant’s Parade Magazine piece today:
What is incorrect with this post is this statement:
“Indeed, the aborigines or First Nations, or whatever the fashionable woke soubriquet is this week, used to conduct frequent controlled burnings of the scrub on the forest floor.”
The aborigines did not use controlled burns, they just started fires.
They did not form a committee
They did not go on public funded fact finding holidays overseas
They did not listen to groups that wanted to imitate Koala’s
They just burned the bush
They did it to keep fire sticks burning
They did it to hunt game
They did it to attack other family groups
They did it to escape other family groups
They did it to light additional fire sticks when bad weather approached
They did it to cook
They did it to keep warm
And what they didn’t do is run around bare foot to put fires out. Their way was not to control but to live with fire. Grass fires did not climb trees and kill Koala’s, Koala’s were quite happy to stay in a tree and watch fires from the safety of their trees.
I live in Australia and I see the build up of forest litter leading to what can only be seen as a reset for Australia.
We just have to hope that the politicians we have elected are smart enough to continue this burn each and every year in Australia to get the country back to where this great country should be.
Good to here some common sense in regards to our Australian aboriginals Ron.
I have taken the time to speak to full blood aboriginals living in the Red Centre. I assume you speak from knowledge gained first hand. The spinifex grasses are brutal on bare skin, my Walpiri friend told me that burning off the spinifex made it easier to hunt and to get around generally.
Of course when I say I spoke to aboriginals, people assume that they are all educated and that they all speak English. This is not the case, and they don’t all speak the same language either, there are many tribal languages. And before you (being the readers Ron, I’m guessing you already know) go being appalled about our indigenous people not being educated, you need to know that it’s very complicated. On the whole people here in Australia feel that the only way for aboriginals to have a better life is through education. But sadly there are leftists here in Australia, including educated aboriginals who want to keep things as they are, it’s easier to manipulate ignorant people.
Our indigenous people should not be lacking financially, apart from a very generous welfare system for those who can’t work (lack of education and no English language) the communities receive, sometimes very large royalties from mining. This is one of the reasons there are those who prefer to keep them ignorant, and to a large degree it’s their own people, corruption and greed prevail.
Sorry moderators I’ve gone off topic, started with fires though and following on from Ron’s comment the truth about aboriginals and fire. There are alot of misconceptions.
“it’s impossible to to prove a negative”
Right! The only possible proof is the consistent demonstration of an alternative explanation or theory. Demonstrating flaws in the rationale and replacing them with correct statements. Then putting all things together as an alternative explanation and confront both with what happens in the real world (no models, please: use just obeservalble facts).
Please, you don’t seem to understand the facts presented. In scientific way.
Oh dear.
In response to “Robert of Texas”, the head posting made no attempt to “prove CO2 is not at fault”: it did, however, demonstrate that demonstrated that physics would lead us to expect more moisture in the warming atmosphere and hence less drought; that the moisture in the atmosphere has indeed increased over the past 30 years; and that the area of the Earth under drought has duly declined over the same period.
Therefore, if CO2 causes warming, the more of it we put in the atmosphere the less drought we can expect.
“the childish myth that global warming caused the bushfires in Australia”
Humans, even adult humans, are naturally superstitious. And the superstition mechanism creates strong and unshakable confirmation bias and the bigger the fear the more unshakable it gets. This is why we have things like snake oil and why fear based activism works. Two links below:
The superstitious nature of humans
https://tambonthongchai.com/2018/08/03/confirmationbias/
How the superstitious nature of humans is exploited by climate activists
https://tambonthongchai.com/2020/01/04/tbgy-extreme-weather-lecture/
“If you believe that elves make the rain, then every time it rains you will see proof of elves.” -Ariex
I do not know who Ariex was, but we can apply his wisdom to our current situation: if you are taught that man-made CO2 causes catastrophes, then every environmental disaster will seem like proof of CAGW.
And while I read this I hear on the ”news” that Russell Crow has taken his Golden Globe win as an opportunity to spout…….. ”make no mistake – this is climate change” and our State Premier saying…… ‘this is the new normal, fire seasons are getting longer and we will continue to see increasingly bad fire conditions in the future.”
WHERE IS THE EVIDENCE??????? Answer, there is none.
The gulf between reality and the doomers grows wider each day.
Hi Mike, – Well GoldenGlobes host Ricky Gervais’ monologue adressed the participants with: “You’re in no position to lecture the public, you’ve spent less time in school than GretaThunberg!”
For evidence they rely on the BoM/CSIRO report of bushfires since the 1970’s. It is so much easier when you limit the range of your conclusions.
If only something could convince the arsonists to set their fires in cold, damp seasons. Fuel build-up problem solved.
No, not really.
A fire set in cold, damp conditions will soon go out, leaving all the built-up fuel still there to be ignited when it’s dry and hot, to be ignited by, for instance, lightning or other natural causes.
That depends on how cold and how damp.
The fire could also burn for awhile, but never get out of control.
That’s why they do controlled burns during the times of the year when it is cold and damp.
The aborigines burned Australia. That’s how they lived. Fire agriculture. You either burn the bush in the wet season with controlled, prescribed burns. Or it will naturally burn and reduce fuels in an uncontrollable manner.
There is no third way.
Fire was used to manage many environments by hunters and gatherers the world around.
Pretty sure lightning did a lot more on a national scale than any sparse population of Aboriginals.
Not so. The sparse population of aboriginals lived in small groups and were frequently moving, starting fires as they went. Read Bill Gammidge’s book, “The Greatest Estate on Earth”.
thank you!
lightning strikes would have still created huge wildfires regardless of what piddling areas the aboriginals burnt selectively
and for Ken Stewart below
theyre trying to make claims the aboriginals lived in aus and survived the ice age and that there were a million or so f them before nasty whitey arived
roflmao everytime abc runs this drivel
Thought it was just me , but a mate also queried wtf? is going on? abc running so many aboriginal support and sledge whiteman segments
looking like the half that isnt gay there is dark complected
or white with supposed ancestry and throw in a few tarnsgender confused as well
diversity ya know.
Yeah, love the logic with the ABC
Can’t burn because it will release CO2
Country burns anyway
Runs an article on how Indigenous land management is amazing and uses fire to spiritually nurture the land
So the take home message is that white people’s fire contains CO2, but indigenous fire does not
Anyway, cyclone season will bring the floods and we’ll be all green once more and do it all again next year.
I doubt they were controlling any of their fires.
Christopher Lord Monckton
Thanks for your clarifying reality check pragmatic perspective.
PS Recommend using the corrected Clausius-Clapeyron-Koutsoyiannis equation.
Demitrius Koutsoyiannis has identified “an inconsistent assumption that the latent heat of vaporization is
constant. Removing this assumption and using a pure entropy maximization framework we obtain a simple closed solution, which is both theoretically consistent and accurate.” Koutsoyiannis’s correction to the Clausius-Clapeyron equation that eliminates a quadratic error vs data.
Koutsoyiannis D. Clausius–Clapeyron equation and saturation vapour pressure: simple theory reconciled with practice. European Journal of physics. 2012 Jan 10;33(2):295. PDF
http://www.itia.ntua.gr/en/docinfo/1184/
Prof. Humlum’s graph above is ‘interesting’. It shows specific humidity increasing at the surface. You would expect that with a rising temperature evaporating more water and able to hold more water.
Water vapor is lighter than air and you would expect it to rise.
The top curve is for a pressure of 300 mb. That’s still in the troposphere. As far as I can tell, the top of the troposphere is 200 mb.
Why is it that the specific humidity at 300 mb goes down over time?
Of course we live on a rotating sphere, not a 1 dimensional model. The process at the equator are not the same processes in the arctic, nor in the antarctic for that matter. Average global figures can be misleading.
My brain hurts. missing hot spot
The reason why “specific humidity at 300 mb goes down over time?” was explained by Dr Bill Gray.
http://tropical.atmos.colostate.edu/Includes/Documents/Publications/gray2012.pdf
Thanks for the excellent link. It’s been cited on WUWT before but probably merited its own story.
The Clausius-Clapeyron equation has many simplified forms. However, the original equation dP/dT = deltaS/deltaV is exact in the limit of small changes in temperature. It was derived directly from the fundamental laws of thermodynamics. The inexactness comes in when the equation is integrated over a temperature interval since the right-hand side of the equation is also a function of temperature, but usually not known independently.
The change in volume is often approximated by just the volume of the gas phase since the volume of the liquid is so much smaller, and then the ideal gas law is used to give dP/dT = PdH/(T^2*R). This approximation is reasonable at low pressure where most gasses act like an ideal gas.
The great application of this equation is to show that the log of the vapor pressure of a material is close to a linear function of 1/T in absolute temperature. All modern vapor pressure equations stem from this relationship, adding adjustable parameters to account for the nonlinearity. The first was the Antoine equation, lnP = A – B/(T+C), which fits the vapor pressure of most liquids quite well from near their freezing points to above their normal boiling points.
This all connects to climate in that the water content of air at terrestrial conditions is closely approximated by the vapor pressure of water at the temperature of interest divided by the total pressure. This is used to calculate relative humidity, which defines the driving force for further evaporation and precipitation.
In good form My Lord.
I doubt the facts behind this will be widely published but, who knows?
If the Donald reads this blog maybe other world leaders do too.
Just a comment to enhance general knowledge:
Large farms in Australia and New Zealand are called “stations” not ranches. I have no idea how and when the term originated.
In a large continent like Australia, in any one year there are likely to be areas experiencing near-record drought, while another location experiences near-record rainfall. This provides regular juicy ammunition for alarmists.
While mean rainfall records for the entire country are useful they don’t relate that well to fire susceptibility in any given location.
None of this is rocket science. One just needs to observe and think. Talking to old-timers helps too.
Cheers
M
I suspect Lord Monkton used wording that would be more readily understandable by denizens of the Northern hemisphere since that is the intended audience for this (excellent) article.
The only good thing to come out of the catastrophic fires down here is that the inner suburban, green warmists have overplayed their hand and rightfully pi$$ed off rural resident and authorities have begun to call out the fraudulent theorising and criminally dangerous “land management” practices that are the base cause for the intensity of the current fires. Even the MSM have been forced to acknowledge the counter arguments (often trying to use “aboriginal practices” to mask their backtracking).
Sorry, that should have been “Lord Monckton“
Michael, I wonder if the term ‘station’ came about because that was where our original communication centres were,’Telegraph Stations’. I know of at least one in Alice Springs which has been restored beautifully.
You’re right about the propensity to average temperature and rain and such in Australia. Meaningless really. We have it all here! Probably not too many people overseas realise just how vast and diverse we are. That we can have monsoons and floods in the north and at the same time the droughts we are experiencing in other parts of Australia. That we have rivers such as the Todd River in Alice Springs that are nothing more than sandy banks for years, and when they do flow they are a joy to behold (unless of course they break their banks, which also happens from time to time).
Sure we need to be respectful of nature, but it’s pure arrogance to think we can control it and by doing so on the scale that we are is not going to end well.
Megs – have you read “The Cattle King” – about Henry Kidman ?
He made his millions by buying cattle in the far North then droving them down to Central in anticipation of the underground water form The Wet arriving around the time the cattle did. Fascinating.
Cheers
M
Thanks Michael, I’ll look for that one 🙂
Well said
I think it goes back to the earliest days of colonial Australia when the original ‘stations’ were clusters of buildings, at least partially military in character. That is what I had always understood, but I can find no references to support this.
Michael Carter is correct In a continent such as Australia rainfall numbers vary across the continent
I have a 20 acreheavily timbered property in the centre of the southern state of Victoria near the spa tourist town of Daylesford
In a year where drought has gripped wide areas to the warmer northern states the rainfall for 2019 at my place was 900 mm or about 35 inches –
The term originally applied just to what in the US is called the “home place”, but then was extended to refer to the whole operation.
The article, and especially the technical part, is excellent, but seeing “ranch” and “rancher” grated on me, too.
I also got a bit weary of seeing “communist”. It makes Lord M sound like a paranoid American of the 1950s.
Though perhaps he is writing for paranoid Americans.
Excellent article, Lord Monckton!
However.
We are an appreciative audience for details. Your target audience is highly deficient regarding details and attention spans.
Perhaps a simpler article for politicians and alarmists?
Are you suggesting a crayon drawing?
I thought this was a simple but effective article.
“Thanks to poleward amplification, the warming in Australia was equivalent to 1.86 C°/century, compared with the global rate of 1.32 C°/century …”.
Some credit is due also to the BoM for their assiduous application of temperature ‘adjustments’ to raw data recorded many decades ago that curiously always seem to have increased the overall trend.
@chris Hanley
“Thanks to poleward amplification, the warming in Australia was equivalent to 1.86 C°/century, compared with the global rate of 1.32 C°/century …”
Lord Monckton, comparing a land area to land/ocean? Hmm….the phrase “apples to oranges” comes to mind.
If you compare apples to apples, the trend in Australia matches the global average PERFECTLY:
“The linear warming trend since January, 1979 remains at +0.13 C/decade (+0.11 C/decade over the global-averaged oceans, and +0.18 C/decade over global-averaged land)”.
https://www.drroyspencer.com/2020/01/uah-global-temperature-update-for-december-2019-0-56-deg-c/
********
“Some credit is due also to the BoM for their assiduous application of temperature ‘adjustments’ to raw data recorded many decades ago that curiously always seem to have increased the overall trend.”
The temperature ‘adjustments’ to UAH data have always DECREASED the overall trend. Are you only curious when the changes are not to your liking?
I forgot to mention….. the 1.86 C/century figure comes from UAH, not the BoM.
You need to get your conspiracy theories straight.
My mistake, I read the text without referring to the chart, of course the UAH record is probably the most reliable record because it has the least adjustments.
I’m not sure which are greater, but for example, the UAH LT for the year 1998 was initially reported to be + 0.424 C.
https://wattsupwiththat.com/2011/01/03/uah-global-temperature-anomaly-published-1998-still-warmest-year-in-the-uah-satellite-record/
It has since been adjusted upwards to + 0.48 C
More recent years have been adjusted downwards, decreasing the long term trend.
*****
I am not saying the adjustments weren’t necessary, just pointing out another example of confirmation bias – an adjustment is only suspicious if the trend gets steeper.
an adjustment is only suspicious if the trend gets steeper.
Conspiracy theory much?
“Conspiracy theory much?”
Not me, I am for the most part trusting of both the surface and satellite adjustments…..
was referring to Chris Hanley’s comment,
“Some credit is due also to the BoM for their assiduous application of temperature ‘adjustments’ to raw data recorded many decades ago that curiously always seem to have increased the overall trend.”
On the ground in Australia.
https://www.facebook.com/100009397722001/posts/2519957664994133/
” it is necessary to nail the childish myth that global warming caused the bushfires in Australia. ”
Wow, The Earl of obsfuscation tackles another strawman.
1. The consensus science is NOT that GW “causes” fires.
2. The argument is this
A) Hotter, Drier weather conditions, lead to MORE SEVERE FIRES, whatever caused the fire to
begin with.
B) GW can contribute to some increase in some locations of Hotter and Drier conditions,
whatever the cause of global warming is.
C) The current GW we see is caused by a combination of factors, natural and human.
D) C02 is a large PORTION OF the human-related causes of GW
Of course, the Earl of obfuscation wants to kill a strawman because it’s easy.
once again, Lord Monkfish, earl of Obfuscation, let me make it clear.
1. There is global warming. There was an LIA, and you should not try to deny it.
2. Global warming can have many contributing factors, both natural and human.
3. In periods of global warming ( whatever the cause) we can expect SOME areas to experience
hotter and drier conditions.
4. When a fire starts ( whatever the cause) in hotter and drier conditions, we can expect it to be worse that that same fire if it had started in colder wetter conditions.
So, imagine that the output of the sun increases and we get a warmer planet. It won’t happen everywhere at the same time, but some areas will experience hotter and drier conditions. If fires start in these regions, we can expect that fires will be worse, GIVEN that they have started (whatever the cause) In a scenario where increased solar output causes global warming I suspect no one would argue that the warmer weather COULD NOT CONTRIBUTE TO FIRE SEVERITY. Hotter drier conditions do not tend to make fires less severe, they tend to make them more severe. Global warming ( whether caused by man, or the sun, or unicorns) leads to hotter drier conditions in some areas. Thus, anything that contributes to global warming, also constributes to the severity of fires, GIVEN THAT the fiire started. And lastly, yes increased fuel load also contributes.
It is insanity to argue that solar caused global warming could never contribute to increased fire severity.
But your position implies such an insane argument. Finally, to the extent that human factors contribute to todays global warming, those human factors also contribute to hotter drier conditions in some areas, and those human factors also contribute to some portion of the increase in fire severity.
its nuts to argue that the globe isn’t warming
its nuts to argue that Australia is not seeing hotter drier conditions
its nuts to argue that these hotter drier conditions play NO ROLE in fire severity.
and its nuts to argue that man’s actions have no effect whatsoever on the global warming we observe.
that’s why its nuts to argue that AGW can have no effect on fire severity
Well said.
Well said??
Are you referring to the very childish ad hominem reference to “Lord Monkfish”? Does this pass as cutting edge humour in your neck of the woods? Pathetic.
Well it is Nick “I am a proud Greenie” Stokes.
“very childish ad hominem reference”
Lord Monckton prefers correct Latin. It is ad dominum.
Well said.
Indeed. So many strawmen getting around it starting to be a fire hazard.
The thing I want to know is where is “the giant dam that supplied all the water to the city of Adelaide”
that those sneaky greens emptied?
Bull from start to finish.
yes that bit DID make me ponder
but as Lord M is a pommy;-)
the flushing of the murray to the sea courtesy of the greens control of the water rights agreements pretty much forcing the waste of water that at this time would have kept animals and people with drinking water and some ag supply..and dam storages that fish could live in seems to fit the statement if somewhat skewed.
so we flushed the coorong and it went to sea and now theres none left to keep it or other areas watered.
and the mouth of the Murray has moved massively over the millenia from way up north near pirie right down to where it is now.
and if it clags up again when it floods it will carve a new mouth elsewhere.
steve’s article was nothing but strawmen.
”The giant dam” is the Snowy Mountains hydro scheme, which has a mandated environmental flow to the Murray River so as to keep the water fresh in coastal Lake Alexandra, at the expense of water being supplied to not only Adelaide but also drought affected farmers. Of which those sneaky greens are responsible.
” at the expense of water being supplied to not only Adelaide”
Absurd. There is no pipeline running from the Snowy to Adelaide. Instead, they take their water from the river at the nearest points, which are Mannum and Murray Bridge. They get whatever is let through the system, and can only benefit from upstream releases.
My uncle built the pumps for the Snowy scheme. They were so big that my father who was about 5ft 10in could walk through them without ducking.
Hi AussieCol and Nick,
I recently addressed this another comment – the recent releases from the Snowy Mountains Scheme for environmental flows mandated by greensand NIMBYs are to the Snowy River and thence out to sea; this doesn’t benefit South Australia in the slightest. The MBDC guarantees a minimum 1850 Gl per year shall flow over the South Australian border via the River Murray, but the typical flow is around 4800 Gl. The Snowy River Scheme, the circa 4000 Gl storage dam at Dartmouth and the 14 wiers are what guarantee perenial flows down the Murray and thus the reticulated water supply for much of South Australia (and anable vast irrigation schemes along the length of the Murray basin); without the current level of regulated flow, the River Murray could (and has many times prior to the artificialregulation of the river) run dry during summer. Messing around with environmental flows in the wrong direction certainly does have potential to undermine water supply in South Australia, but so far that’s not appreciably the case.
The idea that Lake Alexandrina ought to be kept fresh is quite absurd; the best thing for the lower lakes would be to demolish the Goolwa Barrages (whose raison d’etra is to prevent saline water ingress up river, prior to the erection of the Goolwa barrages, in dry years elevated salinty could be measured as far upstream as Swan Reach). A better solution would be a new (15th) weir downstream of Wellington to prevent the ingress of brackish water upstream into the river and restore Lake Alexandrina to a tidal lagoon as it was prior to 1940. The Coorong is a more or less static body of brackish water along a historical coast line and would not be un-naturally impacted if Lake Alexandrina and indirectly Lake Albert had their communication with the Southern Ocean restored.
Nick, are you suggesting that there are commenters on this site that haven’t got the faintest idea what they are talking about?
Thanks.
TFN
”Absurd. There is no pipeline running from the Snowy to Adelaide.”
Did I say anything about a pipe line ???
About the only thing absurd is your obtuse manner.
You two crack me up.
Did you read the article? Are you disputing the graphs?
As usual, steve is arguing against points nobody made.
As usual, nick and the other trolls are impressed by sophistry and evasion.
Oh right, Stokes/Mosher (about the same). Using FFs caused the fires, not weather, periodic drought & ignition sources (many intentionally or not from people).
”And lastly, yes increased fuel load also contributes.”
And yes the more the fuel increases the more severe the fire. In catastrophic circumstances there can be a temperature differential of 10 degrees C. IT IS THE WIND TOGETHER WITH LOW HUMIDITY THAT PROPELS THE FIRE, NOT TEMPERATURE. So what have we experienced with AGW? 1 degree in the last 100 years? So you tell me Steve, how does 1 degree alter catastrophic fire behaviour? Well it doesn’t.
Locking Eucalypt forests up with no plan to manage fire mitigation is asking for disaster. As has been shown by Willis, we have bad fires, we rush around and reduce the fuel load for a few years, then we forget, until the next big one, then the cycle starts again. In the 60 years of witnessing big fires I’ve seen it time and time again. We never seem to learn. Complacency can be a curse.
AussieCol, here, here cobber.
I lived in the Adelaide Hills during the 1983 Ash Wednesday bushfires. I recall the clean gutters, trimmed shrubbery and frequent burn offs in about the three years following the fires. By five years down the track fire prevention was clearly being forgotten if the gutters full of dead leaves and overhanging trees were anything to go on, never mind that sprinklers started becoming conspicuous by their absence on new houses.
And that was before the ecotards started ruling the roost and placed restrictions of the felling of ‘significant trees’, clearing your own land or getting permission for controlled burn-offs in spring.
Ernie we lived on the same suburban block for 39 years. The land had been cleared three years prior to our purchase of the property and the house was two years old. A triangle of our land backed on to bushland was too steep to landscape so we just focussed on keeping out lantana, pampas grass and cassia.
During that time we saw dozens of trees come and go, none of them planted, some of them more than ten metres tall! Casurina, gums, wattles and hakias. We had periods of drought and at times waterfalls flooding through our yard. The watercourse was redirected after one of those floods and the next drought that came caused a great deal of stress on the trees. It was expensive to remove the dead trees and it wasn’t long before something else sprouted up to take it’s place.
One of those trees was around five meters from the house this one was huge at around fifteen meters tall (it wasn’t there when we bought the house). We spent alot of money on that tree over the years, trimming off dead branches overhanging both our own and our neighbors houses. It had a split trunk and in high winds we feared that if it came down it would cause alot of damage or worse. You needed to get permission to trim more than ten% of the tree and it was almost impossible to get permission to remove it. Fortunately rules changed in regard to bushfire zones in recent years and you were a allowed to remove trees deemed a danger to life and in close proximity to a property. We had the tree chopped down, there was a massive termit nest that filled up most of the base of the tree!
My point here is that the Greens make a fuss about individual trees, but trees die! In ideal circumstances some species of trees can live for hundreds of years but even they die. An open space, a bit water and sunshine and it won’t take long before you have trees growing again, we couldn’t stop them. Must have been all that pesky CO2.
aussiecol says:
IT IS THE WIND TOGETHER WITH LOW HUMIDITY THAT PROPELS THE FIRE, NOT TEMPERATURE.
Yes, bears repeating (especially w/a mere fraction of a degree avg change). One instance where capital letters are justified.
It seems, at least through out human history, there are, more or less, always hotter and drier conditions somewhere. There seems to be archeological evidence that some fairly advanced cultures were eliminated, survivors spread to the four winds, by prolonged droughts.
I remember reading history, rather long ago, that at times the death rate among the poorer people of ancient Rome, due to some very hot summers, was very noticeably increased. Also something similar about some urban areas in India. (Of course I don’t know the truth of what I read, supposedly as non-fiction).
If the rainfall records for Australia, to pick an example, are reasonably correct, the more recent 50 to 70 years have been, overall, wetter than the immediately previous time of the same duration, just not everywhere, not all the time. Even the temperatures, while clearly extra hot by human standards, are not anything special according to the records.
The point is that while a season of especial hot and dry may indeed lead to larger fires – where there is something to burn – no climate change of any cause is required. As more than a few analysis have explained (see Jim Steele’s essays on recent California fires), the conditions that promote savage burning, once something starts a fire, can, and do, come about in a very short time of optimum conditions. Then the amount of fuel has a great influence over what happens.
I don’t see any argument that AGW can’t have any effect on fires (overall greater humidity and chances for more rain?) but that AGW, if the hypothesis that it exists to a measurable extent is ever validated, doesn’t readily support any particular fire occurrence or overall fire trend. The argument is rather that AGW doesn’t seem to be involved im producing more large fires, worldwide. Blaming Australia’s fires, or any other passing events, on AGW, isn’t supported.
Australia isn’t seeing hotter & drier conditions. Willis’s post a few days ago, showed that.
No it didn’t. It showed there is no significant longterm drying in NSW – but that is all it showed. Short-term, much of Eastern Australia including nearly all of NSW has seen the driest 2 or 3 years on record. The same area has seen temperatures between 2° and 5°C above the December average.
Loydo ,
Read the Willis post.
It is clear that the BOM rainfall 1900-2019 chart indicates unquestionably that the last 50 years in Australia are wetter than the previous 50!
Do you not see that?
Jim Steele makes the same point in his recent post namely that the1920s and 1930s in Australia were drier than recently.
What are you talking about?
You correct me on that (with exclaimation mark). But you ignore Adam’s howler: “Australia isn’t seeing hotter & drier conditions.”?
“But you ignore Adam’s howler:”
Which wasn’t.
Yes, urban sites that are totally corrupted by urban development and data adjustment, show warming, as would be expected …. but
According to the only reliable temperature record, no warming over Australia this century
The current drought , 3 years co-incident with a very strong El Nino, follows several years of well above average rainfall.. so its nothing to do with “global” anything.
Bushfires, lots of CO2, lots of heat.. I thought CO2 was meant to trap heat, but yesterday’s maximum around here on the East coast of NSW was on 23C
Where did all that heat go, certainly CO2 did not trap any of it.
You really have to wake up to reality, Loy-doh !
Oh yes it is….wake up.
Funny thing about droughts, they are always hotter and dryer than the normal WEATHER pattern. History has recorded droughts and associated wildfires similar or worse than what is being currently experienced.
The only difference, in the past there wasn’t the social and MSM media hype from rabid greenies telling everyone its all unprecedented and caused by a molecule.
Simon, who thinks a Tesla S3 is “direct drive” with only two motors and two axles and no way to split the power. If that is your understanding of fundamental mechanics, I’d hate to know what your understanding of climate science is. Oh wait…
Number 4 on your list is not necessarily true, the ambient temperature and humidity would not necessarily have an impact on the intensity of the fire, it is the dryness of the fuel plus any flammable components in the fuel, e.g. eucalyptus or pine resin. Also the distance between fuel sources.
In the middle of the LIA there is a well documented conflagration in a mid latitude city in the northern hemisphere caused by a single ignition in a bakers shop that rapidly spread due to the close proximity and construction of neighbouring buildings.
Also, as previously pointed out, Australia occupies the same latitudes as the Sahara and the Arabian peninsula, or San Francisco southwards, therefore temperatures of 40 or 50 degrees shouldn’t be unexpected, neither should drought or brush fires.
John, that’s not true. Humidity does have an impact on fire intensity, the lower the humidity on the day, the faster a fire can intensify. Same with temperature, the hotter the day, the faster it will intensify. Moisture content of the fuel can increase it even further. The lower the moisture content, the easier it can ignite and the more rapidly it will burn.
Give that man a Fosters…. well said.
“1. The consensus science is NOT that GW “causes” fires.”
Correct. It is the consensus media that says that global warming caused the bushfires.
As for consensus science, where is your evidence that the anthropogenic contribution of 3% of atmospheric CO2 which makes up only 0.04% of the atmosphere can cause global warming? I’ll save you the trouble; there isn’t any.
The unsubstantiated claim by Berkeley Lab “First Direct Observation of Carbon Dioxide’s Increasing Greenhouse Effect at the Earth’s Surface” concerning Feldman et al (2015) “Observational determination of surface radiative forcing by CO2 from 2000 to 2010” shows the dearth of any claimed evidence to support the belief in the magical warming properties of poor old CO2.
Hail Steven Mosher, another victim of groupthink.
Stopping reading that comment at the word “Monkfish” as I do all comments including insults, including ones replying to you Mr Mosher. Playground insults negate any argument.
“Hotter, Drier weather conditions, lead to MORE SEVERE FIRES, whatever caused the fire to
begin with.”
Hotter and Drier than what? Are you claiming Australia is experiencing unprecedented weather conditions?. Never happened before in history?
==>Steven Mosher
I’d say “well said” too except for the giant straw-man you so eloquently and ruthlessly dispatched! i.e. It is supposed to be hotter and wetter, not hotter and drier, according to the theory of AGW! You know, the enhanced hydrological cycle and all that!
So much for the positive feedback of water vapour so necessary to the IPCCs central claims.
Oh dear, we have another contradiction in need of resuscitation! 😉
Exactly.
“It is insanity to argue that solar caused global warming could never contribute to increased fire severity.
But your position implies such an insane argument.”
No, that is what you chose to infer. And you accuse him of tackling another strawman? You should try looking in a mirror sometimes.
“You should try looking in a mirror sometimes.”
He had them all removed.
Wow, The Earl of obsfuscation ….
And that’s where I stopped reading. If you have to start your post with an Ad hominem , then clearly you have nothing valuable to say. (and given your past posting history, you haven’t had anything valuable to say in years).
Does atmospheric carbon dioxide affect the rate at which humans perform acts of arson?
The opposite, actually. When they’re running away from the fires they’ve set, they emit more CO2.
**D) C02 is a large PORTION OF the human-related causes of GW**
Nonsense.
NOBODY has shown this.
Mosher writes a bunch just to sneak this in.
The main discussion is whether human caused CO2 is causing warming which “is causing fires”.
Everyone knows climate changes – warming AND cooling.
Mosher, Stokes, and Loydo do not get the picture.
1) Where has Lord Monckton ever tried to deny that the globe has warmed or that there was an LIA.
2) Nobody has ever denied this either.
3) Master of the obvious, aren’t you.
4) Once again, master of the obvious.
Your argument isn’t with the Lord Monckton, your argument is with your fellow religionists who deny that there was a little ice age and believe that CO2 is the control knob of the climate and no other factors matter.
Not even wrong, as usual.
Well said.
Also note the role that the Indian Ocean Dipole (IOD) has played on the drought and recent temperatures.
The positive phase of the IOD has recently been shown in research to be intensified by global warming.
“The positive phase of the IOD has recently been shown in research to be intensified by global warming.”
Stop making stuff up.
The frequency of a positive Indian Ocean Dipole increases linearly as global mean temperatures increase, and doubles at 1.5 °C warming from the pre-industrial level (statistically significant above the 90% confidence level)
https://www.nature.com/articles/s41467-018-03789-6
This means that Australia can expect yet more drought and fire in the future.
Note that there are two seperate Simon’s in this thread.
Nature, eh? Worse than wiki.
Mr Mosher is trolling futilely. The head posting demonstrates that warmer worldwide weather would imply retention of more water in the lower atmosphere; that that retention, in the form of increasing relative humidity, has been observed for 30 years; that, therefore, globally one would expect less drought with warming, not more; and that globally the land area under drought conditions has been declining for 30 years, exactly as theory would lead us to expect.
Mr Mosher says it’s nuts to argue that a) the world is not warming; that b) Australia is not hotter and drier than usual; that c) hotter, drier conditions play no role in fire severity; and that d) man’s actions have no effect whatsoever on observed warming. Perhaps it is, but none of these four points was argued either explicitly or implicitly in the head posting.
As so often, Mr Mosher’s extremism has led him into repeated instances of the fallacy of argumentum ad ignorationem elenchi. Being unable to refute the head posting using either logic or physics, instead he sets up a row of four strawman arguments, while adopting the usual Communist device (see Alinsky passim) of accusing me of the very offense of which he is serially guilty.
His intellectually inadequate and, indeed, dishonest response does, however, serve to advertise the increasing flimsiness and desperation of the climate-Communist case.
At least we all agree that:
a) the world is warming
b) Australia is hotter and drier than usual
c) hotter, drier conditions play a role in fire severity
d) man’s actions have an effect on observed warming (>100% likely, > 50% almost certainly).
Simon, I can agree that –
a) PARTS of the world’s climate(s) have warmed incrementally (1C) over the past 200 or so years;
b) PARTS of Australia can periodically hotter & drier than ?usual? (but what’s “usual”?);
c) hotter, drier conditions play a role in fire severity;
d) man’s actions have an effect on observed warming – mainly broadscale land clearing & burning, urban development, asphalt roads, roofs, interior heating, and of course “adjustments” to observations of natural temps recordings.
But you haven’t mentioned that more CO2 means faster plant growth, more forest litter, more fuel for the fires so shortens the time gap in between fires. Reduction in rain slows growth and so increases the gap between fires. Critical to the equation is forestry management by humans and how that has changed.
”A) Hotter, Drier weather conditions, lead to MORE SEVERE FIRES, whatever caused the fire to
begin with.”
And what exactly does this have to do with global warming?
”B) GW can contribute to some increase in some locations of Hotter and Drier conditions,
whatever the cause of global warming is.”
How and by what mechanism?
Please supply some evidence to show 1C rise contributes to hotter and drier in some locations
”its nuts to argue that Australia is not seeing hotter drier conditions”
Over what time frame? Certainly not in the last 50 years. Maybe the last 2 or so
”that’s why its nuts to argue that AGW can have no effect on fire severity”
It’s nuts NOT to argue that.
Using the logic of Mr Mosher we should be able to predict extreme fire danger around Marble Bar, which I am sure that we can agree is one of the hottest and driest places in Australia! No doubt this is part of the reason tourists have been banned from climbing Uluru, it would be devastating they were caught up on the rock surrounded by bushfires caused by dry, hot conditions.
Or possibly the Nullabor should have a fire rating? Real bushfire weather there.
Or is there some flaw in that extension of the logic put forward about the effect of “GlobalWarming” as the main cause of catastrophic fires.
How is that statement not a self contradiction?
NOT global warming causes fires connected in the same paragraph to CO2 is a large PORTION OF the human-related causes of warming
… logically leads to human-related CO2 is a large portion of the causes of fires
We CAN expect, but such expectations are NOT necessarily the rule. Obviously, that comment is not informed by the following article:
https://wattsupwiththat.com/2020/01/04/hijacking-australian-2019-bushfire-tragedies-to-fearmonger-climate-change/
… which clearly indicates that some of the densest occurrences of fires are in REGIONS whose temperature anomaly is COOLER. While it is true that much of the continent is experiencing warmer anomalies, these regions are not where the fires are happening most rampantly. Averaging temperatures over the whole continent, thus, gives a false impression of the relationship between temperature and fire, in effect smearing out the reality of what is actually going on.
Well, your suspicion is wrong, because I, for one, would argue so.
Warming is not the only factor. Obviously, if fires can be severe in regions with a markedly cooler anomaly, as pointed out above, then clearly a simple causative relationship between warming and fires cannot be inferred.
Well, I must be insane then. No, wait, it’s not ME who must be insane. (^_^)
We’rrrre off to see the Wizard … — strawman alert, strawman alert!
No, what’s nuts is to argue that Australia is not experiencing regionally cooler conditions simultaneously with regionally hotter conditions.
No, what’s nuts is to argue that these hotter drier conditions play the SOLE role in fire severity.
No, what’s nuts is to argue specifically that the CO2 of man’s actions have any effect whatsoever on the global warming we observe.
Hey Steven,
1. The consensus science is NOT that GW “causes” fires.
In all practical terms – that is the message from ‘consensus science’. Yes, we can play with the words that causation is indirect by ‘drier and hotter’ conditions but that is just ornamentation – the main message echoed in mass media and celebrities is clear: Aussies on fire, the Earth on fire due to global warming!
2. Global warming can have many contributing factors, both natural and human.
If that is the message from ‘consensus science’ it must be very well hidden. Usually we hear constant banging about ‘unprecedented human-caused warming’.
4. When a fire starts ( whatever the cause) in hotter and drier conditions, we can expect it to be worse that that same fire if it had started in colder wetter conditions.
As per Australia case – firstly, our friends from down under point that recent fires have multiple causes, predominantly poor forest management that accumulated problems. Secondly, as per Willis post, the period he analysed has been actually wetter NOT drier.
Moshpit sez:
that’s why its nuts to argue that AGW can have no effect on fire severity
Silly me, but I thought AGW was caused by CO2? Well, didn’t you know CO2 is used to PUT OUT fires? 😉
Steven Mosher relies on the climate warming argument to explain the drying out and heating of much of Australia in recent years which allows bush fires to start ignited by lightning strikes, campfires ,sparks from power tools or machinery and arsonists etc
He ignores completely the effects of climate drivers in the winds and waters of the Indian and Southern Oceans ( particularly the Indian Ocean Dipole which has sent warm waters to east Africa causing flooding rains from increased evaporation and cooler waters to Australia causing prolonged drying droughts).
If there has been increased warming from climate change in Australia as Lord Monckton argues then Mr Mosher is right that warming adds to the drying effect of high summer temperatures but is not of itself the cause of the prolonged drought in much of the nation much less the cause of the fires.
However Mr Mosher is disingenuous in not acknowledging that many commentators claim quite strongly that the fires result from climate change eg Dr Richard Di Natale leader of the Australian Greens for one plus, many letters to that effect to the MSM, plus frequent commentary on Australia’s ABC .
These Dipole changes are largely the causes of recurring cycles of drought and floods that bedevil much of Australia and which are reflected in the words of Mackellar’s poem quoted by Lord Monckton
A recent report in the Australian Financial Review states there have been some 21 cyclical episodes of major fires over some 123 years since 1897 ( including the 2019 -2020 fires ) -an average of one nearly every six years -some episodes much worse than others eg 1939, 1983 ( Ash Wednesday) and 2007 ( Black Saturday in which 171 people perished) .
A firewall. An electoral college, if you will, to mitigate [catastrophic] [anthropogenic] [political] climate change.
Politicians mostly want to keep their job until they get the supreme retirement benefits .
They will not be scrambling to untangle the web of climate change alarmism .
The msm and it’s influencers from public education and social media are more powerful .
The brain damage has been done and will be hard to undo .
Can you post the sources so we can review the studies used in this?
A breath of fresh air, sir. Thank you. Your uncommon common sense is as a light in a dark room.
Ah yes, the Immutable Law of Leftist Irony (ILLI).
John Tyndall discovered CO2’s GHG effect in 1859 so this phenomenon is nothing new.
The whole silly debate is about ECS (global warming per CO2 doubling). The disconfirmed CAGW hypothesis suggested 3~5C of ECS, but all empirical evidence and physics show ECS is just 0.6C~1.2C, which not only isn’t catastrophic, it’s net beneficial…
To “combat” beneficial CO2 warming, Leftists have implemented insane environmental and energy policies that have ironically caused orders of magnitude more environmental and economic damage than what they were supposed to solve..
We don’t need to decrease CO2 emissions, we need to decrease the number Leftist politicians and bureaucrats who are destroying our economies and environment….
Samurai, your last two paragraphs jump off the page for me. Scott Morrison’s political party used to be more or less right of centre, there are so many greens in the party now (they don’t hide it any more) it’s lost its original identity. We did not vote for a leftist party yet here we are!
Wind and solar renewables are being forced on our country folk at an incredible rate, and to me it’s just future mountains of toxic waste. Superfluous infrastructure that leaves an ecological footprint far worse than any fossil fuels, here and in China. And it is totally unreliable! I fear it will be the downfall of our country. Unlike other countries we don’t have nearby neighbors to fall back on when the power is lacking. South Australia is already having to buy energy from other states but once we are all reliant on wind an solar we won’t have anyone to turn to. If our coal is shut down we have nothing to fall back on.
Megs-san:
Yes, Leftist philosophies, and democracies in general, are ( like CAGW) totally failed constructs. They eventually fail miserably where ever they’re tried.
It’s the 51% majority oppressing the 49% minority…. As soon as people realize they can vote themselves more of other people’s money a society is doomed…
CAGW is a political phenomenon (not a physical one) designed to steal $100’s of trillions from the private sector and to be distributed by feckless government hacks.
Of course Leftists promote wind and solar because these are the most expensive, unreliable, inefficient, diffuse and intermittent types of power available…..
The purpose of Leftists is to waste as much money as possible and provide the lowest possible quality they can and still remain in office… Their duty is to create/invent crises and convince the voters that only government hacks can fix them..
Things will only improve once Leftist ideology is finally thrown on the trash heap of failed ideas, along with the silly CAGW hypothesis which Leftists created…
Throw the Leftist bums out of office…
The data have been corrected for polar amplification … ? Why? What do the raw data look like?
‘Polar amplification’ is an artefact of a flawed radiative transfer scheme in climate models. ‘correcting’ for it is meaningless and corrupts the data, I’m afraid.
It will at once be seen that, though on the CO2 graph the recent concentration appears as unprecedented in 800,000 years, on the temperature graph today’s temperature has been exceeded at the peaks of each of the past four interglacial climate optima over the past 450,000 years, during each of which CO2 concentration was below today’s.
I wouldn’t take the ice core data for granted. That the CO2 of today is so much higher than prior interglacial peaks while the temperature now is lower than just before those prior CO2 peaks is a clue the CO2 data processing is faulty, clipping the older peaks, ‘attenuating’ them possibly because ice core sampling is very low frequency, many times the length of the current CO2 spike.
Indeed, the Palmer Drought Severity Index shows no trend in more than a century:
No trend towards drought, but instead a big trend in cumulative (integrated) PDSI to ‘wet’.
The 780 months of US PDSI data before 1960 averaged -0.039; the 718 months afterwards, 0.706.
But that is the US not Australia. The drought-related fires there are from high UVI that drives daytime heating from fewer clouds, rain, low water vapor, and scorching solstice through perihelion direct sunshine that dries vegetation to a tinder-like condition especially so in the very areas most prone to drought.
Sorry I forgot to detrend the integrated PDSI, which I have now done, and re-posted to the same link. It now shows a strong ‘wet’ trend from the late 1960’s to 2000, declining into ‘dry’ several times until a rebound just up to the zero line. The 780 mo to 718 mo comparison is therefore invalid.
Detrending is very important for identifying inflection points and short term trends.
Australian fire seasons: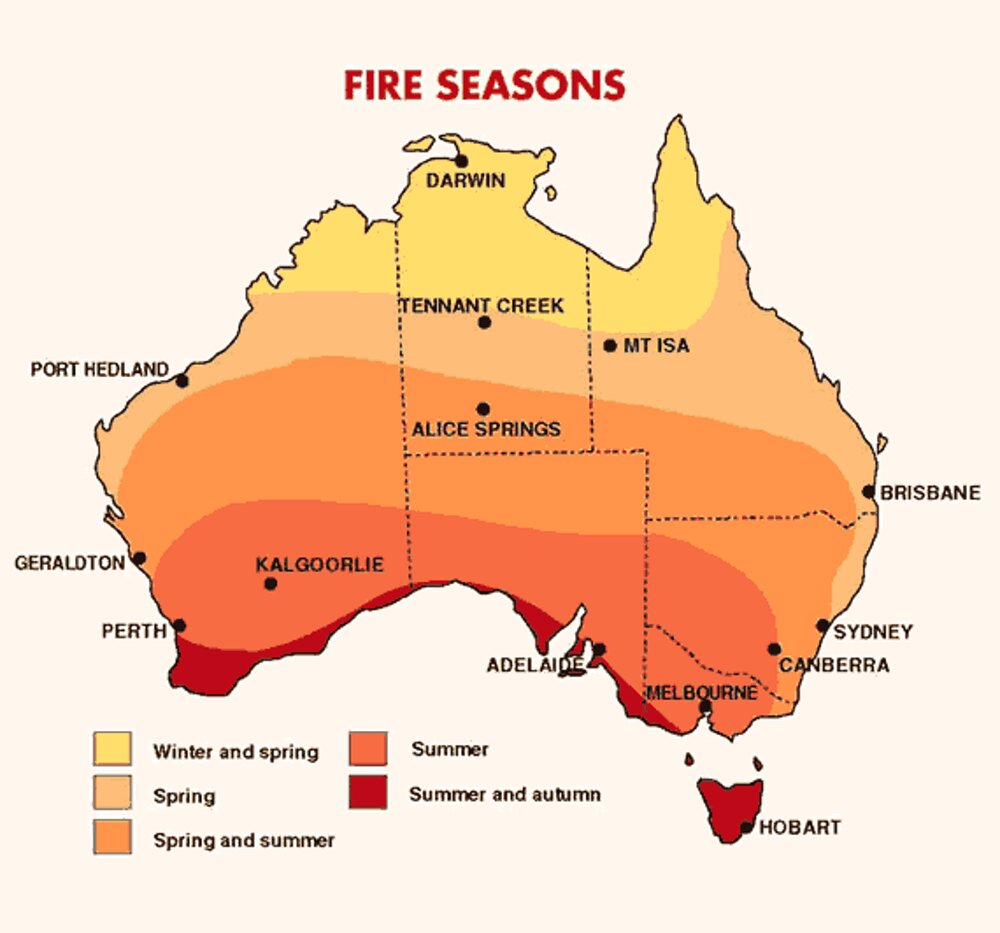
High Dec UVI in Australia: http://www.bom.gov.au/climate/map/uv-index/uv-dec.png
Self, it’s obviously past time for you to go to bed!
The 780 mo vs 718 mo is too valid ’cause it’s from the original PDSI not the integrated!
But the integrated detrended shows a relative drop-off since 2000, we’re right on the edge… don’t worry the next El Nino is right around the bend.
Thank you for your diligence on this. It must be difficult to keep reframing the same stuff over and over, and providing ever-clearer documentation/data to back it all up.
My question: If the current CO2 number has “spiked,” as you say, what does this say to the people who claim that CO2 follows temperature? Where is the previous temp spike that must have preceded the CO2?
CO2 lags temp. by 300 odd years. Does appear the ‘extra’ CO2 may be anthropogenic but there is little proof of such.
Part of the problem is using proxies to “measure” CO2 before direct measurements were taken. Lots of grains of salt in those proxies.
Ice core records typically show a lag of (give or take) 800 years; subtract 800 years from 2020, and you’re in the Medieval Warm Period they keep trying to erase. So some part of the modern CO2 rise is the “echo” of that warm period, as occurred repeatedly according to the ice core reconstructions.
“– is to provide a visual comparison between an 800,000-year reconstruction of atmospheric CO2 concentration and a mere 120 years of observed temperature change.”
Here’s a far easier one for you to follow Chris..
chrome-extension://oemmndcbldboiebfnladdacbdfmadadm/http://static.berkeleyearth.org/pdf/annual-with-forcing.pdf
that Greta Spoilt girl who doesn’t go to school could be educated in one swoop with this article! along with a few others who think cows poop is heating up the planet!!!