reposted from Jennifer Marohasy’s blog

January 4, 2020 By jennifer
The word unprecedented is applied to almost every bad thing that happens at the moment, as though particular events could not have been predicted, and have never happened before at such a scale or intensity. This is creating so much anxiety, because it follows logically that we are living in uncertain time: that there really is a climate emergency.
The historical evidence, however, indicates fires have burnt very large areas before, and it has been hotter.
Some of the catastrophe has been compounded by our refusal to prepare appropriately, as is the case with the current bushfire emergency here in Australia. Expert Dr Christine Finlay explains the importance of properly managing fire loads in an article in today’s The Australian.
The situation is perhaps also made worse by fiddling with the historical temperature record. This will affect the capacity of those modelling bushfire behaviour to obtain an accurate forecast.
We have had an horrific start to the bushfire season, and much is being said about the more than 17 lives lost already, and that smoke has blown as far as New Zealand. Unprecedented, has been the claim. But just 10 years ago, on 9 February 2009, 173 lives were lost in the Black Saturday inferno. On 13th January 1939 (Black Friday), 2 million hectares burnt with ash reportedly falling on New Zealand. That was probably the worst bushfire catastrophe in Australia’s modern recorded history in terms of area burnt and it was 80 years ago: January 13, 1939. It was avoidable.
Last summer, and this summer, has been hot in Australia. But the summer of 1938-1939 was probably hotter — and back then more ferocious bushfires burnt larger areas. In rural Victoria, the summer of 1938-1939 was on average at least two degrees hotter than anything measured with equivalent equipment since, as shown in Figure 1.

Figure 1. Mean maximum summer (December, January February) temperatures as measured at Rutherglen in rural Victoria by The Australian Bureau of Meteorology for the period when mercury thermometers were used. Data unadjusted/not homogenised.
The summer of 1938-1939 was probably the hottest ever in recorded history for the states of New South Wales and Victoria. It is difficult to know for sure because the Bureau has since changed how temperatures are measured at many locations and has not provided any indication of how current electronic probes are recording relative to the earlier mercury thermometers.
Further, since 2011, the Bureau is not averaging measurements from these probes so the hottest recorded daily temperature is now a one-second spot reading from an electronic devise with a sheath of unknown thickness. In the United States similar equipment is used and the readings are averaged over five (5) minutes and then the measurement recorded.
The year before last, I worked with the Indonesian Bureau of Meteorology (BMKG), and understood their difficulty of getting a temperature equivalence between mercury thermometers and readings from electronic probes at their thousands of weather stations. The Indonesian Bureau has a policy of keeping both recording devices in the same shelter, and taking measurements from both. They take this issue very seriously, and acknowledge the problem.
The Australian Bureau of Meteorology has a policy of a three year period of overlap, yet the metadata shows that for its supposedly highest quality recording stations (for example Rutherglen), the mercury thermometer is removed the very same day an electronic probe is installed. This is a total contravention of the Bureau’s own policy, and nothing is being done about it.
I explained much of this to Australia’s Chief Scientist in a letter some years ago — neither he, nor the Bureau, deny that our current method of recording temperatures here in Australia is not covered by any international ISO standard. It is very different from methods currently employed in the United States and also Indonesia, and as recommended by the World Meteorological Organisation.
Then there is the issue of the remodelling of temperatures, I explained how this affects trends at Rutherglen in a blog post early last year.
The remodelling, that has the technical term of homogenisation, is a two-step process. With respect to the temperature maxima at Rutherglen, the Bureau identified a ‘statistically significant discontinuity’ in 1938–1939. Values were then changed.
It is somewhat peculiar that the Bureau did not recognise, in its process of remodelling the historical data for Rutherglen, that the summer of 1938-1939 was exceptionally hot because of drought, compounded by bushfires. Rather David Jones and Blair Trewin at the Bureau used the exceptional hot January of 1939 as an excuse for remodelling the historical temperature record at Rutherglen, with the changed values subsequently incorporated into international data sets.
These made-up values are then promoted by the United Nations. Hollywood superstars like Bette Midler and Bernie Sanders tweet misguided opinion back to the Australian Prime Minister. They have no idea of the extent of their ignorance.
After a recent Sky News Television interview that I did with Chris Smith several people have contacted me about the hottest day ever recorded in Australia. They have suggested it is 16th January 1889 being 53.1 degrees Celsius at Cloncurry in Queensland. A problem with this claim is that the temperature was not measured from within a Stevenson screen, though it was a recording at an official station. A Stevenson screen (to shelterer the mercury thermometer) was not installed by Queensland meteorologist Clement Ragge at Cloncurry until the next month, until February 1889.
The hottest temperature ever recorded in Australia using standard equipment (a mercury thermometer in a Stevenson screen) at an official recording station is 51.7 degrees Celsius (125 degrees Fahrenheit) at the Bourke Post Office on January 3, 1909.
We are all entitled to our own opinion, not not our own facts.
*****
The picture featured at the very top of this post is of grass trees at Scott River, Western Australia, taken in January 2007, following a “mild, patchy burn” by David Ward. David has contributed several articles on bushfire management to this blog, you can find some of the links here: http://jennifermarohasy.com/2009/04/the-mathematics-of-connectivity-and-bushfire/
In 1974 about 29,000,000 hectares were burned in the Kalgoorlie fires.
In 2003 over 15,000,000 hectares were burned in WA – primarily from the Goldfields to down along the South Coast and in the Kimberley. From memory the flame front was about 1,500 km long at one point – from Sandstone to Cape Arid.
Yes, very large areas are burnt in savannah and scrub fires. This has nothing to do with forest fires, which are far more dangerous and of lasting effect.
1850-51 probable
1938-39 possible
1973/74 most likely 117 million hectares might include a little forest
are all possible.
NB the current fire season 2019-2020 has NOT burnt over 6 million hectares of forest as you well know.
A lot is forest and a lot is bush and scrubs.
Stop making up things.
Mr Stokes..
You have obviously never faced a running grass fire in heavy fuels on a bad day.
Any fire in heavy dry fuels on a bad day has an intensity and rate f spread that we cannot counter.
The real difference is that we typically get grass-fired under control on the first night because we can access them as soon as conditions moderate. Forest fires are often permitted to burn for days -sometimes weeks – because we cannot get immediate access as soon as this happens.
This failure to extinguish early under moderate conditions was identified by the McLeod Inquiry as the probable reason why the 2003 Canberra fires killed 4 people and destroyed 500 homes.
Low fuels, good fire-trails and significant firebreak make this possible.
Incidentally, the western half of NSW has less than 2% of the state’s fires, today. If you are going to blame “Climate Change”, explain to us why there is no Climate Change west of Dubbo. If hot and dry conditions are the most important factors, explain to us why there are fewer big fires where it is ALWAYS hotter and ALWAYS drier.
Hysteria over nature is common. That’s how we got rainmakers in the Old West (true believers, you can cash in on this today—people are too stupid to know or remember that humans don’t control the weather), sacrifices to gods for fair weather, etc. It’s just the Climate Cult’s sacrifices are human beings dying due to the stupid and cruel “solutions” proposed, the excuse of “global warming” to allow the government to kill via flooding and fire, and the intense hatred of humanity by this cult. It’s not new. Millions have died in allegiance to cults and always will. Humans really hate themselves. We have no “cure” for this and the destruction of the cult depends on the power and money invested. The Climate Cult has tons of money, owns the media, owns education and has bullying power everywhere. So expect millions, if not billions of deaths, at the hands of those who preach humans can control the weather. Another killer cult, another day in history. Nothing new.
I live on the NZ Nth Island west coast
I remember as a boy that it rained dry ash at our farm when I was a boy. If I held my hand out for a period of time some would settle in my palm. I was told that it was from Australia. I cannot remember the year though it was probably within the period 1960 – 1970
A combination of factors influence fire susceptibility and impact:
– A dry period
– Wind
– Heat
– The degree of infrastructure development and human activity
Like elsewhere in Australasia there has been a rapid increase in small rural lifestyle blocks where urban workers like to have some land. Aussies like to build among trees to provide shade. This increases both susceptibility and spark potential
Once it gets above 35 C (very common in Aus) a few degrees here or there is not going to make much difference IMO
Cheers
M
So, to be clear, Jennifer Marohasy is saying that, based on raw data from one location and ignoring the last 20 years of data, the hottest summer in Australia was probably 89 years ago?
Mmm, doesn’t seem to be a convincing argument.
Try actually reading it.
Your need to misrepresent Jennifer’s argument makes your counter look even less convincing.
According the Giglio et al mentioned above, every single season has more burned area than 6 million hectares.
This is off the subect but I need help. Is anyone out there aware if the IPCC has claimed a scientific consensus on CC, or (unlikely) denied it. I am an ex-journalist and I want to prepare an item on this subject. (I wonder if anyone has asked the IPCC its opinion on “the consensus). Any help would be appreciated. Thanks in advance.
Right now (09/01/2020) 98% of the fires in NSW are in the Eastern half. You can draw a line from Moree, through Dubbo and Wagga to Albury. There are 170 fires to the east of that line, and just 2 west of it.
Those wanting to blame Global Warming for these fires, must explain why there is no “Climate Change” west of Dubbo.
The irony doubles when you realise that the west has always been hotter and drier…..
Mr Roberts.
Your need to misreprent Jennifer’s argument tells us everything that we need to know about your inability to support your own.
The last 20 years of raw data is not comparable. It has not been collected according to any recognised international standard, uses data from stations that do not even meet the ABM’s own standards, and has been “adjusted” without valid reasoning or appropriate independent scrutiny.
Therefore YOU are the one ignoring the unreliability of the last 20 years.
So Jennifer prefers to use a subset of raw data to infer something that she has no basis for? If she thinks the data are unreliable, then she can’t make any inference at all. If she prefers the subset of raw data to the whole of the adjusted data, she needs to show why that subset of raw data is a better guide than the adjusted full data set that the BoM uses. Why is it more reliable (even though there are 20 years missing)?
Unlike the US, there are few met stations that have long historical temperature data and if they do the BoM throws out the data as being ‘unreliable’. Here is my graph of 6 rural stations with Summer month record Max temperatures (Dec-Jan-Feb taken from the BoM website records. Year of record at top of columns.
https://postimg.cc/ykQLV4J4
Make your own judgment. Unadjusted BoM, Ann mean Max temp, for Dubbo; Darling Street (1871-1999) & A/P (2000-2018) composite graph. Dubbo is a large (pop 38,000) town central-east rural NSW, 275m asl.
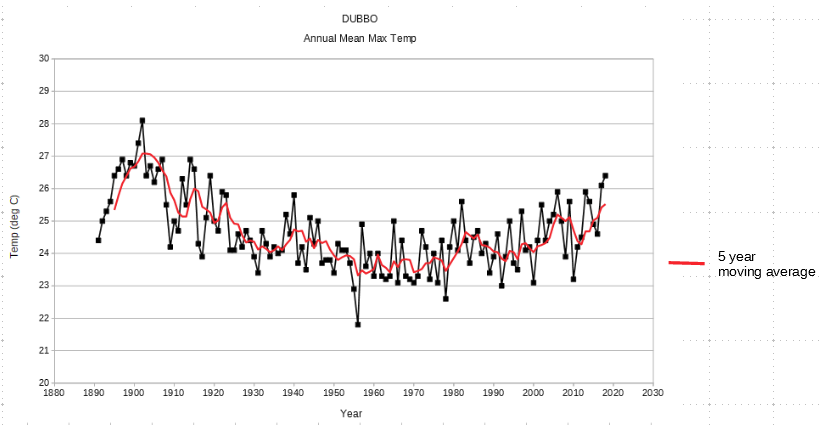
Of course, these temperatures are before adjustments by the BoM for their ACORN homogenized global warming series.