Reposted from Chris Martz Weather
Posted on 21 Dec 2019 by Chris Martz

Figure 1. ECMWF 500 millibar height anomaly map for North America; five-day average – WeatherBELL Analytics, L.L.C.
By Chris Martz | December 20
Social media posts are well known for their exaggeration, and the weather is no exception. For the last week or so, I’ve been seeing Tweet after Tweet claiming that Christmas is going to be a “blowtorch” this year across the central and eastern half of the United States. By “blowtorch,” they mean warm.
There is no doubt in my mind that next week is going to be quite mild relative to average east of the Rocky Mountains given that a ridge of high pressure is currently building in with its center over the Great Lakes (Figure 1). The polar vortex feature is just northeast of Alaska over the Beaufort Sea where the green contours are. At the same time, a deep trough will be digging down into the North Pacific and the West Coast of North America. This trough will continue to allow storms to move into the West Coast, dumping lots of snow in the mountains as we progress towards the New Year.
For those of you who are not weather geeks, meteorologists, or aspiring meteorologists like myself, you might be asking yourself, “Why do upper level ridges result in warm weather?”
If you pay close attention to a TV weather forecast, you’ll likely be familiar with the concept that high pressure at the surface signals clear skies and quiet weather overall. Depending upon the origin of the air mass, the surface high can either bring in cold air (like we have seen for the past three days across the Midwest and Northeast) or warm air. The reason for why high pressure means clearer skies is because of the sinking motion of air in the atmosphere, which prevents convective cloud development.
Unlike surface highs, ridges of high pressure feature something that surface highs don’t always have, and that is warm air. While ridges are good indicators, they don’t always correlate well with warmer than average temperatures at the surface at the local level. For instance, if a surface low is underneath the ridge, then a localized area may be cooler than average. This can also occur when sea or lake breezes blow cool air onshore over a cold body of water. As a general rule, areas with overlying ridges can expect mild temperatures during the cool season and hot temperatures during the summer.
Whenever you’re looking at a weather map at the 500 millibar level in particular, ridges are located where the isobars are curving upwards and troughs are located where they dip downwards. On the map above from WeatherBELL, they make it easier to see where ridges and troughs are for the common person; areas that are orange or red indicate ridges and areas that are blue or purple indicate troughs. Keep in mind that they won’t always be color coded.
On a weather map, ridges indicate above normal “geopotential heights.” So, what is a geopotential height? Well, simply put, a geopotential height is the altitude at which you’ll find a given pressure level. Ridges and troughs are easily seen on the 500 millibar map because the altitude at which 500 millibars of air pressure can be found is where half of the atmosphere’s mass is located above and below that altitude. Remember, Earth’s atmosphere holds 1,000 millibars of air pressure. When all averaged out throughout the Earth’s atmosphere, air pressure decreases exponentially with height due to hydrostatic balance.¹
At an altitude of approximately 18,000 feet (5.5 kilometers), 500 millibars of air pressure can be found. This value (500 millibars, or any pressure level) will change depending upon whether or not there is above average or below average geopotential heights in the atmosphere (Figure 2).

Figure 2. Atmospheric pressure in Earth’s atmosphere – Britannica.
Since warm air expands due to temperature’s direct relationship with volume (Figure 3), V₁/T₁ = V₂/T₂, where V is volume and T is temperature, areas in the atmosphere with such thermal characteristics are identified as having higher heights and are thus ridges.² Denser air masses are associated with cold air, and are commonly associated with upper level troughs.

Figure 3. Temperature versus volume – Department of Chemistry (FSU).
Judging from recent model guidance, it’s likely that Christmas day will be unseasonably mild on Christmas day east of the Rockies, but south of the Midwest (Figure 4). Highs along the Rio Grande, across the Deep South, and down into Florida will be well into the 70s, maybe approaching 80°F (26.7°C) south of Orlando, Florida. From Northern Texas east to North Carolina, highs will easily top off in the 60s. There will be a sharp temperature gradient however stretching across the Plains, Midwest, and Mid-Atlantic dividing polar and tropical air masses.

Figure 4. NWS forecast high temperatures on Christmas day – WeatherBELL Analytics L.L.C.
The warm sector of the country on Christmas day is being portrayed by some people as an outright blowtorch. Of course, temperatures at that time will be above average on the order of 10°F (5.6°C) give or take a few degrees (Figure 5).

Figure 5. ECMWF 2 meter temperature anomalies for the U.S. on December 24 and 25 – WeatherBELL Analytics, L.L.C.
Given that climate activists tend to find the color orange appealing on temperature maps, I’m having a hunch that they’ll be having a field day with the upcoming weather next week; I’m sure all kinds of wonderful articles will pop up claiming that we’re having “Hottest Christmas Ever,” only to find out that this will not be the case.
Four years ago, as many of you may recall, the eastern United States had quite a warm Christmas. Over 44% of the Lower 48 was above 50°F (10°C), over 33% was above 60°F (15.6°C), and exactly 20% was over 70°F (21.1°C) (Figure 6). Temperatures across the southern tip of Texas and Florida were around 90°F (32.2°C), while 80°F (26.7°C) readings were recorded as far north as southeastern Virginia. Temperatures over 70°F (21.1°C) were reported well into New England.

Figure 6. PRISM 4 km daily high temperature across the United States on December 25, 2015 – WeatherBELL Analytics L.L.C.
Temperatures were some 15 to 30°F (8.3 to 16.7°C) above average from Texas to Maine (Figure 7).

Figure 7. PRISM 4 km daily high temperature anomalies across the United States on December 25, 2015 – WeatherBELL Analytics L.L.C.
However, despite this, 2015 was not the warmest Christmas day in the United States. That would be 1922 and 1955, where the average high temperature among all USHCN stations was around 54°F (12.2°C).³ In 1955, temperatures as high as 80°F (26.7°C) were recorded as far north as Farmville, Virginia and most stations across the Deep South and Southeastern United States were above 80°F (26.7°C) which were a bit higher than they were in 2015 (Figure 8). Temperatures as hot as 90°F (32.2°C) were recorded in southern Texas.
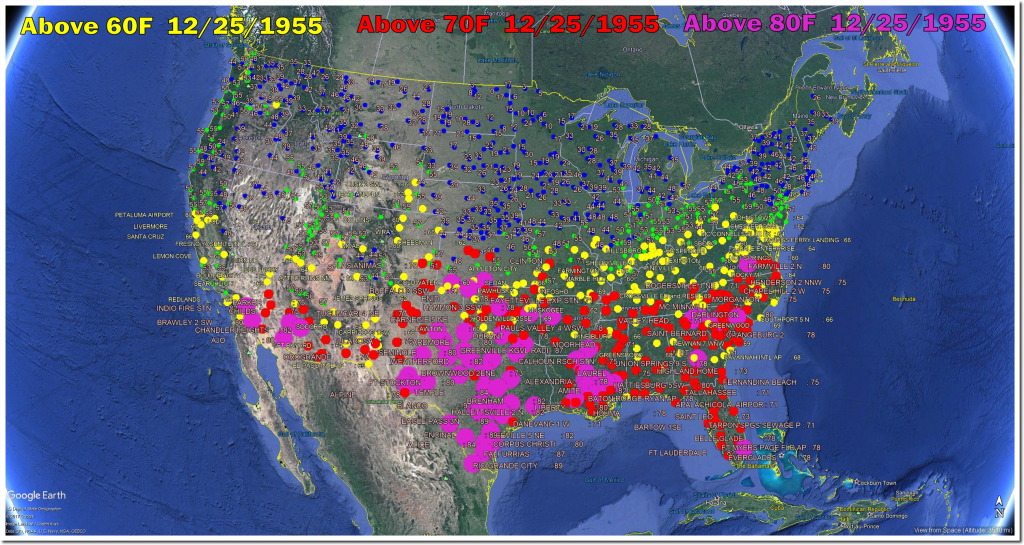
Figure 8. Temperatures at all USHCN stations on December 25, 1955 – Real Climate Science.
Temperatures in the 60s or higher occurred over a wide area stretching from Washington state (one location, Walla Walla) throughout the Southwest, Southern Plains, Southern Midwest, Southeast, and Mid-Atlantic (Figure 9).⁴
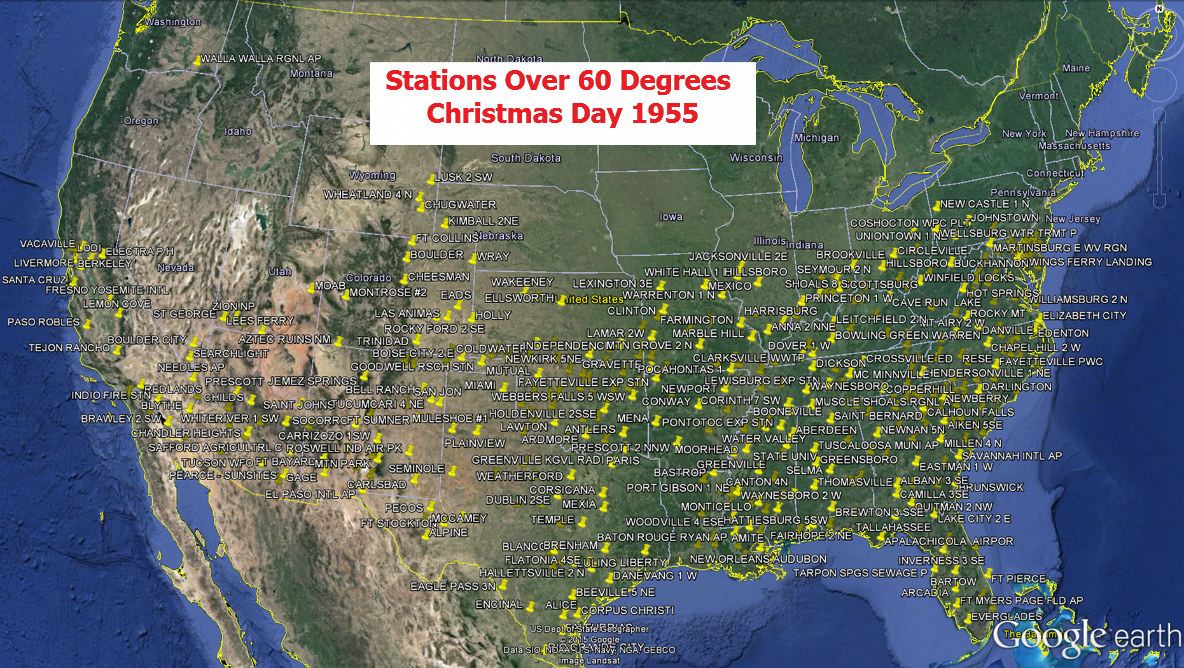
Figure 9. Stations at or above 60°F on Christmas day in 1955 – Real Climate Science.
Since 1917, average maximum temperatures on Christmas day at all USHCN stations have been on a statistically insignificant decline (Figure 10).³
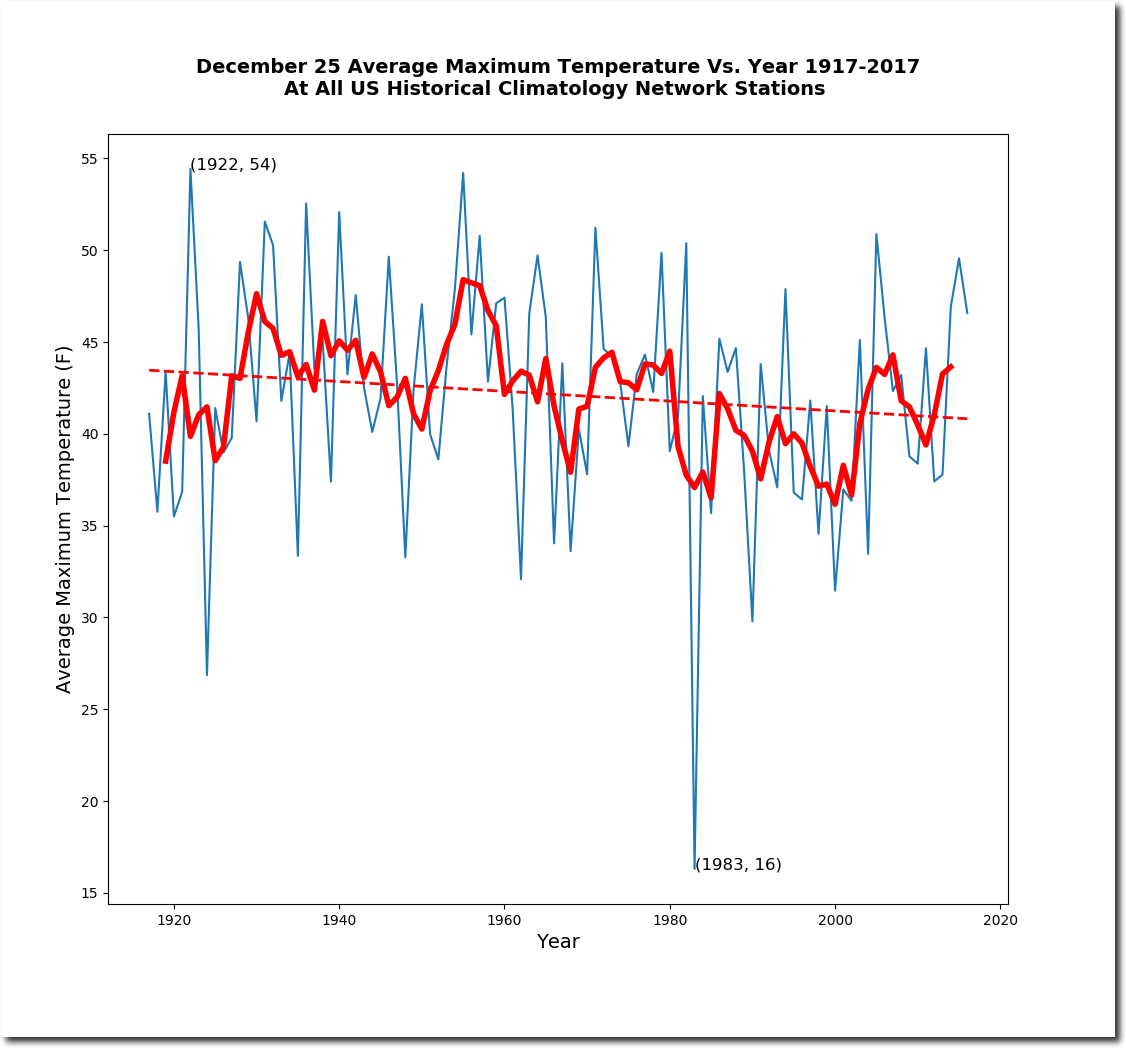
Figure 10. December 25 average maximum temperature from 1917 to 2017 at all USHCN stations – Real Climate Science.
Given these facts, I see no reason for anybody to be concerned about Christmas temperatures. Anyone who attempts to attribute human-induced climate change on next week’s “mildness” will be skating on thin ice. In other words, Christmas hasn’t lost its seasonal chill, so don’t lose yours.
REFERENCES
[1] Augustyn, Adam. “Atmospheric Pressure.” Encyclopedia Britannica. Encyclopedia Britannica, inc., February 13, 2019. Accessed December 20, 2019. https://www.britannica.com/science/atmospheric-pressure.
[2] “Gas Laws.” Department of Chemistry [FSU]. Florida State University. Accessed December 20, 2019. https://www.chem.fsu.edu/chemlab/chm1045/gas_laws.html.
[3] Heller, Tony. “Declining Christmas Temperatures In The US.” Real Climate Science, December 17, 2017. Accessed December 20, 2019. https://realclimatescience.com/2017/12/declining-christmas-temperatures-in-the-us/.
[4] Heller, Tony. “Christmas Day, 1955” Real Climate Science, December 25, 2015. Accessed December 20, 2019. https://realclimatescience.com/2015/12/christmas-day-1955/.
Does the posting of the ECMWF images violate Weatherbell’s license with them? On Joe Bastardi’s free Saturday updates he often mention he can’t post images from ECMWF as frequently as he’d like.
https://www.weatherbell.com/premium
Curious, at https://chrismartzweather.com/2019/12/21/blowtorch-christmas-i-think-not/ Martz displays the ECMWF images from URLs that point to Weatherbell, e.g.
It looks like Weatherbell has taken them down, or displays something else for non-subscribers.
Hi Ric, it’s Chris who wrote the article. Good point, but a few months ago, WeatherBELL stated that the ECMWF was allowed to be shared publicly as long as there was no cropping of the ECMWF tag at the bottom right.
Hi Chris,
I just emailed Joe D’Aleo and Joe Bastardi as follows:
“Very Best Wishes to my friends at WeatherBell for the Holidays and the New Year!”
My best wishes are extended to everyone at WeatherBell, including you.
I greatly admire the exceptional competence and high integrity of the good people at WeatherBell – you are the best in your field.
It’s a tough job, but somebody’s got to do it. 🙂
Loons need de-icing.
https://www.wunderground.com/cat6/It-Was-Raining-Loons?cm_ven=cat6-widget
Several years ago the central Texas coast had 7 inches or more snow for Christmas. Started Christmas Eve.
Hey, you could post a spew warning, HD!!! I thought it was a photo of the XR idjits, not a REAL loon!
Nice shot, though. Nice Christmas gift, too, that photo!
in the land of the insane…
…people complain about great weather
global warming causes great weather
..and if there was 10 feet of snow…power outages….pile ups
it’s global warming
I enjoy seeing the maps from Christmas Day 1955. I remember that day, but not well. After all, I was only nine months old at the time! I was about 100 miles from Walla Walla, “The town so nice they named it twice!”
In 1955 I also lived 100 miles from Walla Walla (the “Cradle of the Northwest”), and remember very well the winter of 1955-56 as having several polar lows out of the Gulf of Alaska, which provided much snow for snow skiing that winter. (Back then, we were even allowed to bring our sleds on the school bus for sledding on hills near the school ground.)
Did we not just come through a spell of early and harsh cold? Of course, that’s just weather. Sigh.
And when it’s anomalously hot, in let’s say AU, then the whole world is on fire, but when it’s anomalously cold in AU then that’s only 1.5% of the earth’s surface.
Last year in the U.S., November was unusually cold, December unusually warm, and the rest of the Winter incredibly cold and snowy.
IIRC
When I was in graduate school in Ann Arbor, MI in 1982 it was 66 degrees F on Christmas day. We had the windows all sealed up and had to turn the air conditioner on to cool the apartment down while cooking Christmas dinner. Using alarmist logic we must be having a climate catastrophe of global cooling.
Trying to play nice,
I had recently moved from Ann Arbor after graduating so I checked weather records to verify your account of the weather in 1982(which I believed).
The Detroit(DTW-airport) station just east of Ann Arbor on I-94 set the Christmas record high of 64 degrees F in 1982!
https://www.weather.gov/dtx/DTW_Dec_rec
The record highest minimum for that date was also set at 50 deg. F.
Interesting that 1 year later, 1983 featured record cold temperatures. The 23rd-26th saw lows of -9, -9, -10, -8 deg. F.
The only colder temperature than that in the month of December for Detroit was on the 29th way back in 1880 when it dropped to -11 deg. F.
There was also a devastating hard freeze deep into Florida that greatly damaged the orange and other crops. It was bad enough to wipe out/kill most of the orange groves in some of the high producing northern areas!
’83, ’85 FREEZES CHANGED FLORIDA’S CITRUS MAP
https://www.orlandosentinel.com/news/os-xpm-1989-12-22-8912222663-story.html
Just another example of how cold does so much more damage than heat on our planet.
In late 1982, we had a very strong El Nino impacting the weather pattern downstream…..which certainly played a role.
https://ggweather.com/enso/oni.htm
This is the link to the December 2010 weather in Chicago, which included a warm spell up to and through Christmas and the end of the month. https://www.timeanddate.com/weather/usa/chicago/historic?month=12&year=2010
January was not too bad, just cold. But in February, we had a blizzard coming off of Lake Michigan that left 4.5 feet of snow piled up against my storm door, so deep and thick that I could not open it. My neighbor had to dig me out. That was also the February in which a CTA Flexbus broke down on northbound Lake Shore Drive, blocking all traffic behind it, and leaving motorists and their cars stranded in that thick, blowing snow. The CFD came along and rescued the drivers, because the southbound lane was plowed out and opened, and people had to abandon their vehicles until they could be moved to a parking lot.
I do NOT want another winter like that, period!!!!
December’s gonna be close to avg temp here in the US mid-Appalachians (w/one pretty nasty ice-storm). This is not the hotspot you’re looking for. Nothing to see here. Move along (said while waving hand in dismissal).
Bottom line, the real reason air is warmer under a ridge is adiabatic compression. The same reason temperature lapses with altitude.
Under a ridge, winds are feeding in from the southwest.
Under a trough, winds are feeding in from the northwest.
This time of year especially, but in general as a rule, it is colder in the northern source regions, and warmer in the southern source regions.
Near average conditions will be seen with zonal flow (IOW from West to East parallel to latitude lines) while winds with a northerly component will bring below average temps, and winds with a southerly component will bring warmer than average conditions.
The fetch must also be considered.
Under a cutoff low for example, it will tend to be warmer on the side with southerly winds but overall colder than average under such a pattern.
Upper level dynamics are not the same as surface dynamics.
“going to be a “blowtorch”; Now that’s funny. I remember this type of weather pattern back in the 60’s
My parents were married on December 25, 1937. It was shirt sleeve weather, i.e., in the 70s. They used to say that they were married on Christmas Day because it was the only day both of them had off. The Great Depression was still haunting the US economy and if you had a job you did not want to do anything that might prompt your employer to fire you. Labor was plentiful back then.
Not exactly. If one plots pressure versus altitude in the U.S. standard atmosphere the pressure versus height is so close to a linear decline that I can’t see a deviation by eye over the first couple thousand meters. The reason for this is that at each height the density of air is slightly larger than one might guess because atmospheric temperature declines with height. The relationship is fairly complex if one needs accuracy. I learned this a long, long ago when trying to modify an electronic barometer into an electronic altimeter.
Looks like Santa is going to have to trade in Rudolph and the boys and his sleigh for a jet ski. Blowtorch Christmas will Shirley cause sea level to rise catastrophically and the jet ski is just the ticket. Might have to change that “jingle bells” deal also.
From Peter Haining’s introduction to “The Complete Ghost Stories of Charles Dickens”:
“‘Interestingly, also, in some quarters A Christmas Carol is credited with having ‘invented’ the idea of white Christmases! For, according to Professor Hubert Lamb of the climatic research unit at East Anglia University, snowy Christmases are actually very infrequent, and belief in them, ‘owes a good deal to Charles Dickens and A Christmas Carol.’ Professor Lamb found the explanation for the belief during research into past weather records, which showed that for the first eight years of Dickens’s life there was a white Christmas every year with either snow or white hoar frosting. Though this may well have left a vivid memory of Christmas weather with Dickens, says the professor, it was very much a freak period. ‘The idea of a white Christmas is fairly mythical, you see. Christmas Day and the days either side have a rather good sunshine record. The most characteristic picture is of a rather quiet, sunny period between more disturbed winter weather.'”
Enjoy the warmth while you can because inevitably there will be another blast of cold arctic air headed our way. Maybe a couple of blasts before winter is all over.
Of course, the alarmists will also blame the cold weather on human-caused climate change. Like a broken record (that’s an audio recording played on one of Joe Biden’s record players).
Btw, I hear records and record players are making a comeback in some circles. No connection to Biden, however.
Record players have been back for about a decade, maybe a little less. You can buy a USB turntable on Amazon for $40 and up.
I think the use of the term “blowtorch” is distasteful considering what Australia is currently suffering.
I know that Australian temperatures have been high but I haven’t seen what is the core reason. Has the fire load accumulated due to human interference?
Anyway to one and all have a safe and Merry Christmas.
I think the core reason for the Australian high temps/drought is due to the negative AAO and stratospheric warming (quiet Sun). The SH Strat Warm started around Sept 1 and its effect has currently made it down to the lower troposphere. Also southern Africa is in a drought situation due to the
-AAO.
Some studies (river flows) show 2-3 years before solar min are very dry and the 2-3 years after are typically wet in Australia.
Dec 25th
ave 40F
tomm 50F
record 74F 1964
Ohh and BTW its currenly raining cats and dogs in Queensland Australia major flooding so much for drought and AGW. The rain maps seem to showing same for much of INLAND Eastern Australia
QLD is a very big place, 2.7 times bigger then Texas, and about 90% of it is dry. If there’s any rain and flooding it’s localized. The current radar shows very little rain.
http://www.bom.gov.au/products/national_radar_sat.loop.shtml
The rain and rivers maps depict an almost dry state, a few minor inland storms overnight, with no significant flooding anywhere. I’m guessing you’re in Brisbane, or near to it, and caught the overnight storms in the SE.
http://www.bom.gov.au/qld/flood/
In Australia the alarmism coming through the weather reports are amazing. Despite the fires and the headlines much of Australian weather this December has been average or less. If there are two days above average they talk about an impending heat wave or catastrophic conditions or record temperatures or serious fire conditions and historically highest temperatures in Australia in the last decade at some obscure place in the middle of nowhere and if it doesn’t eventuate they don’t then report the failure of their alarmist prediction and if it does they carry on as if the apocalypse is on us and that despite plenty of detailed history that showed such conditions were prevalent at various times earlier such as the 1890s and 1930s they report on it as if this is unprecedented. A word used so regularly that it may be reclassified as a preposition. The other thing they do is the weather maps are now these strange psychedelic colours of bright purples reds etc as if words weren’t sufficient to convey the impending message of Armageddon. We know that it is actually BOM and some media outlets policy that weather is presented in such a way and it reminds me of the classic Marty Feldman skit of the alarmist weather report on TV fifty years ago . When I first watched and laughed at this skit I never thought it would be so prophetic.
” … That would be 1922 and 1955, where the average high temperature among all USHCN stations was around 54°F (12.2°C).³ In 1955, temperatures as high as 80°F (26.7°C) were recorded as far north as Farmville, Virginia and most stations across the Deep South and Southeastern United States were above 80°F (26.7°C) which were a bit higher than they were in 2015 (Figure 8). Temperatures as hot as 90°F (32.2°C) were recorded in southern Texas. … ”
——–
“Humans did it.” – Secretary General António Guterres, United Nations
Living in the Midwest, everyone is enjoying this great weather and want more of it. Temps were close to 50 degrees (F) today. Love that global warming.
Yep real warm Christmas here in Arizona it’s cold and wet, higher elevations are getting Snow.
Thin ice!
Haha…I get it!
-2C in the blowtorch this morning here in Connecticut
Merry Christmas!
Australia not exist, then?
“Earth’s atmosphere holds 1000 millibars of air pressure.”?? I am not a meteorologist, but the way I understand atmospheric pressure, I don’t think atmosphere “holds” pressure. The pressure is made by the weight of the air mass pushing down onto the surface. For that very reason the atmospheric pressure decreases with height. Then again, if I am wrong, please correct me.