While we can only hope this is true, and hopefully the flood will finally get the U.N. out of the U.S., the reality is much different.
From this article at QZ back in September, which I missed.
Sea level rise will flood the neighborhood around the UN building with two degrees warming
Leaders are gathering at the United Nations headquarters in New York City this week, where a set of climate change meetings will take place alongside the United Nations General Assembly. While they discuss ways to prevent the worst effects of climate change, the neighborhoods around the UN face a very real threat: Sea level rise is set to flood the immediate area, possibly as soon as 2100.
Right now, of every US city, New York City has the highest population living inside a floodplain. By 2100, seas could rise around around the city by as much as six feet. Extreme rainfall is also predicted to rise, with roughly 1½ times more major precipitation events per year by the 2080s, according to a 2015 report by a group of scientists known as the New York City Panel on Climate Change.
But a two-degree warming scenario, which the world is on track to hit, could lock in dramatic sea level rise—possibly as much as 15 feet. Whether it will take 100 years or longer for the total extent of the sea level rise to play out is unknown, as the rate of ice melt at the poles is harder to predict than the amount of ice that can melt with a specific amount of warming.
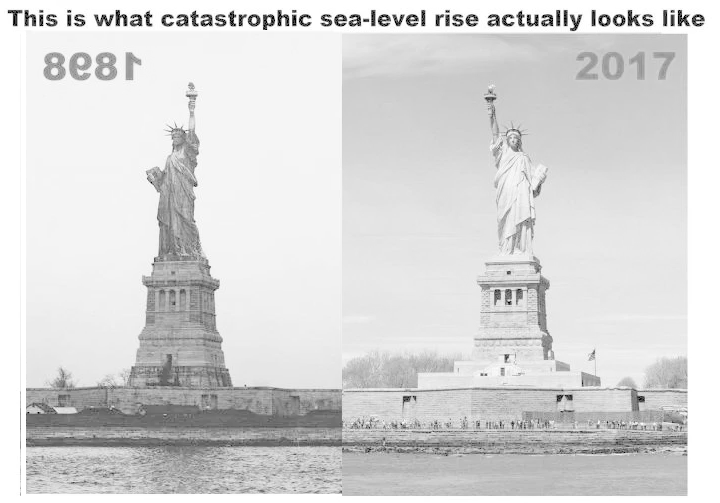
This model projection photo is provided with the article:

The article was written by one Zoë Schlanger who in my opinion, isn’t capable of writing about climate honestly – mainly because she willfully ignores facts that are plainly evident to anyone with a a shred of journalistic curiosity.
WUWT readers may recall I wrote this article about her journalistic failures: The journalistic self-immolation of Newsweek’s Zoë Schlanger
So in this QZ article, she willfully ignores the sea level data from about a mile away at The Battery on the tip of Manhattan Island, that is publicly available from NOAA:

interval of +/- 0.09 mm/yr based on monthly mean sea level data from
1856 to 2018 which is equivalent to a change of 0.94 feet in 100 years.
Note that the trend is steady, there’s no acceleration seen in the data.
NOAA calculates 0.94 feet rise in 100 years for the graph. Since we have 80 years left to 2100, we’ll calculate 0.94 feet x 80/100 = 0.752 feet or about 8 inches by 2100.
That’s a far cry from six feet by 2100.
But for people like Zoë who can’t handle graphs, a picture says a thousand words. Spot the sea-level rise over the last 100 years:

Sea levels 2-meters lower today than 3,000 years ago. Today’s mild thaw up out of the coldest era of the past 8,000 years the Little Ice Age…I expect Sun Cycles 24-27 to drop sea levels an inch or so….
I have often referred to the UN ignoring their own warnings.
Here is my blog where I look into the UN with their recent spending and no attention to anything that may be in their policies.
https://thedemiseofchristchurch.wordpress.com/2016/05/06/un-headquarters-and-usd1-2-billion-upgrade-and-rising/
Like I say in the blog, “At least they could install a jetty or other such facility”, (to impress readers), even though it is evident the UN does not give rising sea levels any real credence.
Cheers
Roger
And this is all because of human’s CO2 emission. But human is only responsible for about 3.7 % of the 406 ppm of atmospheric CO2. The other 96% is by nature. So why are we blaming humans????
Go to http://www.sg-climate1.0fees.us/
As a non scientist, but a curious guy who has been seriously looking at this scam, I have a serious question on sea level rise from the “melting polar ice caps”. Do ANY of the “scientists” claiming this sea level rise realize the the AVERAGE DAILY TEMPERATURE of the continent of Antarctica is 59 degrees BELOW ZERO F? How in H is 5 degrees of warming going to melt that block of ice?
Flood out the UN?
Dear Lord, Please let it be so!
I suggest we build some canals and dykes. Anything to help flood the UN more quickly.
I’d like to see the experiment whereby the delegates are placed in a tank with sharks to see what the effect of climate change might be if said delegates refused to leave the rising sea level.
Yeah. I don’t know if I can wait that long. The useless twats at the U.N. would be arguing whether or not to vacate the building until they drowned.
Mods. Why don’t any of my posts-post? This is a constant issue.
It’s the same for everyone John, every comment gets before getting posted. And those with the wrong mix of words that offend the algos go to a moderation bin. Anthony announced a couple of weeks back WUWT will be moving to a register-to-post arrangement in the new year, to address these moderation and trroll issues.
I wonder if we’ll see the real names of Griff and Loydo?
I don’t know about Griff but I’m pretty sure Loydo’s real name is Lloyd Christmas.
They should relocate immediately – as per the precautionary principle they expect us to follow with their mindless “science”.
P.S. and good riddance.
You have to worry that, if the UN floods, where does all the sewage that will be released from that building as a result, go? And I don’t mean what is in the lavatories.
I like this site, a lot, but every now and then a radical ‘right libertarian’ strain of political comments interfere with the ‘climate science’.
I think people who hate the UN are silly, this is an imperfect organisation but the intent is good and there are many functions of the UN that are totally brilliant, such as the ITU and WHO.
I personally find this strain of ‘USAmericans hating the rest of the world’ as exemplified by these sort of derogatory comments awful and it exposed the gross xenophobia that is the USA.
Please, you are a tiny part of a gigantic global community, do not isolate yourselves, join in. In particular there is nothing special about USA or its people, you are all plain ordinary, like all the rest of us.
We should play this up and advocate that Trump purchase the building and all support facilities for $0.10 on the Dollar value. The UN can then be relocated to Geneva where sea level rise won’t impact their structures.
Agree! The UN diplomats can hardly argue with a forced relocation to a suitable 3rd world country, as it safely removes them from their own imaginary threat. Save the Bureaucrats!
And save the USA from this plague of UN diplomatic immunity parasites – MAGA!
The UN should relocate to the Maldives. So they can stand with the ‘climate-oppressed’. Or sink.
I was thinking that we should relocate them to the Democratic Republic of Congo. They can help more directly with the wars, Ebola, etc… we can auction off their current building.
What an excellent idea.
Geneva is too good for them. I think a garden spot close to the center of Africa so that they can see what real problems are and how much poor people need cheap reliable electricity. N’Djamena Chad would be my choice.
Plus, Switzerland escaped the prison of nations, the EU (ref. Nigel Farage). How about Glasgow? … or Svalbard?
Sadly the UN would be safe from sea level rise in Glasgow as the Scottish landmass is still rising relative to sea level as it rebounds from the last ice age. But of course their pronouncements will eventually be met with the typical Scottish dismissal of someone who claims to have great knowledge.
“Really! Aye, ma faither kent him!” (Translation: “Really! Yes, my father knew him!” Yawn!
+10!
Dang. The author had to get all sciencey and spoil the dream.
No need to move. Sea level has no effect on NYC.
http://www.rockyhigh66.org/stuff/nyc_manhattan_sl_animation.gif
2100, huh? Well, I won’t be around to even notice it, so someone drop me a note, okay?
What a dingbat!!!
James Phelps, Ph.D. “We should play this …” –
Fasten seat belts, tsunamis in Switzerland:
https://www.google.com/search?q=tsunami+in+switzerland&oq=tsunamis+in+Switzerland+&aqs=chrome.
Just to be sure, as a precaution, the UN should relocate now. ASAP.
I would support the US paying to relocate them to N. Korea, where they will be best able to reduce their carbon footprint.
but they would have more fun in Burkina Faso…
Selective photos? It appears the 100 year old photo has a LOWER sea level than the current one!
note the title word “catastrophic”
No, it’s the opposite — the 100 year old photo has a HIGHER sea level than the current one. Look again — I think you did some sort of mind/eye reversal.
Forget the water level ,look at the high tide line on the rocks.It’s barely indistinguishable.
That was my conclusion also. Same – Same.
But the West Side highway has been flooded for some time now, hasn’t it?
the difference between high tide and low
the difference between true believer and not so much
The high tide mark is clearly visible on the 2017 photo. Not to much on the 1898 view.
But if you play with good ol’ Microsoft Photo Editor’s balance and also attempt to match-up the same portion of the sea wall with the mirror image,
it looks like there isn’t a lot of difference in 119 years.
Thanks for doing this.
Which makes this National Geographic cover all the more absurd.
http://wattsupwiththat.files.wordpress.com/2013/08/natgeo_statue_liberty_sea_level.jpg?resize=275%2C400
Max Hugoson – Well, the difference in tide level in New York city is 5.9 feet. Without knowing exactly when on the tide scale these photos were taken, we really cannot tell with certainty. I trust the graph which states that sea levels have risen.
You know about tides right?
You are mistaking NO concrete seawall in the older photo for a higher sea level. Look at the more recent photo: concrete seawall to protect the island is in place, has been for some time.
Sara, A comment on the island, and not so much on Sea Level
The wall seen in the earlier picture is the outer wall of what became known as Fort Wood, which had been completed just prior to the War of 1812 on Bedloe’s Island. The Pedestal of the Statue of Liberty was built inside the Fort, which had fallen into disuse.
You may notice that there are buildings between the wall and the water in the earlier picture. The closeness of the Fort to the water in the 1800s (prior to land reclamation) can be seen in the picture at
http://2.bp.blogspot.com/-oeiM-aA6mak/VUbzGehKq4I/AAAAAAAARfc/fGxLCAoWTZw/s1600/50728b-Fort%2BWood%2Bon%2BBedloe's%2BIsland%2C%2Bnow%2Bthe%2Bbase%2Bof%2Bthe%2BStatue%2Bof%2BLiberty%2C%2Band%2Bships%2Bin%2BNew%2BYork%2BBay%2C%2B1860.jpg
The land around the fort was reclaimed, enlarging the island in the 1930’s. The ‘Sea Wall’ you identify also serves as a retaining wall for the grassy soil surrounding the Fort exterior walls, as seen from above at
If you go and look at harbour walls (Or even the tide gauge records) in old British Naval ports like Portsmouth (16th century?), Gosport, Exeter, Plymouth that are hundreds of years old for instance you will see no distinguishable difference in sea levels.
Who is this Zoë Schlonger, anyway?
According to her map, it looks like Clinton, (Bill? Hillary?) and even young Chelsea will be drowned. I don’t suppose they’d have enough sense to walk up hill.
Maybe that would be sad, but I’m not holding my breath.
FYI, “Clinton” and “Chelsea” are neighborhoods in Manhattan. The “Clinton” neighborhood is also known as “Hell’s Kitchen”.
Regards,
Bob
Not sure, a type of vibrator, I think.
Another FYI, and further evidence of sloppy fact checking: on the map, “Tutor” City should be Tudor City
If Zoe Schlaenger didn’t exist, would it be necessary to invent her?
A discernible correlation between sea level rise and the UN, is evidence of a first-order forcing of [catastrophic] [anthropogenic] climate change. It may already be too late to debureaucratize the institution.
https://www.bbc.co.uk/news/world-europe-50864569
Given the rate at which gargantuan, UN-sized bureaucracies operate, the UN might not have enough time to relocate before it’s too late. 😉
Given the increasing size of the UN and its parasites, isn’t that end of Manhattan in danger of tipping over?
(I think Rep Hank Johnson of GA would be the one to answer that.)
I once read an scientific paper that claimed that even if all the ice in Greenland melted, and that would add about 23 feet of sea level to the global ocean, that the local sea level around Greenland and northern Europe and norther NA wouldn’t go up at all and might even fall slightly, due to the gravitational attraction that the GIS plays on the local gravitational Geoid. The melted water would slowly migrate towards the equator, and then at some point would collect at the antipode of Greenland (on the opposite side of the planet) I wish I could find a link to that older scientific paper. I hope some smart folk here can elaborate if there is any truth to this.
Sea level isn’t flat, as many of us here know. As measured from the centre of the Earth. For instance, the Pacific is about 18″ higher on the Pacific side of the Panama Canal than the Atlantic side, due to all kinds of factors including tides, currents, winds, salinity etc, but mostly gravitational geoid. It is a complicated equation for sure. But the alarmists assume the ocean is just a big bath tub and water in equals rising oceans everywhere. If this isn’t true, or even if the general principal is true I described above, then what we need to worry about in the northern hemisphere is Antartica melting, and not the GIS. And with an average temperature below -50 in Antartica, it ain’t melting anytime soon. It may even be acquiring mass which would then lower sea levels x2 in the northern hemisphere. Sea level scare tactics have to be the weakest of all, since as we see in the two pictures above, there isn’t much difference in sea level in the last 125 years. Nothing to be ‘alarmed’ about. But it is fascinating science, and I hope to learn more.
True, but the zone where sea level would sink does not extend as far as New York. the “zero line” is somewhere in Nova Scotia.
Is there some way to get this done by 2025?
It is very much en vogue and stylish these days for leftists to write scary articles like that, quite trendy. Imagine lying like that for a living and thinking you are doing some good some how because someone some where is going to…what…give up a nice life style and live in a mud hut? I doubt it.
“This is what Catastrophic Sea Level Rise Looks Like” …
I don’t see much sign of sea level rise from between those two photos, but I just noticed it sure looks like the Statue of Liberty used to be just black and white. Sometime after 1898 it acquired color. I was really confused about this but I found an explanation here:
So maybe CO2 is really responsible for the greening (and blue-ing and red-ing) of the planet?
Science sure is wonderful.
(Sorry, but I could not locate an image of that Calvin & Hobbes cartoon — it’s a classic).
My favorite C&H 🙂
Found it here:
http://calvin-and-hobbes-comic-strips.blogspot.com/2011/11/calvin-asks-dad-about-old-black-and.html
Anthony Watts
1. It is imho evident that the lady’s article is based on global data, and not on that of the local tide gauge in NY.
Sea level is a rather global affair; we cannot simply deduce the estimate for New York’s future solely from what its local tide gauge tells us.
*
2. “Note that the trend is steady, there’s no acceleration seen in the data.”
Sorry, but this is not correct. You see no acceleration because you look at a linear estimate. Applying a quadratic fit to the gauge’s data would be the right way.
Please download the gauge’s data, from NOAA or PSMSL:
12; 40.700000; -74.013333; NEW YORK (THE BATTERY)
enter it into a spreadsheet calculator and let the guy compute the trends for periods starting with e.g. 1900, 1950, 1980, and 1993 (the beginning of the sat altimetry period).
You should obtain the following linear trends, in mm/yr:
1900-2018: 3.04 ± 0.05
1950-2018: 3.05 ± 0.11
1980-2018: 4.23 ± 0.25
1993-2018: 3.84 ± 0.47
I suppose you will agree that if there was no acceleration, all trends would be nearly equal (like they indeed are for 1900 >< 1950), regardless the period's starting year.
The tide gauge at 'The Battery' shows, for 1993-2018, a trend higher than the satellite altimetry data of both NASA (3.0 ± 0.04) and NOAA (2.87 ± 0.03 mm/yr).
Rgds from Germany
J.-P. D.
Thanks Bindidon, no one else on this site is capable of performing simple mathematics.
Using your logic (and calculations): since the trend from 1993-2018 is less than the trend from 1980-2018, then you agree that sea level rise is decelerating?
Further, let’s use your highest trend to evaluate the author’s catastrophic flooding scenario.
4.23 mm/year x 81 years = 343 mm.
Metric to Imperial conversion is too difficult for me. Does 343 mm equal approximately six feet?
Yes. (with appropriate error bars)
343mm – approx 1 foot (1.125)
1 foot +/- 5 feet – good enough for UN work
Of course, +5 is more likely than -5 to the doom-mongers. Run away! Run away!
Pillage Idiot
First of all, I have nothing to do with ‘the author’s catastrophic flooding scenario’.
You wrote:
“Using your logic (and calculations): since the trend from 1993-2018 is less than the trend from 1980-2018, then you agree that sea level rise is decelerating?”
No of course I don’t agree. Because you can’t simply rely on just one gauge to decide upon that.
Here is a comparison of various tide gauge evaluations, together with NOAA’s altimetry data:
https://drive.google.com/file/d/1lEPxHjjCBXm8HguhOM6MzlqTTYkSKQPI/view
Here you see how gauge trends differ, depending of where they stay:
https://drive.google.com/file/d/1MKN4zBzgKIwM9BPBOS6M7Vwoqzm7ahSi/view
(the graph does not reflect the virtual land movement around the gauges yet).
“Sea level is a rather global affair”
Not at all. It varies widely geographically depending on the reason for the rise:
“Sorry, but this is not correct. You see no acceleration because you look at a linear estimate. Applying a quadratic fit to the gauge’s data would be the right way.”
Only if you know that the sea level rise is a quadratic process. Remember, you can fit a quadratic to a completely random data set and get an “acceleration” (or “deceleration”).
“I suppose you will agree that if there was no acceleration, all trends would be nearly equal (like they indeed are for 1900 >< 1950), regardless the period's starting year."
No, because the acceleration might instead be in subsidence, not in sea-level rise. Which seems likely as Sandy Hook GPS recorded a subsidence of 1.83 +- 0.29 mm/year in 1995-2006:
https://www.sonel.org/?page=gps&idStation=1895
but 2.65 +- 0.26 mm/year in 2006-2017:
https://www.sonel.org/?page=gps&idStation=1896
Which suggests that the absolute sea-level rise is fairly steady at about 2 mm/year, in New York as elsewhere.
Excellent!
tty
“Which suggests that the absolute sea-level rise is fairly steady at about 2 mm/year, in New York as elsewhere.”
No, certainly not, unless you give us a clear proof that people like Dangendorf & al, or Grant Foster were wrong in their evaluations, which very well considered vertical land movement.
I did not, because Anthony’s graph doesn’t suggest it.
– Dang 1900-2016:
https://static-content.springer.com/esm/art%3A10.1038%2Fs41558-019-0531-8/MediaObjects/41558_2019_531_MOESM2_ESM.txt
– Foster 1850-2018:
https://drive.google.com/file/d/1UaePmF9fkKWK6pUxPWgZhuhTP-EvMud6/view
Please, please stop supposing/suggesting, tty, go into the same job, and present us your results.
Here is a comparison of C&W, Jevrejeva, Dangendorfg & al., and Foster:
https://drive.google.com/file/d/1lEPxHjjCBXm8HguhOM6MzlqTTYkSKQPI/view
You know the rule, tty: ‘Put up, or shut up…’
*
By the way, I have all the SONEL data on disk, and it failed in giving sufficient data for the 1500 PMSL tide gauges. I chose therefore to rely on the data set provided by Maike Schumacher & al.:
https://doi.pangaea.de/10.1594/PANGAEA.889923
… but I’m still far from having reached the Dangendorf/Foster level!
Rgds
J.-P. D.
“I did not, because Anthony’s graph doesn’t suggest it.”
So you are unaware that almost the entire East and Gulf coast of the US is subsiding? You for sure don’t know much about geology, but that is hardly news.
Another interesting example of the non-acceleration. Kungsholmsfort in Sweden. Has sea-level data since 1886. When the Mareograph was built it happened to be placed exactly on the line where the postglacial isostaitic rebound was equal to the sea-level rise, so no relative sea level change. Now, 133 years later there is still no relative sea level change:
Average sea-level in 1886: 7037 mm
Average sea-level in 2018: 7006 mm
By the way there is a GPS station there too, SONEL No 2075, if you are interested, but it was only installed in 2005.
Excellent!
tty
1. “So you are unaware that almost the entire East and Gulf coast of the US is subsiding? You for sure don’t know much about geology, but that is hardly news.”
Thanks for your nice evaluation, much appreciated! Indeed: I don’t know much about geology.
Extra for you I generated two charts out of test data showing you which kind of GPS sources I use for VLM correction in coastal areas.
a) Schumacher & al.
https://drive.google.com/file/d/1CvoyghSoVClZI_gC7e6_AdinBJhWGvLt/view
b) SONEL
https://drive.google.com/file/d/1j-DC8bDvrnw9eW2iOeGTiFpGqiy96cDg/view
810 2.5 degree grid cells covered by Schumacher, 307 by SONEL. So I chosed Schumacher, unless somebody tells me it’s the wrong choice… This is after all no professional work!
*
2. “Another interesting example of the non-acceleration. Kungsholmsfort in Sweden.”
One more time, you pick one and only one example fitting to your narrative, and moreover you avoid speaking about… isostatic rebound around the gauge.
But I know what you mean, here is a graph showing a corner certainly well known to you (of course not integrating GIA data yet):
https://drive.google.com/file/d/1T123C5bVwbqnmHKdLZLBXfcKLUAjxzeD/view
And here is a preliminary example of GIA integration – the PMSL gauge station 203 near Furuögrund, to which a Schumacher GPS station (SKE0, 21.048291 64.879198 10.314 0.291), near Ostvik, distant by 11 km, is associated:
https://drive.google.com/file/d/1OorK5Kks2qlya9DmlaPR5Ew8HBiXTLTo/view
For Kungsholmsfort the job isn’t so easy because
– SONEL 2075 is not in the GPS station file and has no robust data, as is visible on
https://www.sonel.org/spip.php?page=gps&idStation=2075
– the nearest GPS station in Schumacher’s file (OSK6, 15.996867 57.065676 2.890 1.089) is over 100 km away. Nevertheless we obtain this:
https://drive.google.com/file/d/1cZB1vNyIZD23EsWzDBetTUO2-moYx8xU/view
The data is kept despite the distance because the difference between gauge and altimetry (1.7 mm/year) gives for my layman job an acceptable comparison with the GPS correction for the gauge (2.9 ± 1.1 mm/year).
*
Do the same job, tty, and then we can start talking about serious things.
God jul!
J.-P. D.
tty (cntnd)
A little paragraph is missing concerning the non-acceleration in Kungsholmsfort’s data.
I’ll come back to that.
tty
As you can see below, the job isn’t quite simple:
https://drive.google.com/file/d/1L47J-28HKdX58oM1GHpPs7Z-yCCYtvIy/view
The green plot is where in fact the red one should be 🙂
Learning by doing has always been my favorite rule.
Thanks for Bamber Map, especially 1 and 2 with blue around West Antarctica and Greenland.
Yeah… not exactly. Did you notice that in December of 2008 sea level DECLINED and did so several times over the next few years yielding a recent trend over the last decade of essentially ZERO? It all depends on when you start and end your analysis. Over the entire record, there are brief periods of acceleration followed by deceleration and sea level decline. The overall, long term trend is the best trend for estimating future sea level rise and it stands as posted, 2.85 mm/yr.
stinkerp
“Over the entire record, there are brief periods of acceleration followed by deceleration and sea level decline.”
That’s evident, stinkerp!
This is the reason why you have to take numerous gauges into consideration, and to build an average of their (VLM corrected) data.
See replies to tty and Pillage idiot for data and graphs.
How about the gauge next to the biggest piece of ocean in the world?
The latest Mean Sea Level recording at Fort Denison in Sydney Harbour is four and a half inches LOWER than the first recording taken 105 years ago.
The increasing size of Pacific atolls supports this as well:
http://www.bom.gov.au/ntc/IDO70000/IDO70000_60370_SLD.shtml
spangled drongo
“The latest Mean Sea Level recording at Fort Denison in Sydney Harbour is four and a half inches LOWER than the first recording taken 105 years ago.
The increasing size of Pacific atolls supports this as well…”
This is the reason why you have to…
*
https://drive.google.com/file/d/1kLZZQH-zQjkWMvwT72JxAM34cLPOUjMr/view
(without GIA correction through GPS data)
Remember that when the “biggest piece of ocean in the world” is not rising [falling, actually] then the chance of world SLR is pretty remote.
And when the world’s tide gauges have not had long term GPS chips on them, they are not a counter argument.
Fort Denison, BTW, is sinking slightly, making current MSL even lower.
spangled drongo
“Remember that when the ‘biggest piece of ocean in the world’ is not rising [falling, actually] then the chance of world SLR is pretty remote.”
Falling actually? Sure sure?
I hope you at least did not deduce that from the one Fort Denison station!
If you didn’t : where then did you get that from?
Don’t tell me you got it from (No?)TricksZone:
https://tinyurl.com/u8n7h5s
This info is based on 100+ year gauge stations, i.e. exactly ten for the whole Pacific! Ten of over 250 available Pacific PMSL sites (330 at U Hawaii), of which over 100 remain when you exclude those which couldn’t contribute to the reference period I use (1993-2013).
*
“And when the world’s tide gauges have not had long term GPS chips on them, they are not a counter argument.”
You can’t simply pretend that. You have to scientifically contradict the VLM corrections applied by using the nearest GPS station(s) around the gauges.
Here are all PMSL stations you can obtain for the Pacific (from 50N down to 60S, and from 145E to the coastal line of North/South America:
https://drive.google.com/file/d/1Tm_hpC1oRBdShSjJ-wBo7w8kb2g9cuHR/view
Here is a plot with as comparison Grant Foster’s data for the Globe (a more professional elaboration, with OLS-based anomaly construction):
https://drive.google.com/file/d/1I2OygDuLhB_N0Ra5cOQfwXKzkCdC1q8R/view
The red data has a higher trend, yes! But no: it is not due to the stations’ lifetime, but to my severe exclusion of stations unable to provide sufficient data for the reference period.
Trend for 1880-2018: 2.2 ± 0.03 mm/year (like Jevrejeva, i.e. too high compared with Foster).
For 1993-2018: 2.6 ± 0.12 mm/year (OK).
So, sorry: no falling trend in the Pacific.
Estimated acceleration since 1950: 0.03 ± 0.004 mm/year². Not very much!
Rgds
J.-P. D.
Bindidon
First calculate how much Ft Denison is actually sinking. That will wipe out any “official” SLR there.
“If you didn’t : where then did you get that from?”
If you had been involved in sea front infrastructure and other marine construction, general observation etc. for over 70 years around the pacific, as I have, you would see evidence of current highest tides being up to a foot lower than they were in the ’40s and ’50s based on very accurate benchmarks that in turn were based on local council assessed, MSL benchmarks.
You would see evidence of ocean-front homes that were being washed out to sea 50 years ago now changing hands for tens of millions.
You would see evidence of ocean beaches with hundreds of acres of extra sand that just wasn’t there in those times.
You would see evidence of surf board riders complaining that their favourite point breaks no longer work because today there is too much beach.
When the evidence from Pacific atolls, and people like Nils Axel Morner who have spent lifetimes more specifically involved, agree with what I list above, world SLR based on conjured satellite altimetry, is something to be very sceptical about.
spangled drongo
“First calculate how much Ft Denison is actually sinking. That will wipe out any “official” SLR there.”
I can do that. But it’s now 3:15 AM at UTC+1…
At the end of the Bothnian Gulf between Sweden and Finland, the gauges are raising, raising… 10 mm/year! That’s the reason why people evaluating sea levels actually use vertical land movement data based on GPS.
*
“… world SLR based on conjured satellite altimetry, is something to be very sceptical about.”
Sorry: I didn’t mention sat altimetry anywhere.
But the comparison of the two methods is as it is:
1. 1880-2015
https://drive.google.com/file/d/1QsWSiByU9jZONeW0ixkrocumRCPvIBWl/view
2. 1993-2015
https://drive.google.com/file/d/1v77IZgLwKsdob0YfgMQZVm6sS1AUKW1Q/view
I have made a similar job, even if not so professional as theirs, and can only confirm their results.
I hope you don’t belong to these strange people pretending that tide gauge data is manipulated worldwide since 1993 in order to give a fit to altimetry data…
Rgds
J.-P. D.
The fact that long term tide gauge data is consistent speaks for itself.
But have you considered that when tide gauge data isn’t fully audited and corrected for vertical land movement that for the satellites to agree they would have to be somewhat fiddled with?
Your graphs don’t show the “errors” of Envisat.
The main thing people can do is pay attention to local HATs and sea fronts over long periods and the truth will eventually dawn on them.
The most believable graph is a wet one.
spangled drongo
“The fact that long term tide gauge data is consistent speaks for itself.”
Consistent with what? What do you mean here?
Anyway: like there is no perceptible difference between CONtiguoUS temperature data coming from the best, pristine USHCN and USCRN weather stations and all the 18000 around them, you might be surprised by this graph below, in which I compared the data of all available PMSL tide gauges with those having a lifetime of at least hundred years:
https://drive.google.com/file/d/1UsJgaymQYMGiR1Vxc6cghgzBI5baeor0/view
The trend and standard error differences are negligible. And this is a bit strange when you compare the 100y+ distribution with the rest:
https://drive.google.com/file/d/1_XDvRE3E5qzy0vAgv2fli36wGYktiV1F/view
“But have you considered that when tide gauge data isn’t fully audited and corrected for vertical land movement that for the satellites to agree they would have to be somewhat fiddled with?”
Here you become really disingenuous. How can you pretend that?
Look at the work made by Dangendorf & al., and please manage to learn out of it, instead of insinuating and discrediting.
Good luck.
Bindidon
Thanks for confirming the consistency in the long term tide gauges.
But you feel that satellite altimetry also covers vertical land movement?
Was that what Envisat was up to?
Wow!
Bindidon,
I don’t think you followed your logical chain to completion. Look at this from a purely Physics 101 perspective: our starting time and relative velocity are zero at 1900. By 2018, 119 years later, the velocity should be (we’ll use your rate for the period) 3.04 mm/y ±0.05mm. Since the graph is in meters, we’ll set the velocity at 0.00304 m/y.
I believe the correct equation to use here is v=at. For delta v = 0.00304m/y and time t = 119y we have
a = v/t = 0.00304/119 = 0.000025m.y^2 = 2.5E-5m/y^2
That’s the acceleration that gives us a 3.04 mm/y delta v. But what kind of s curve do we have?
If s = 1/2at^2, then s = 1/2 (0.000025 * (119^2) ) = 1/2(0.000025 * 14161) = 1/2( 0.354) = 0.177 m. That’s half the observed rise.
It seems obvious that if the entire series from 1900 to 2018 is used to get the rate of 3.04 mm/y, the acceleration needed to get there in that time period does not produce the observed s, and the curve looks nothing like the straight line seen in the data plot.
The plot of the Battery tide guage is not logarithmic; it’s just a straight s=vt plot, no more.
James Schrumpf
You are right, I made here a rather wrong assumption.
But it is not a problem you can solve by just using a ‘Physics 101 perspective’.
There are lots and lots of data looking so pretty ‘s=vt’ upon a quick eye-balling, but which in fact look quite different when using statistic methods.
Look at an explanation here:
https://tamino.wordpress.com/2019/12/10/a-century-and-more-of-sea-level-acceleration/
*
By the way, I remember that you too managed to generate anomalies out of temperature time series like GHCN daily.
What about transposing your stuff to PSMSL data:
https://www.psmsl.org/data/obtaining/rlr.monthly.data/rlr_monthly.zip
and comparing your results with those of Church & White, Jevrejeva & al, Dangendorf & al, and, last not least, Foster aka Tamino?
Remember the good old flipper times: It’s more fun to compete 🙂
Rgds
J.-P. D.
I am not impressed by the picture of the Statue of Liberty. The tide could be lower in the second picture.
Gee, maybe Manhattan’s area will go back to what it was 4oo years ago.
Of course, that assumes we forget how to reclaim land from the sea and other useful engineering projects.
Unfortunately, given what’s being taught in schools these days and the…errr…temperament of today’s students, that may actually happen.
Schlang = snake, work
Schlang snake, worm
Evacuate the U.N. immediately. Problem solved. I suggest Amsterdam, as much of that prosperous, highly productive, and well-populated country is already below sea level.
The UN claims victim status.
What took it so long?
Six feet = 1,829 mm, so that sea level rise between now and 2100 would have to accelerate to 22.9 mm/year, about 8 times faster than the average sea level rise rate at the Battery over the last 170 years.
But if Zoe Schlanger wants to prove her point, let’s send her on a one-way trip to Greenland with a blowtorch, and see how much ice she can melt over the next 80 years.
It looks possible that in the next century or two the world will lose the ability to power its cities and that they will descend into ruin, therefore sea level rise will be of little consequence. It is a choice of sinking into anarchy sooner or later and my choice is to put it off for as long as possible. Making full use of uranium in nuclear power stations would help to keep civilization going as long as possible, hopefully buying us enough time to get nuclear fusion to work. What is the maximum amount of nuclear power stations that it would be sensible for the planet to have to make best use of uranium ? Ideally how many 2 GW nuclear power stations should be built ?
I watched Youtube video , “Bill Gates on AI, Climate, Carbon Tax, Nuclear Power, China” from November 21st 2019. Bill Gates talked with Bloomberg Editor-in-Chief John Micklethwait at Bloomberg’s New Economy Forum in Beijing. He thought present design nuclear power stations were noncompetitive and too prone to human error. How can people who think climate catastrophe is likely turn round and complain that nuclear power is too expensive ? Is it actually wisest to mostly rely on gas power stations for the next few decades while gas from fracking is abundant & cheap then switch to more nuclear power later ?
Alex
“What is the maximum amount of nuclear power stations that it would be sensible for the planet to have to make best use of uranium ? Ideally how many 2 GW nuclear power stations should be built ?”
I don’t go here into the tremendous waste problem caused by nuclear plants during electricity production and upon dismantling. All over the world, the waste remaining after fuel rod reprocessing, and all decommissioned plants still await final solutions.
Here is a paper discussing that (it is dated 2011).
https://ieeexplore.ieee.org/stamp/stamp.jsp?arnumber=6021978
He thinks that 15000 (fifteen thousand) 1 GWel nuclear plants would be necessary to get rid of fossil fuel use.
This of course doesn’t mean to simply get rid of it within the current electricity production, but to get rid of ALL fossil fuel use, including worldwide traffic etc etc.
According to a BP study, Mankind consumed around 14 billion oil units or 160 petawatthours of energy in 2018. 80 percent of this was covered by burning fossil fuels such as coal, oil and gas.
“… hopefully buying us enough time to get nuclear fusion to work.”
It’s a bit hard to be optimistic here:
– we currently can’t implement nuclear fusion other than using the deuterium/tritium mix: that means breeding tritium out of lithium in blankets, and very aggressive neutrons;
– research and development on the tokamak system started around 1957, the current prototype ITER is far away from working, won’t do much more than solving the plasma containment problem, and its successor DEMO, thought to integrate the tritium breeding blanket management, is not expected to present results before… 2080.
Hmmmh.
Sea level changes on the east coast of the USA are also caused by the same forces that speed up and slow down the Gulf Current that moves northward near the coast. Local sea level changes are not a trivial problem.
otsar
“Local sea level changes are not a trivial problem.”
Exactly!
And… that’s the reason why some people do such incredible work to move step by step toward a credible solution:
https://www.pnas.org/content/114/23/5946
This is yet another example of The Greta Effect: Never let facts get in the way of an earnest opinion
In the immortal words of John Mc Enroe ‘‘ they cant be serious !!’’
Insane predictions just keep coming & coming with no reference nor mind paid to what real world geological data has & is continuing to tell us….
Never mind the facts….