Review ENVIRONMENTAL SCIENCES
The polar regions in a 2°C warmer world
Science Advances 04 Dec 2019:
Vol. 5, no. 12, eaaw9883
DOI: 10.1126/sciadv.aaw9883
Abstract
Over the past decade, the Arctic has warmed by 0.75°C, far outpacing the global average, while Antarctic temperatures have remained comparatively stable. As Earth approaches 2°C warming, the Arctic and Antarctic may reach 4°C and 2°C mean annual warming, and 7°C and 3°C winter warming, respectively. Expected consequences of increased Arctic warming include ongoing loss of land and sea ice, threats to wildlife and traditional human livelihoods, increased methane emissions, and extreme weather at lower latitudes. With low biodiversity, Antarctic ecosystems may be vulnerable to state shifts and species invasions. Land ice loss in both regions will contribute substantially to global sea level rise, with up to 3 m rise possible if certain thresholds are crossed. Mitigation efforts can slow or reduce warming, but without them northern high latitude warming may accelerate in the next two to four decades. International cooperation will be crucial to foreseeing and adapting to expected changes.
INTRODUCTION
Earth has warmed by approximately 0.8°C since the late 19th century, while the Arctic has warmed by 2° to 3°C over the same period (Fig. 1A) (1). Conversely, the Antarctic has experienced more pronounced interannual and decadal variation in mean annual temperature anomalies than the Arctic, with no obvious upward trend in the last two decades (Fig. 1A). Spatially, observed warming has been markedly heterogeneous in both regions during the more recent instrumental satellite record (since 1986), with both warming and spatial variability in warming having increased more for the Arctic than the Antarctic over the past 13 years (Fig. 1B) (2, 3). Therefore, despite similarities in defining characteristics such as pronounced seasonality and the year-round presence of ice and snow, these two regions may face different futures in response to ongoing warming.

Fig. 1 Temperature trends and variability for the Arctic and Antarctic regions.
(A) Annual mean anomalies of the combined Land-Ocean Temperature Index (L-OTI) for the Arctic (64°N to 90°N), Antarctic (64°S to 90°S), and globe between 1880 and 2018 (zonal data bins defined by data acquired at https://data.giss.nasa.gov relative to the mean period 1951–1980). Temperature anomalies for the Arctic during each of the four IPYs, the first of which was based in the Arctic, are highlighted in purple. (B) Annual [January to December (J-D)] mean temperature change (°C) in the Northern (left) and Southern (right) hemispheres for 1986–2005 (upper) and 1986–2018 (lower) relative to the mean period of 1951–1980. Generated from the NASA/Goddard Institute for Space Studies (GISS) online plotting tool (2); the GISS analysis is based on updated Global Historical Climatology Network v3/SCAR (2, 3) and updates to Analysis (v3).
Having arrived at the 10th anniversary of the Fourth International Polar Year (IPY), a milestone that intensified focus on observed and expected changes in the polar regions, we review key environmental and ecological impacts of warming over the past decade. We also review ancillary effects of polar warming at lower latitudes, for which evidence has mounted recently. Over the past decade alone, the Arctic has warmed by 0.75°C relative to the mean for 1951–1980, while the Antarctic has remained comparatively stable (2009–present; Fig. 1A). Our emphasis is on consideration of consequences for atmospheric, cryospheric, and biospheric changes in the polar regions, as Earth continues to approach 2°C global mean warming (Table 1). Hence, we first consider the expected magnitude and pace of warming in the Arctic and Antarctic under two carbon emissions futures: Representative Concentration Pathway (RCP) 8.5 and RCP4.5 scenarios. We then outline potential consequences of such warming on the basis of recent observed changes in both regions. While our retrospective assessments of warming to date (Fig. 1) refer to temperature anomalies relative to the period covered by the instrumental record (1880–2018) (2) and a baseline mean period (1951–1980), our projections of expected warming are presented relative to the Intergovernmental Panel on Climate Change (IPCC) standard baseline period (1981–2005) (4).
The most recent generation of general circulation models in the Coupled Model Intercomparison Project Phase 5 (CMIP5) indicates that the Arctic is expected to continue to warm much more rapidly than lower latitudes, even under the moderate carbon mitigation trajectory characterized by the RCP4.5 scenario. The Arctic is expected to achieve an additional 2°C annual mean warming above the 1981–2005 baseline approximately 25 to 50 years before the globe as a whole under the business-as-usual (RCP8.5) and moderate mitigation (RCP4.5) scenarios, respectively (Fig. 2, A and B). The Antarctic, in contrast, is expected to lag slightly a 2°C global mean warming under the business-as-usual scenario (Fig. 2C) but reach 2°C annual mean warming slightly earlier than the globe under the moderate mitigation scenario (Fig. 2D). Under both scenarios, Antarctic warming is expected to outpace global mean warming only during austral late autumn and winter months (Fig. 2, C and D).

Fig. 2 Approximate year by which the 2°C warming threshold is reached for the Arctic and Antarctic compared to the globe as a whole.
Expected time to 2°C warming above the 1981–2005 mean under RCP8.5 (red) and RCP4.5 (blue) for the globe (open circles) compared to the Arctic [solid circles; (A and B)] and Antarctic [solid circles; (C and D)]. Means of 36 CMIP5 ensemble runs by Overland et al. (1) are shown. In (B) and (D), symbols positioned at year 2100 indicate that 2°C warming could be at 2100 or later.
The Arctic may experience as much as 4°C mean annual warming and 7°C warming in late boreal autumn, when a 2°C global mean warming above the 1981–2005 mean is reached, regardless of which RCP scenario is considered (Fig. 3, solid circles) (1). Particularly notable is the 13°C Arctic warming projected for boreal late autumn months by the end of the 21st century under a business-as-usual scenario (RCP8.5) (1). Annual mean warming in the Antarctic is expected to reach approximately 2°C under both scenarios, with slightly greater warming possible under RCP8.5 during the austral autumn and early winter (Fig. 3, open circles). Hence, mitigation of carbon emissions with a target of constraining global annual mean warming to 2°C may not constrain the annual mean warming in the Arctic or Antarctic to below 2°C. However, mitigation of carbon emissions can delay the crossing of the 2°C annual mean warming threshold for the Arctic, as suggested by the difference in time to annual mean 2°C warming between the RCP4.5 and RCP8.5 scenarios in Fig. 2.

Fig. 3 Greater warming likely in the Arctic and Antarctic with 2°C global warming.
Expected magnitude of monthly and mean annual warming above the 1981–2005 mean in the Arctic (solid circles) and Antarctic (open circles) with 2°C global warming under RCP8.5 (red) and RCP4.5 (blue) according to 36 CMIP5 ensemble runs by Overland et al. (1).
Recognizing the urgency of the magnitude and pace of ongoing and expected future warming in the polar regions, we present below a series of eight urgent considerations spurred by developments over the past decade. These are followed by a brief, concluding overview of international agreements in the Arctic and Antarctic as exemplars for cooperative scientific and political engagement that is likely necessary for addressing the complexities of expected climate-related changes in the polar regions. Our objectives are to catalyze consideration of potential consequences of a 2°C warmer world for the polar regions and to thereby inform policy considerations of these consequences. A key emergent feature of this synthesis is that direct comparisons of ongoing and expected changes in the Arctic and Antarctic are rendered difficult by the relative inaccessibility and data scarcity of the Antarctic compared to the Arctic. This disparity is especially evident in our capacity to anticipate expected changes to terrestrial ecosystems in the Antarctic. We stress that this synthesis is not intended as a comprehensive review of recent and growing emphases in polar research, some notable examples of which include arctic ozone dynamics (5, 6), Southern Ocean heat uptake from the atmosphere (7), and associations between Southern Ocean warming and ice sheet dynamics on land (8).
HT/rd50
Meanwhile the oceans are in trouble too.
https://amp.theguardian.com/environment/2019/dec/07/oceans-losing-oxygen-at-unprecedented-rate-experts-warn
More scaremongering from the Guardian
To be fair to the Guardian (not easy , but it is getting close to Christmas) , they do conclude that the most significant immediate action would be to stop overfishing.
The peril to , eg, sharks and rays from 3% less oxygen in the water is probably far lower than that from the custom of Asian fishing vessels to catch sharks , cut off their fins for soup or “medicine” and throw them back , alive but unable to survive. Not that we in the West are any better. The bycatch, thrown back dead, from EU trawlers in the seas around Britain is as bad . Another fad seen in the health food shops everywhere is for “life enhancing” oils from Antarctic krill, obtained often by Australian and NZ vessels. We are all as bad as each other in regarding the sea as an infinite resource.
The absence of fish from the Med should be a warning. The renowned cook, Rick Stein, in his latest jaunt in France found only one fisherman on the Languedoc coast successfully landing any catch. Climate change is of minor significance(IMO).
“We are all as bad as each other in regarding the sea as an infinite resource.”
Need to provide some data. The word “sustainable” gets overused and misused. However there is a crucial difference between harvesting at rate that allows the population to replenish itself versus one that drives it to or near extinction.
I don’t have the data but there’s a lot of krill in the ocean and not everyone is taking those supplements. Anecdotal evidence from the Mediterranean might not be an appropriate comparison either.
Lets be fair the guardian is simply reporting another DOOM report for COP25 they didn’t start this one themselves, they are just pushing the agenda. The moment you see the report is for COP25 everyone probably junk meter goes up a notch. I haven’t looked at the report yet and I will download it and read thru it over the next week. However it’s an extraordinary claim so you hope from a science point the evidence matches the claim otherwise Climate Science and the IPCC take another credibility hit.
It’s just more garbage.
This paper reads like a political pamphlet. Did he cite Greta Thunberg?
A lot of “may”, “could” and “possibly” woven into that. Another ten minutes of my life gone, that I could have been doing something useful. Wake me up when they start using, “will” to describe future events. Until then, I “will” be busy hacking back the overgrowth in the garden and woodlands. I love CO2, all that greening is great to see, but without my fossil fueled aids to cope, it would be a struggle.
NB Can someone also bring some of that global warming, we hear so much about, over here. I could do with it.
Agreed, though I did not waste 10 minutes of my life reading the whole paper. Science is not “may”, “might”, etc. That’s called “guessing” and people used to grow out of that stage somewhere around 8 or 10 years of age. Adults knew there were many unknowns and didn’t fall for the psychics and charlatans. Now, the supposed adults fall all over themselves to embrace the insanity. Climate change predicts are 100 percent psychic predictions with no more validity than the woman charging you a dollar minute to talk to a California psychic. At least the climate change charlatans could be honest enough to properly label their bunk.
Sheri
You will be saying next that we don’t have highly accurate and detailed surface and sea water temperatures from the arctic and Antarctic back to 1880 because virtually no one had ever been there, let alone with scientific instruments.
you need to have more faith
tonyb
I add the observation that they are using two very unlikely scenarios that so far bear no resemblance to reality. Why? What’s wrong with realism?
And further:
“Expected consequences of increased Arctic warming include ongoing loss of land and sea ice, threats to wildlife…”
What wildlife? Show me wildlife that is harmed by warming 2 C when it is -20 outside. Show me wildlife that is worse off at -20 C than at -28 C.
Why didn’t the author cite the Antarctic temperature trend from the beginning of data sets?Why is the trend noted from less than two decades ago? Afraid of something, perhaps? Like the reader getting a clue as to what is really going on?
It reads like a catechism.
My reading stopped when I read they were using RCP 8.5. In the 30(?) years since the initial proposed use of RCPs we have had 30(?) years of actual data to compare them against, and so we know they don’t reveal anything useful since they don’t follow what happens in the real world. I swear, this running of a “model” or even worse a table of “what-if” numbers, and then using the output of those models as if it’s “data” for inputs to another model, and then publishing those results as if it’s science has got to stop! Get out of your mama’s basement and go out into the real world, or at least a functioning lab, and collect some real data!
My reading stopped when the word ‘science’ was used in the first line. There is NO science in projection to future conditions. The future can be used to confirm scientific theory made in the past but never the other way around.
From the very beginning, without qualifiers, they would not have any science to talk about. Rod, the only thing they are SURE of is that if the weather is unpleasant its because of climate change and its all your fault because you burn fossil fuel and you need to be stopped.
Actually I miss the days when, if we pointed to abnormally cold winter of unusually high snowfall we “couldn’t conflate weather with climate.” Now, every possible condition is proof of climate change directly linked to man burning fossil fuels.
The Alarmists have lost their collective minds. They are behaving like Democrats trying to impeach Trump, petulant and mentally disturbed, which is why Greta is the perfect mascot for their collective delusion. She IS the perfect poster child. There is no “may”, “could”, “possibly” be about it.
Perhaps this (probable) underwater volcano just west of the weather station at Longyearbyen airport has something to do with this “Arctic amplification” ?
https://earth.nullschool.net/#current/ocean/surface/currents/overlay=sea_surface_temp/orthographic=14.78,76.01,3000/loc=5.494,77.958
Has been active for at least the last 4 years. SE of Svalbard another one is active intermittently during the same period.
The area off West Spitzbergen is a well known upwelling area:
https://www.researchgate.net/publication/248815047_Wintertime_warming_of_an_Arctic_shelf_in_response_to_large-scale_atmospheric_circulation
tty December 7, 2019 at 5:18 am
Thanks for the article. The upwelling at the 2 moorings causes the SST to rise from ~0C to max ~4C.
The hotspot I showed has a surface temperature of ~15C almost year round.
Don’t see where water that hot can be upwelling from, except an underwater volcano.
good call Ben….you can see it on the active volcano map too
here it is http://volcano.oregonstate.edu/oldroot/education/submarine/global-relief-small.gif
Wintertime Warning… seems like a reasonable analysis, last line– “It is important to note that sea ice conditions in such areas will be strongly controlled by interactions with both the atmosphere and ocean.“ They do model, only 21 references, if advocacy or panic, I missed it. Upwelling, even in the more moderate Gulf of Mexico also does some strange things.
Correct or not, in “The polar regions in a 2°C warmer world” using the U word twice in once sentence, among other similar comments, suggests that they are more interested in ACTION! Experts also in ecological consequences?
“Having arrived at the 10th anniversary of the Fourth International Polar Year (IPY),.. ….Recognizing the urgency of the magnitude and pace of ongoing and expected future warming in the polar regions, we present below a series of eight urgent considerations spurred by developments over the past decade. ” They are ruining the concept of an extensive bibliography suggesting that they are doing their homework. When you claim to be an expert in everything, are you an expert in nothing?
tty December 7, 2019 at 5:18 am
Additionally:
the whole area from Iceland poleward and beyond is a well known seismic active area.
See eg:
https://wattsupwiththat.com/2013/08/02/hot-times-near-svalbard-volcanic-range-discovered/
or
https://tambonthongchai.com/2019/10/04/svalbard/
No, it doesn’t.
do look at the temp records for Svalbard, which go back over 100 years and see the recent astonishingly warm period. If I recall correctly, I think most of 2018 was above zero, an unprecedented result.
griff December 7, 2019 at 7:45 am
A recent warm period would match very nicely with recent volcanic activity around Svalbard. The whole area is a volcanic hotspot.
See eg:
https://wattsupwiththat.com/2013/08/02/hot-times-near-svalbard-volcanic-range-discovered/
or
https://www.ngu.no/upload/Aktuelt/CircumArtic/5_SMS.pdf
From personal correspondence with NOAA: there is no volcanic hotspot west of Svalbard. The problem with the wrong (NOAA) data (that are used by Nullschool) will be solved in the nearby future (possibly this year I am told).
In other words, the world’s temperatures are moderating. Time to get back to living,
OK Doomers???
This is before or after its ‘ice free’ ?
But models are great, you can get any results you ‘need’ nice pictures out them and best of all load enough ‘mays and coulds’ and they can ‘prove’ the moon is made of cheese.
So much easier than that hard fact based science were you run the risk of getting the ‘wrong results’ after all your hard work.
That is the giveaway: RCP 8.5 is science fiction, the latest emission estimates of the International Energy Agency for 2050 are half the values of RCP 8.5.
And we all know since 2007 that summer sea ice extent is not a factor for polar bear population numbers.
esali: Could you imagine why the arctic summer warming is much less than the winter warming? Some thoughts about melting energy??
I think it has to do with Stefan-Boltzmann where energy is proportional to T^4
https://klimaathype.wordpress.com/2018/03/24/localised-instant-climate-sensitivity-for-2xco2/
No, it s due to the Sun shining on ice. At the winter, the T^⁴ kind of matters, but at the summer, it is ice melting keeping T at around 273K. If there were no ice around, the temperature would soar and drop in September like a rock.
What comes to winter, I’m not sure what I would like more: higher average temp causing more energy loss, or lower T over a sea ice cover causing buildup of energy in the sea. Maybe I go with it is prettyffing same to me.
When water freezes, it releases energy as well.
The heat of fusion of the melting ice (333kJ/kg) is consuming the energy of the sun during the summer not letting the temperature to rise much above zero.
A gif with 4 years of SST data, nicely showing 2 hotspots near Svalbard:

Fig 3 tells it all. There is no extra warming during the summer months when the temperature is above zero. It cannot be very alarming to the environment if the winter temperature is minus 15C instead of minus 20C.
esalil
I’m afraid you don’t understand that the ‘extra warming during the summer months’ is not the problem.
The problem is the lack of cooling during the winter months.
Generating station-local anomalies for the Arctic regions (thus for all stations above 60N) out of the GHCN daily data set
ftp://ftp.ncdc.noaa.gov/pub/data/ghcn/daily/
gives you some info about this lack.
Here is the top 20 of all 2019 anomalies with at least 10 °C above the mean of 1981-2010 for the Arctic (there are 141):
US AK CHIMNEY_LAKE_ALASKA________ 2019 3 19.72 (°C)
US AK PAMICHTUK_LAKE_ALASKA_____ 2019 3 18.99
CA NT YOHIN___________________________ 2019 3 18.04
US AK CHIMNEY_LAKE_ALASKA________ 2019 2 17.02
US AK UMIAT_AIRFIELD_ALASKA_______ 2019 3 16.71
US AK PAMICHTUK_LAKE_ALASKA_____ 2019 2 16.55
US AK BOX_RIVER_ALASKA_____________ 2019 3 16.26
CA NT INUVIK_CLIMATE________________ 2019 3 15.95
US AK CHIMNEY_LAKE_ALASKA________ 2019 1 14.64
US AK WIGAND_ALASKA________________ 2019 3 14.62
US AK Prudhoe_Bay_____________________ 2019 3 14.53
US AK DEADHORSE_AP_________________ 2019 3 14.40
CA YT SHINGLE_POINT_A______________ 2019 3 14.36
CA NT INUVIK_A________________________ 2019 3 14.35
US AK LITTLE_BLACK_ALASKA_________ 2019 3 14.05
CA NT NORMAN_WELLS_CLIMATE_____ 2019 3 13.88
US AK DEERING_AP_____________________ 2019 3 13.82
US AK Kantishna________________________ 2019 3 13.75
US AK Sagwon___________________________ 2019 2 13.74
CA NT TRAIL_VALLEY___________________ 2019 3 13.74
With the exception of a few Canadian stations, this top 20 is all from Alaska. Russian stations appear some lines later…
Do you really think it’s all harmless?
Do you really think it’s all harmless?
It’s beneficial.
Please, show the real temperatures, not the anomalies. Anomalies are harmless, real ones might not be.
esalil
Sorry, I insist: lack of cooling is, in cold regions, at least as harmful as is excess of warmth in warm regions.
Outside of models, there is no evidence of excess warming anywhere.
I don’t see anything in that report that mentions a previously unknown COLD deep current running along the shores of Iceland. That mixes the waters, doesn’t it? That current was found a few years back.
Are those subsurface volcanoes on or near the Gakkel Ridge formation?
So many questions, so few definitive answers from the “experts”…..
Sara December 7, 2019 at 3:34 am
I don’t see anything in that report that mentions a previously unknown COLD deep current running along the shores of Iceland. That mixes the waters, doesn’t it? That current was found a few years back.
Are those subsurface volcanoes on or near the Gakkel Ridge formation?
– Sara, there’s a ring of subsurface volcanoes called “the ring of fire”
https://www.google.com/search?q=earth%27s+ring+of+fire&oq=Earth%27s+ring+&aqs=chrome.
What countries are part of the Ring of Fire?
Countries at highest risk of being struck by an earthquake in the Ring of Fire are in the US west coast, Chile, Japan and Pacific islands like the Solomon Islands.
Other countries along the fault line include Mexico, Antarctica, Russia, Papa New Guinea, Indonesia, Canada, Peru, Taiwan, Philippines, and Guatemala. Aug 29, 2018
https://www.express.co.uk › world
Ring of Fire map: Countries in the Ring of Fire – why so many …
Johann Wundersamer December 18, 2019 at 5:49 am
The Arctic has its own “ring of fire”
Iceland to beging with, probably sitting on a mantle plume.
Further north Jan Mayen, an active volcano.
From there towards Svalbard and beyond lots of activity.
See eg https://www.ngu.no/upload/Aktuelt/CircumArtic/5_SMS.pdf
page 211 has a nice overview map.
https://wattsupwiththat.com/2013/08/02/hot-times-near-svalbard-volcanic-range-discovered/
Was this “paper” actually generated by an experimental computer program ?
“Greater warming likely in the Arctic and Antarctic with 2°C global warming.”
He is stating the long time mostly acknowledge, that change in “global” temperature will show the largest anomaly at the poles and less on the equator.
These theoretic predictions appears to be almost as good a guesswork. wouldn’t it be better to just extrapolate past multi-decades?
Sometimes knowledge of the past can come from unexpected sources:
Back in the 1970’s I had an afternoon coffee with Danish ornithologist Finn Salomonsen in his garden north of Copenhagen. He told me how he in Greenland had determined that sea eagles could be over 120 years old. An Eskimo had observed an eagle with a limb wing. It was clear there was something wrong with the one wing, because of the way this eagle flew. The Eskimo further told that his father before him, had followed this limb eagle his whole life, and was told about the eagle from his father again. It so happened that Finn Salomonsen had a chance to see the eagle for himself, he told me, which suggest that the story was not just an Eskimo spin.
Reference to Finn Salomonsen (1909 to 1983):
https://en.wikipedia.org/wiki/Finn_Salomonsen
A warming would make Siberia, Alaska, and Canada pleasant places to live. Poor Eskimos and Chukchi!
Not poor Eskimos and Chukchi, they live mainly of seal, which is also available in much warmer waters. I happened to see a few seals by Pier 39 last time I was in San Francisco 🙂 Oh sorry, they were sea lions, but in Denmark way south at latitude 56 we have loads of them.
If it gets serious warmer on Greenland, the Eskimos may take op farming on a grand scale, following the footsteps of Erik The Red (the first Climate Scientist on Greenland year 985).
Climate modelers often state that CMIP5 climate models weren’t designed to simulate regional climate. Then they turn around and produce trash like this.
And they wonder why many people think climate science is a bad joke.
Regards,
Bob
Thanks for that scientific critique and rebuttal. Very convincing. I perused the article and there was more to it than just models – which a recent Berkeley study has verified are spot on.
Imagine if your comment was made against one of your own long and rambling posts here.
you mean the models that were accurate 50 years ago when the news was hyping a coming ice age?
So happy to know that a recent Berkeley study has confirmed that the models are spot on. Your rebuttal and critique are very, very sciency, John Hutton.
Imagine.
John Hutton, here is an old muslim proverb for you: he who spits toward heaven himself besmears.
Trolls really get their panties in a wad when people dare to disagree with them.
Climate science is the only place where a scientist can be wrong everywhere, but still claim to be right on average.
Anything using GISS data is not based on facts, end of.
The low temperature in the stratosphere above the polar circle does not determine the strength of the polar vortex. The influx and distribution of ozone in high latitudes is decisive. The animation below shows that the influx of ozone to to Bering Sea led to the division of the polar vortex in the lower stratosphere over the Bering Sea.

https://earth.nullschool.net/#2019/12/07/0600Z/wind/isobaric/70hPa/orthographic=-10.87,94.02,296
This is the topic of this article, which is excellent.
No, Global Warming is Not Causing More Frequent Arctic Outbreaks
Posted on 10 Nov 2019 by Chris Martz
http://bit.ly/2KaQoQN
In this article, (below) the Sun is the culprit for the change in the jet stream.
During a solar minimum, the jet stream’s usual tight Zonal Flow (a west–east direction) loses energy and reverts to more of a loose Meridional Flow (a north-south direction) — this is exaggerated further during a Grand Solar Minimum, like the one we’re entering now, and explains why regions become unseasonably hot or cold and others unusually dry or rainy:
Cold air moves south, Warm air moves north
“Meridional Jet Stream” Upsets Europe’s Apple –and Pear– Cart
http://bit.ly/2ZVxp2B
August 8, 2019
…Temp change between 1780 (a year of normal solar activity) and 1680 (a year within the depths of the Maunder Minimum) — NASA
Earth’s climate is cyclic, never linear — driven by the sun.
And history is repeating, our star is again shutting down (relatively).
Prepare for the cold.
Grand Solar Minimum + Pole Shift
___
Wouldn’t it be great if scientists just studied Earth’s climate and looked for real causes of our weather instead of insisting on tossing CO2 and evil Mankind into every event? Imagine how much greater our knowledge of Earth’s climate systems would be without the effort to control the world being the primary goal instead of knowledge and comprehension of Earth.
So:
1. It is NOT global. The Arctic is warming faster, so the theory is wrong, wrong, wrong.
2. It’s worse than we thought. The theory is wrong, wrong, wrong.
3. We are going to keep lying and browbeating until you believe what is wrong, wrong, wrong.
Theory has predicted faster warming at the Arctic, slower warming at the Equator for at least 40 years now.
Riggald Eux December 8, 2019 at 5:46 pm
Assuming you refer to the GHE theory, that same theory predicted the Lunar average surface temperature as ~270K. Actual measured surface temperature ~197K.
Adding an atmosphere to the moon would prevent some 50% of solar radiation from reaching the surface. (Much higher albedo, absorption in the stratosphere etc.etc.)
Yet the theory claims that the surface temperatures would go to ~300K on our moon due to a GHE.
(~30K above Teff of ~270K)
Riggald Eux December 8, 2019 at 5:46 pm
Additionally:
https://wattsupwiththat.com/2013/08/02/hot-times-near-svalbard-volcanic-range-discovered/
These underwater volcanoes were “first glimpsed” in 2008. How could any theory have predicted their warming effect some 40 years ago??
The temperature north of 80° is very stable during the melt season. It can vary wildly in the fall, winter, and spring. In terms of the ecology, I don’t think it makes much difference if it is -20 or -40. In either case, things are frozen solid.
Also there are very, very few direct temperature measurements north of 80 in the winter. The numbers published are all modeled, so as usual, if the models are wrong so are the published numbers. If they are claiming accuracy to tenths of a degree and stating it as fact it’s basically a lie. (please Steven Mosher refute this)
The DMI at least publishes where they get their numbers.. from the ECMWF which so far has fallen well behind in its ability to forecast weather just two to three weeks out. http://ocean.dmi.dk/arctic/meant80n.uk.php
That is the bit which always puzzles me when they talk about temperature anomalies and variation. They rarely tell us what actual temperatures they are dealing with and it was always my understanding that the bulk of the Arctic is below zero,, in which case it can only be melting a bit round the edges.
True. Folks like to talk in terms of anomalies.
rbabcock above supplys the link for the temperature above 80°. It’s in actual degrees.
The link has temperatures back to the 1950s. Every year the temperature during the melt season sticks very close to the long term average. It takes a lot of energy to melt ice and that regulates the temperature.
The other thing is that the ice starts melting from the bottom up, using energy from the ocean. The thickness of the ice depends on the air temperature. My experience is that the ice can go from 10ish feet thick to 3 feet thick between February and April even though the air temperature stays well below freezing.
The Arctic hit unusually high peak temperatures this summer.
Alaska saw its hottest month ever recorded in July. Anchorage reached 32.2º C (90º F)
Alert, the permanent military base only 900 kilometres from the North Pole, reached the record breaking temperature of 21º C (70º F).
Northern Sweden, on the border of the Arctic Circle, hit 34.8°C (94.6° F)
Norway’s Polar Arctic Circle’s town of Saltdal reached 34.6º C (94.2° F)
In Greenland the melt season started earlier than usual.
September was exceptionally warm in both Alaska and Norway.
There will always be some record hot and cold temperatures every year. In spite of that, the temperature north of 80°N didn’t budge much from the long term average. link
Anchorage is not in the Arctic.
MarkW December 9, 2019 at 7:48 am
Anchorage is not in the Arctic.
________________________
MarkW, to your convenience:
The Arctic hit unusually high peak temperatures this summer –
Alaska saw its hottest month ever recorded in July. Anchorage reached 32.2º C (90º F): Alaska is not in the Arctic.
Alert, the permanent military base only 900 kilometres from the North Pole, reached the record breaking temperature of 21º C (70º F): Alert is in the Arctic.
Northern Sweden, on the border of the Arctic Circle, hit 34.8°C (94.6° F): Northern Sweden is not in the Arctic.
Norway’s Polar Arctic Circle’s town of Saltdal reached 34.6º C (94.2° F): Norway’s Polar Arctic Circle’s town of Saltdal borders the Arctic circle.
In Greenland the melt season started earlier than usual: Greenland is not in the Arctic.
September was exceptionally warm in both Alaska and Norway: September is a Month. “it” takes place in the Arctic and in non-Arctic topia too.
inaccesability and data scare for antarctic?
wtf?
theyve got more people and instruments there than you could poke a stick at…
what an utter load of crap.
Graphing UAH NoPol this century is quite interesting.
Even the blindest of AGW stall warts might notice something. 😉
fred250
“Graphing UAH NoPol this century is quite interesting.”
Yes! Under the condition of course that one is able to do that little job right, huh?
Here is how you should have done it:
https://drive.google.com/file/d/10QSs8JHhKV5um_a0B8f5wSHQ6hxms0M5/view
Who should be surprised that a blind “skeptic” still can manage to fall for such a stupid trick in 2019?
Linear estimates for UAH6.0 NoPol, in °C / decade, computed by any spreadsheet calculator
– 1979-2019: 0.25 ± 0.002
– 2000-2019: 0.25 ± 0.006
Alas, alas: not every line one draws over a curve will represent its trend!
LOL, I said this century.
So sorry you cannot comprehend
Your graph also show no warming this century until the 2015 El Nino.
Thanks for the corroboration 😉
Obviously that one event is the only cause of warming this century, wouldn’t you agree 😉
Note also the cooling since that event. Near back down to the zero trend line.
Also, thanks for showing everyone that 1980, 1981 had a couple of months quite a bit warmer than now.
You are doing a bang-up job ! 🙂
Also, thanks for drawing attention to the negative temperature trend from 1980 -1995,
Also obviously caused by atmospheric CO2 😉
Let me add a bit to the article…
“We do not like or accept that change is normal. Change scares us. Because we do not understand why things are always changing, it must be because of people and their evil ways. The arctic has low biological diversity because its so cold, and if it warms it will suddenly support additional life forms – this scares us. Change is always bad because…we have to change and we do not like change. 97% of all real scientists hate change – we know this because we asked some of our friends and then made up a number.”
I wonder if it *ever* occurs to these people that a warmer arctic would be NORMAL, and that we have lived through an ABNORMALLY cold arctic period over the last few thousand years or so? I know that if I lived in Canada or Alaska, I would be praying for more warmth.
The indigenous people would have been fine before we forced them to start living in fixed communities using modern building techniques. They would have just moved their camp a few hundred feet inland to deal with erosion, or moved up and down the coast if food got scarce. Now they have permanent towns and yeah…change is a problem. So adapt.
It is our modern fixation that things should not change that is the problem. Change is natural.
Fortunately, Dr. Lucy Van Pelt is on the case, and has determined that what Alarmist Believers suffer from is called Metathesiophobia. That’ll be 10 cents, please. Hey, inflation. What’re you gonna do?
Are Arctic campsites built on the waters edge because onshore breezes in summertime make living in a environment loaded with mosquitoes, black flies, midges possible?
People who live in a warming arctic
“in Alaska, entire villages may be relocated because the land upon which they’re built is no long trustworthy.”
“In the coal-mining town of Vorkuta, about 40 percent of buildings have become deformed from changes in the ground. In Norilsk, the largest city built on permafrost, about 60 percent of buildings have been damaged by permafrost thaw, and 10 percent of the houses in the city have been abandoned.”
https://www.citylab.com/environment/2018/05/the-race-to-save-arctic-cities-as-permafrost-melts/559307/
“Slow-motion wrecks: how thawing permafrost is destroying Arctic cities”
https://www.theguardian.com/cities/2016/oct/14/thawing-permafrost-destroying-arctic-cities-norilsk-russia
“Permafrost Melt Could Destroy a Third of All Arctic Infrastructure, Affecting as Many as 4 Million People”
https://earther.gizmodo.com/permafrost-melt-could-destroy-a-third-of-all-arctic-inf-1831011572
“Foundations across Siberian cities can bear up to 46 percent less load in 2010 than in the 1960s”
“Twentieth-century engineers calculated how much weight foundations could support based on ground temperatures — but those temps have risen by up to 3.6 degrees across Russian permafrost zones in the past three decades. “Those designs were not accounting for such a fast pace of climate change,”
https://www.discovermagazine.com/the-sciences/artic-meltdown-were-already-feeling-the-consequences-of-thawing-permafrost
When you build warm buildings on perma-frost, the perma-frost melts. Not something that surprises those who are actually familiar with perma-frost. And also nothing to do with mythical warming.
During the previous interglacial temperatures were 5-8 degrees higher in Greenland for 10,000 years and 5-10 degrees warmer in Siberia for as long.
Nothing terrible happened. The Greenland icecap did shrink a bit and larch forest spread north all the way to the coast in Siberia, but there was no noticeable methane increase.
Incidentally something like 30 million square kilometers of permafrost melted at the end of the last glaciation (at the glacial maximum permafrost reached south to the Mediterranean, the Black Sea and St Louis). Again nothing much happened
I have often wondered about that. Glaciers and permafrost spread way south during the last ice age. Did the world end when all this melted to where it is now? Why would some additional melting cause catastrophe?
Good question.
Slight problem during that melting is the associated sea level rise of ~125 meter.
People living on Doggerland had to relocate.
http://www.13things.co.uk/p/9.html
Not that the few centimeters additional rise we can expect will make a difference 😉
It caused catastrophe to the people of Doggerland. Now known as “the North Sea”.
Riggald Eux December 8, 2019 at 6:19 pm
Correct. So apparently sea level can rise some 125 m without any CO2 from human activity. Amazing.
Anthony had an article here on WUWT a few years back about a study that found that enhanced microbe activity in the warmed ground ate all the methane before it could reach the surface.
The average year round temperature of the South Pole in around -50 deg C. Don’t know that anything at the South Pole cares whether the temperature is -50 or -48 deg C and it seems meaningless to average South Pole temperatures with temperatures over the inhabitable earth.
Once again a snippet of scientific fact is twisted to support climate alarm. Christopher Scotese, paleoclimatologist shows the history of earth warming and cooling over the ages, from hot house to ice house. When earth warms, equatorial regions stay the same, while the polar temps rise, making them less frigid, reducing the latitudinal gradient.
Scotese diagram is:
Scotese paper is : http://www.academia.edu/12082909/Some_thoughts_on_Global_Climate_Change_The_Transition_from_Icehouse_to_Hothouse
My synopsis: https://rclutz.wordpress.com/2017/02/02/fact-future-climate-will-be-flatter-not-hotter/
The point is a warmer world sheds the energy at the poles, the meridonal transport warming high latitudes, not because of greenhouse gas effect. And BTW, we are emerging from severe ice house to ice house climate, albeit slowly and far from a hot house. Stay the course.
Your article is tremendous, Ron. Really enjoyed it, since it fires a bullet through the heart of catastrophism. By the way, it looks like Texas is in a good spot on this old earth whether we cool OR warm from here.
Ron: “equatorial regions stay the same”
As you can find in the following article the tropics even have been cooler during Hothouse periods than they are today, fossils tell. See figure 2. https://www.researchgate.net/publication/249550697_The_Maastrichtian_Late_Cretaceous_climate_in_the_Northern_Hemisphere
The explanation is the descending warm water at 30N (and/or 30S) during Hothouse periods that were warming the poles and cooling (a bit) the tropics. More info: https://wattsupwiththat.com/2018/06/15/how-the-earth-became-a-hothouse-by-h2o/
Wim, thanks for the clarification. Your linked article from last year is very informative, as well as the discussion thread. As you said there, our present ice house climate regime has starkly different circulation patterns from a warm or hot house era (which are also not to be feared for that reason.)
Step #1 when using the GISS mapping page: disable the ridiculous 1200km smoothing
Surely by now there’s enough evidence proving that CO2 is a minor player in climate (except for the greening). Why the continued discussion? Hasn’t Dr. Henrik Svensmark solved the climate change mystery? If not, please you experts, attempt to prove him wrong. CO2 is so last year…boring. The IPCC, skeptic science blog, Al Gore and the democrat national committee disagree with his hypothesis but it sounds pretty good to this layman.
copy/
• The coolings and warmings of around 2°C that have occurred repeatedly over the past 10,000 years, as the Sun’s activity and the cosmic ray influx have varied.
• The much larger variations of up to 10°C occurring as the Sun and Earth travel through the Galaxy visiting regions with varying numbers of exploding stars.
Dr. Henrik Svensmark, Danish National Space Institute, in the Technical University of Denmark (DTU).
why can’t human CO2 be a new, additional climate driver on top of those natural cycles?
It might be, however since the temperatures still haven’t exited the ranges that are normal for those cycles, there’s no way to tell for certain.
Hasn’t Dr. Henrik Svensmark solved the climate change mystery? If not, please you experts, attempt to prove him wrong.
It’s not hard.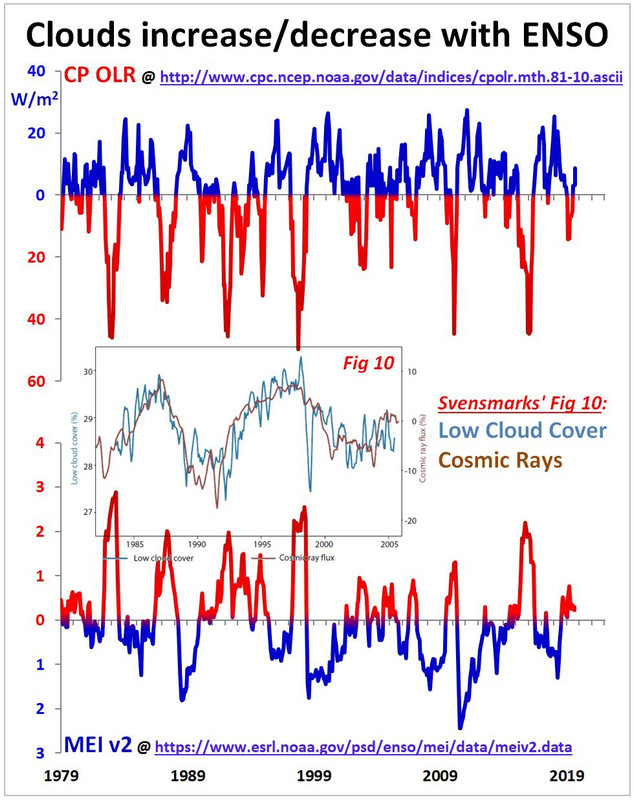
Central Pacific Outgoing Longwave Radiation (CP OLR) has been mostly positive as cosmic rays increased into the minimum, indicating fewer clouds are being produced over the tropics since 2016.
The now more open tropical skies let in more sunlight, warming the tropics, increasing MEI (via Nino34). Each time MEI increases, more clouds are produced, some of which eventually accumulate over the NH through the solar minimum when the NH winter atmosphere is colder with decreasing solar activity.
CRs inversely correlate with TSI. It is the lower TSI solar minimum energy that is responsible for less tropical evaporation and fewer tropical clouds, which leads to higher insolation warming, ie increasing or high Nino34/MEI and higher SST overall, which has happened since early 2018, while Cosmic Rays have increased. High cosmic rays didn’t stop the ocean from warming.
However, low TSI has cooled and expanded the arctic polar ‘vortex’ since 2016, not cosmic rays.
Cosmic rays ‘clouds’ are fantastic – ie fantasy, the climate theory for dummies.
Bob Weber – Henrik Svensmark has successfully tested end-to-end the mechanism of his GCR-cloud theory. But because it operates on the ocean, the end effect on Earth’s temperature is slow. No-one is saying that GCRs are the only factor which affects climate.
All I ever see about it is a whole lot of hand-waving, and lab experiments don’t count.
The real-world tests fail, as CRs were very high since 2018 while SST has risen.
Does Svensmark think NH winter is caused by clouds?
Does he think inland lakes freeze because of low cloud cover?
In 2013/14 CRs were lower but the NH still had cold waves/polar vortex. Why?
Low TSI.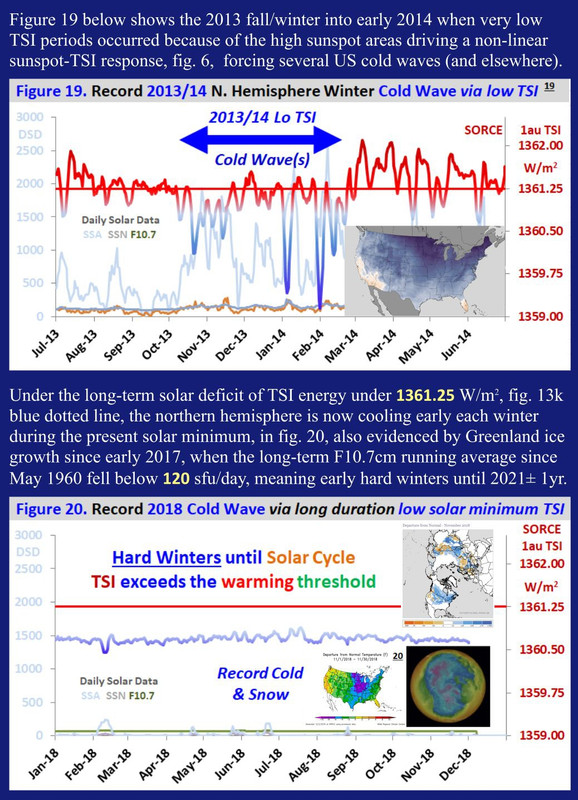
If Svensmark and his theory are so good why didn’t he predict (from high CRs) as I did a year ago in my 2018 fall AGU poster Fig 19-20, “early hard winters” (from low TSI)?
I’m right, he isn’t.
Bob Weber
I know: We often disagree, imho more because of mutual misunderstandings than because of real disagreements.
Thanks for this excellent reply to Dennis G Sandberg. You hit the nail on the head.
Rgds
J.-P. D.
Bob Weber, the EE Canadian? The same? Reviewing that Bob Weber’s other postings indicate you’re in the “it’s all about solar, not CO2 camp and if so it seems you should be more in agreement with Svensmark”. No one argues that La Nina/ El Nino doesn’t cause temperature change. My interpretation of Svensmark is that he is saying that the solar wind and associated magnetic effects drive ocean oscillations. Like I indicated above, I’m a layman, Did I misunderstand?
You were doing pretty good until you implied that you’re smarter than Dr. Svensmark, that makes your comments suspect. I struggle with your basing your opinions on “…since early 2018, while Cosmic Rays have increased, High cosmic rays didn’t stop the ocean from warming.” Any chance you might have overlooked some other variables?