Guest yawn by David Middleton
When I first read this, I was all set to ridicule it mercilessly… until I noticed the timeline…
INHERIT THE WATER —
It keeps going: 1 meter sea-level rise by 2300 is now inevitable
Analyzing a longer timeline, even if we ceased emissions in 2030.SCOTT K. JOHNSON – 11/7/2019
Climate change is often discussed in reference to where things will be in 2100, but the story obviously doesn’t end that year. Sea-level rise in particular has an impressive amount of inertia, and a very long time will pass before it has played out fully. What will our emissions have set in motion on longer time scales?
Projecting sea-level rise in the year 2100 is difficult enough, partly because the behavior of the world’s ice sheets and glaciers is varied and complex, and partly because it depends in a big way on how much greenhouse gasses we continue emitting. Take future emissions off the table, though, and it’s possible to think about what happens out to 2300.
The future is real
That’s what a team led by Alexander Nauels did in an analysis based on a combination of our past emissions and the current Paris Agreement pledges for emissions through 2030. Nauels and his colleagues used a simple mathematical model calibrated against the results published in the most recent IPCC report. Rather than running a massive global simulation on a supercomputer, they calculated the relationship between emissions and sea-level rise in previous simulations—which projected out to the year 2300. This also allowed them to quickly process multiple variations of their question.
Considering only emissions through 2030 creates a hypothetical scenario in which warming peaks around 1.5 °C above preindustrial temperatures and starts dropping before the end of this century. This results in about 43cm (17 inches) of sea level rise by 2100, and 105cm (41 inches) by 2300. That’s what greenhouse gas emissions through 2030 commit us to, even if we emitted nothing after that.
[…]
SCOTT K. JOHNSON
ARS Technica
Scott is an educator and recovering hydrogeologist who has been covering the geosciences for Ars since 2011.
Could sea level rise by about 1 meter by 2300? Sure. At the current rate of about 3.2 mm/yr, it’s rising 320 mm per century… 960 mm from 2001-2300 is almost 1 meter. Sea level has been more than 1 meter higher than today for most of the past 3,000 years.

That said, forecasts of sea level rise that far out in the future are pointless. According to the “analysis” of the “team led by Alexander Nauels,” even if we halt all emissions by 2030, sea level will rise 43 cm (17 inches) by 2100. In their paper, Mengel et al. assert a 43 cm sea level rise (SLR) by 2100 under RCP2.6. That’s 4.3 mm/yr. We’re already nearly 20 years into this time span and SLR is stuck on 3.0 mm/yr over the entire satellite record.

I broke out the past five years because the World Meteorological Organization recently asserted that it had accelerated to 5 mm/yr over the past 5 years, a claim that is utter horst schist.
For sea level to rise by 43 cm (430 mm) over the 21st century, it would have to average 4.6 mm/yr over the next 80 years. If it started accelerating now, it would have to accelerate to 4 mm/yr by 2034, 5 mm/yr by 2065 and 6 mm/yr by 2096… But it would actually have to start accelerating. No… Neither Church & White’s, nor Nerem’s recent claims of SLR acceleration alter what the satellite data clearly demonstrate: The R² of the linear trend over the entire satellite record is 0.95… About as close to unity as nature can get.
References
Brock, J.C., M. Palaseanu-Lovejoy, C.W. Wright, & A. Nayegandhi. (2008). “Patch-reef morphology as a proxy for Holocene sea-level variability, Northern Florida Keys, USA”. Coral Reefs. 27. 555-568. 10.1007/s00338-008-0370-y.
Mengel, M., Nauels, A., Rogelj, J. et al. Committed sea-level rise under the Paris Agreement and the legacy of delayed mitigation action. Nat Commun 9, 601 (2018) doi:10.1038/s41467-018-02985-8
alankwelch November 12, 2019 at 3:17 am
Other differences are that whereas the quadratic curve cannot be extended much further backwards in time, being parabolic, it has been readily extended forward with alarmist consequences.
Here’s a chart from Skeptical Science attributed to Dr. Nerem.
Here’s a graph from 2011 that makes the point that extrapolation isn’t a good idea. At that time the acceleration was negative -0.06mm/year² LINK (pdf) (scroll to bottom)
The fig below shows the velocity and accelerations calculated using the NASA raw data. It shows the values derived using the first 9 years of results up to using 26 years of results. As you pointed out around 2012 the acceleration went negative. This illustrates the danger of using polynomial curve fitting. Once out side the range of data the extrapolated results are solely governed by the highest term, in this case the square term.
https://drive.google.com/file/d/1JZg4w6dFQSEnZHhaTDVAzKKw3cwsIjRK/view?usp=sharing
steve case
“… extrapolation isn’t a good idea.”
You may be right.
But now we are in 2019, I had a quick look at my little sea level ods file, and so do look the monthly consecutive altimetry trends for 1993-2003 till 1993-2019:
https://drive.google.com/file/d/1C5U93A23X7ARqbQ1zkGr9OjqxYk-vy1z/view
Do you see the drop from 2005 till 2011 in the NASA trend series? (It is a bit less pronounced in the NOAA data.)
The spreadsheet calculator gives for that NASA period -0.19 ± 0.02 mm/year²; for 2012-2019, +0.22 ± 0.02 mm/year².
Do you think the data was, after the drop, subsequently adjusted to show something quite different?
Hmmmh.
Apos for a typo: the trends of trends should be -0.019 ± 0.002 resp. +0.022 ± 0.002 mm/year².
The measurements aren’t that accurate.
Bindidon November 12, 2019 at 2:49 pm
If you’re asking do the keepers of sea level data via satellites rewrite historical data? The answer is yes they do. Here’s a graph that visualizes those changes:
It’s coming up on two years ago that Colorado University’s Sea Level Research Group completely re-wrote the satellite record, time line and data. They bumped up the data from 1992 to 1998 which resulted in an acceleration of 0.08mm/year² that they then extrapolated out to 2100 projecting a 0.65 meter increase.
Yes there was a drop in sea level 2005-2011. The water went somewhere. Polar ice caps? The flooding in Australia? Where ever it was, it was released and the subsequent rate of sea level rise 2012-2019 reflected that release, and not an artifact of adjustments. Do you think that uptick in the rate is going to continue for the next 80 years as CU claims? I don’t know, but if I had to put money on it, I’d say it wouldn’t continue.
steve case
Thanks for the info, I have Colorado SL on the HD but don’t use it.
What you see on my graphs is NASA and NOAA data.
Now, what concerns
“Do you think that uptick in the rate is going to continue for the next 80 years as CU claims?”
No idea. As I only observe, I have nothing to do with predictions. For that you at least must be able to interpret what you observe. I am not.
Look behind the article to the comments, which are most scary is all the mini-Greta children-of-the-corn wingeing about it! And we have the Warminista authors’ linear projecting a trend 300 years into the future. By 2300 we may be well heading into the next ice age…
The Earth has experienced five major Ice Ages: the first in the Upper Archaean, the second in the Lower Proterozoic (300 my from 2.4 to 2.1 Ga), the third in the Upper Proterozoic (72 my, from 715 to 643 my) and the fourth in the Permo-Carboniferous (100 my. from 360 to 260 my.) The fifth Ice Age is the current Quaternary Period starting some 2.6 million years ago.
The current Ice Age is characterized by lengthy periods of glaciation punctuated by much shorter, warm inter-glacial periods such as the one that Earth is currently experiencing. The last four glaciations have each lasted roughly 100,000 years and the last four interglacials have each lasted approximately 10,000 years. The current interglacial started some 10,000 years ago.
“The Earth has experienced five major
Ice Agesglaciations.”Fixed!
Yes, I agree, anything about sea-level rise is a massive yawn. Even more so than sea-ice.
beng135 – at 8:04 am
Yes, I agree, anything about sea-level rise is a massive yawn. Even more so than sea-ice.
Sea level rise is probably the biggest scare they have.
The end of the world “inevitable” – Eventually…
No one gets out of here alive.
-Jim Morrison, before he got out of here.
yep we are all going to die.
Seems a bit limited and presumptuous.
Satellite altimetry measurements of sea-level are less reliable than coastal tide gauge measurements, and satellite altimetry can only measure sea-level far from shore. It cannot measure sea-level near the coast, where it matters. Only tide gauges can do that.
Tide gauges are measuring even less sea-level rise than most of the satellite altimeters. According to tide gauge measurements, sea-level rise averages only about 1.5 mm/year, with no detectable, sustained acceleration in over nine decades.
Here’re a few locations with very long, high quality measurement records, and little distortion from vertical land motion:
1. Honolulu, Oahu, Hawaii:
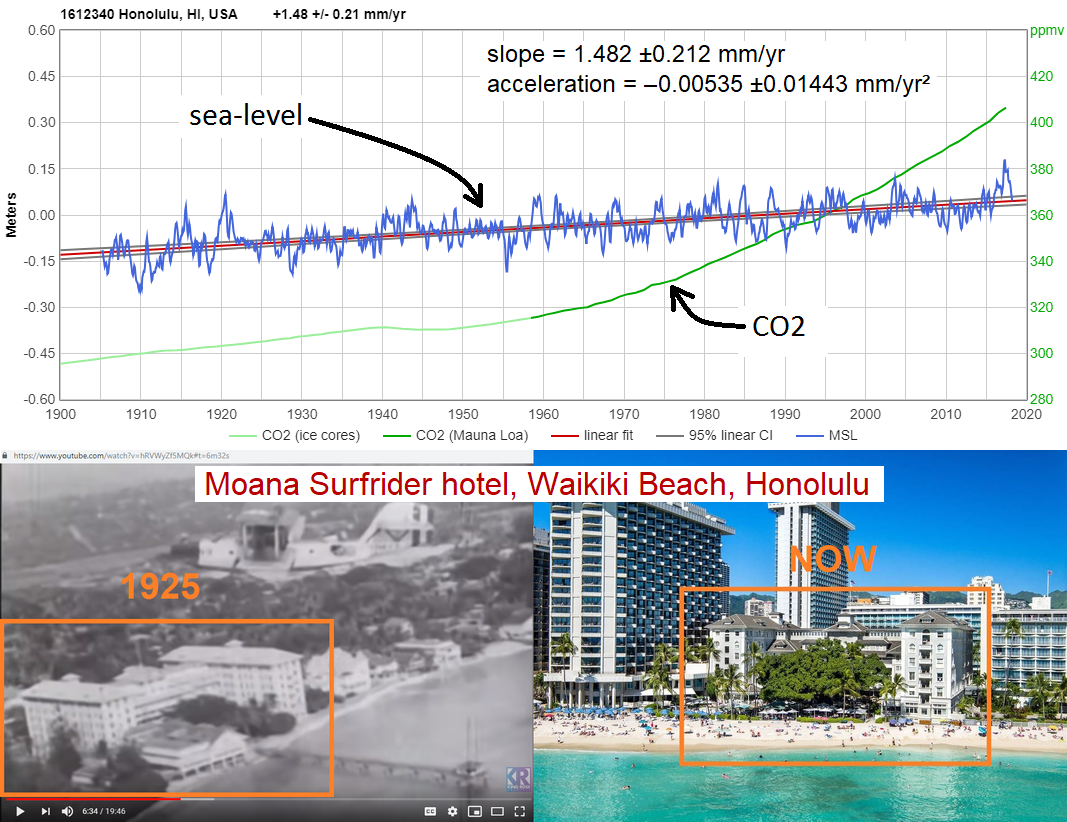
Oahu is an old, tectonically-stable island, which experiences near-zero vertical land motion. The volcanoes on Oahu are believed to have been inactive for well over a million years. Like all the Hawaiian islands, it is moving horizontally, to the NW, about three inches per year. But not vertically.
Peltier’s ICE-6G(VM5a) estimate is that Honolulu is experiencing just 0.10 mm/yr uplift. Ref:
http://www.atmosp.physics.utoronto.ca/~peltier/datasets/Ice6G_C_VM5a_O512/drsl.PSMSL.ICE6G_C_VM5a_O512.txt
SONEL’s analysis indicates that Honolulu is subsiding (rather than rising), but just 0.23 ±0.18 mm/yr:
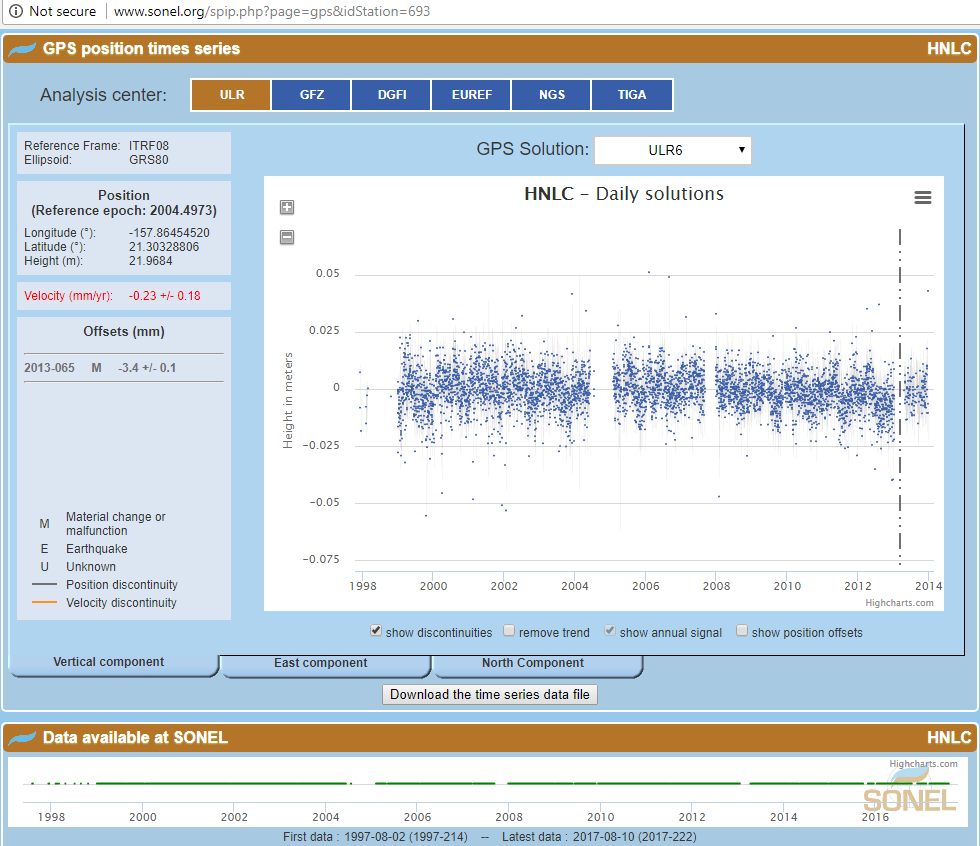
http://www.sonel.org/spip.php?page=gps&idStation=693
Screenshot:
The CORS plot is flat as a pancake:
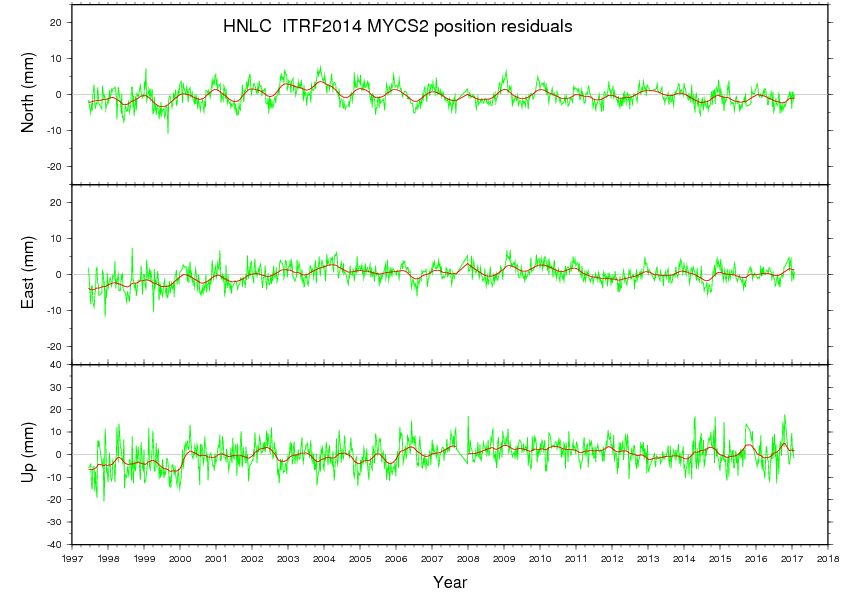
ftp://www.ngs.noaa.gov/cors/Plots/Longterm/hnlc_14.long.png
Also saved here:
All those numbers are tiny: +0.1 and -0.23 are opposite sign but not far apart. In other words, the models and measurements agree that Oahu is experiences little or no vertical land motion.
Oahu also gets only small tides, and its mid-Pacific location is near the pivot point of the east-west Pacific “teeter-totter,” so it is little affected by ENSO “slosh.”
The only thing atypical about Honolulu’s sea-level measurement record is its very high quality. The trend there (about +1½ mm/year = 6 inches/century) is perfectly typical.
2. Maassluis, Netherlands.
The Dutch are very diligent at measuring sea-level. Maassluis has a 171 year continuous measurement record, without a single missing month!
Like Honolulu, Maassluis has little vertical land motion. (Peltier’s estimate is that it experiences 0.13 mm/yr subsidence.) Its 2.0 mm/yr sea-level trend is onlt about 2 inches/century faster than Honolulu:
3. Cuxhaven, Germany.
Peltier estimates that Cuxhaven gets 0.72 mm/year uplift, but SONEL isn’t measuring any. The sea-level trend there is just 1.9 mm/year:
http://sealevel.info/MSL_graph.php?id=140-012&c_date=1900/1-2019/12&boxcar=1&boxwidth=5
1 to 2 mm/year sea-level rise is truly negligible. It is only about four to eight inches per century. It is so slow that in many places it is dwarfed by common coastal processes, like erosion, sedimentation, and vertical land motion.
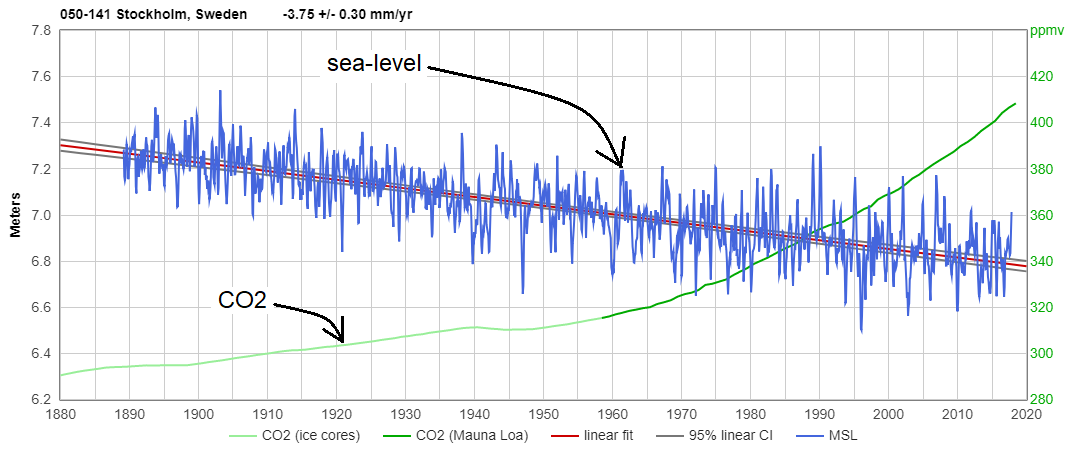
Greta Thunberg’s hometown of Stockholm is one such place. They would benefit from an increase in the minuscule global sea-level trend, because it would reduce their dredging expenses. Unfortunately for them, the sea-level trend is not accelerating:
Without a doubt, the tide gauge data are what matters locally. The advantage of the satellite data is that they don’t require isostatic adjustment.
You’d think so, wouldn’t you? And yet the Aviso folks add 0.3 mm/yr isostatic adjustment to all their reported sea-level trends, from satellite altimetry. That’s the estimate they use for the amount by which sea-level would be falling due to ongoing sinking & broadening of ocean basins, due to meltwater load from the last deglaciation, were there no other factors affecting sea-level.
AVISO used to make adding the isostatic adjustment optional in their graphs, but they removed that feature. I wrote to them and asked them to restore the feature. They politely refused.
Note: As you can see (above), Aviso told me, “We do include the corresponding uncertainties in our total uncertainty assessment of 0.5 mm/yr (PGR participates by 0.05mm/yr at 90% CL).”
But to the best of my knowledge Prof. Peltier and his colleagues have not published uncertainty estimates for their 0.3 mm/yr ocean basin GIA estimate, nor for any of their other GIA / PGR figures. Tamisiea, 2011 gives a much broader range: 0.15 to 0.5 mm/year.
I wonder whether Aviso just assumed they could approximate Peltier’s uncertainty by using half of his last (only!) significant digit?
The crazy thing about the GIA adjustment to the satellite data is that it’s because sea level isn’t rising fast enough to account for their assumptions about Greenland and Antarctic ice mass losses… Losses that are based on their GIA estimates for Antarctica and Greenland.
While the mass increase of the oceans may very well be altering the shapes of the ocean basins, this can’t be measured… And it doesn’t matter, because the satellites are measuring the sea surface elevation.
The year-on-year margin of error for total snowfall in Antarctica exceeds the yearly ice loss everywhere else non-arctic.
The glacial isostatic adjustment (GIA) also tends to exceed the asserted ice loss of Antarctica.
“About as close to unity as nature can get.”
Maybe nature but did you see the 95% confidence intervals? Stinks of the trend being the result of method rather than coming from the data.
The trend comes from the data, just as the standard deviation does.
The trend is very linear, even though the slope is much smaller than the standard deviation.
The graph shows +/- 2 standard deviations of the dataset, the standard error in the current value is about 4% (95+/-4 mm).
Its not the error of absolute sea level but change in sea level. There is something amiss.
From what I have read it takes up to 800 years for the cold water at the
Poles to sinks and finally remerges as a up welling in the far future.
The likes of the UN’s IPCC and its Green followers are saying that if we
start to use less fossil fuel it will “”Save the Planet”” , but they are about 800
years too late.
Anyway while not being prepared to do anything about the likes of India and
China plus South East Asia, using the feeble excuse that these poor Third
World Countries must be allowed to catch up to the Western style countries
is utter nonsense.
If indeed its the death of all life on this Planet that the Greens are carrying
on about, it has to apply to the whole Worlds countries, not just the once
rich Western style countries.
This whole Green thing is clearly just a big and so far very successful
smokescreen, to cloak the long term agenda of a Socialist come
Communist type World Government, run by them of course.
MJE VK5ELL
“Nauels and his colleagues used a simple mathematical model calibrated against the results published in the most recent IPCC report.”
A simple mathematical model? Pffft…
And the reports at that link are 5 years old or more…hardly recent.
Not that “CO2 sticks around for hundreds of years” nonsense again.
Now THAT’s what I would call a model:
https://www.dailymail.co.uk/tvshowbiz/article-7678617/Rod-Stewarts-secret-hit-track-Veteran-rocker-finally-lets-world-legendary-model-railwa.html
Sea level rise is remarkably linear. This contrasts with virtual all other climate data. It’s as though sea level is buffered.
Mike McHenry
“Sea level rise is remarkably linear. ”
No it isn’t. Even the PMSL evaluation with the least trend of all – Dangendorf & al. – reports about an acceleration since the Sixties.
https://drive.google.com/file/d/1MGoEHD0laRzlwP9ukNvHCpoJLbHHTLW1/view
You see from their data that the linear estimate doesn’t fit at all.
The paper:
https://www.pnas.org/content/114/23/5946
I wonder where the water is going to come from.
Regarding “Figure 1. Global last 7,000 years, error bars omitted (Brock et al., 2008)”: It shows global sea level much higher (by 5 meters) 900 years ago and 2800 years ago. Isn’t that an indication of GLOBAL warming at those points in time (and hence disprove the Hockey Stick)?
Having made some contributions above I would like to pull my thoughts together.
You pointed out the 2 figures from Jevrejeva et al’s paper of 2014. Turning to the second one I decided to analyse the Brest Tidal Readings (1807 to 2018) in the same way as my analyse of the Full Tidal Data (1880 to 2013). I have created a comparison plot showing the quadratic best fit and a sinusoidal fit based on a 1000-year period. They appear in the links below although one has been presented already.
Brest:-
https://drive.google.com/file/d/1ze31aDw8jO7NswELha83VfQgYHE4m97C/view?usp=sharing
Full data:-
https://drive.google.com/file/d/1gjBS78xYrVZ4U2RsZe-AhIF7v5hk4FUI/view?usp=sharing
The Brest acceleration using a quadratic fit is 0.0128mm/year2 compared with 0.0126mm/year2 for full data
The sinusoidal amplitude is 450mm compared with 415mm
And the phase shift is 1400 years compared with 1420 years
These differences are negligible but the main point in the Brest results is that the results prior to 1850 do not show a rapid change as in Jevrejeva 2014 but follow a gradual change reaching a minimum in about 1850. Reading Jevrejeva 2014 it seems that the pre 1850 trend is based on only a couple of areas, namely the Baltic and the Neatlantic, as his reference to Jevrejeva 2006 revels. The Baltic readings are the set that dominate this pre 1850 trend and I would have thought that the Baltic would not be the most representative sea to use.
Referring to the first of Jevrejeva’s figures you showed he indicates over the period 1930 to 2010 three linear phases with slopes of 3.0681, 1.1536 and 3.1547 mm/year respectively. I have extracted from my paper an annotated fig 9
https://drive.google.com/file/d/1PdJLuwUj4Y7vDI3dhLV6Mp9cg6IS8TlG/view?usp=sharing
which shows a more curved behaviour. Over the period 1930 to 2010 the min and max slopes (velocities) are 2.261, 1,284 and 2.982 mm/year. The added sinusoidal term was a 6mm amplitude, 57-year period eye balled in and could have easily be judged as a =/-8mm/year curve which improve comparisons. Refence to Chambers et al 2012 could easily accommodate a combined average amplitude of 8mm. Nature, I think, works in a smoother manner than a series of linear portions although having said that the linear values help in judging trends.
A question I would like to ask is how long does sea level rises lag behind temperature fluctuations?
Finally, one observation that is not commonly stated has a bearing on the satellite readings as analysed by Nerem et al. The figure below is taken from my paper and shows a quadratic fit to a sinusoidal curve. That curve was derived as a good fit to the residuals resulting from the differences between the satellite readings and a straight line. When applying a quadratic fit to a set of data derived from the sinusoidal curve an acceleration almost the same as that quoted by Nerem et al is obtained showing the high accelerations quoted are due to the method used and not inherent in the data.
https://drive.google.com/file/d/1qYpVeKAd86fkFrd6X5bwYGerBWcr89J-/view?usp=sharing
And finally finally its been very stimulating, and keeping the grey matter going, to participate in these discussions. As a retired (26 years and counting) Chief Design Engineer in Civil Engineering it has reawaken the thrill of analysis.
It is easy to get the tide times and tide charts for the city of Venice. The tide at Venice normally varies by 1 meter. On 12th November 2019 the spring high tide was meant to be 0.99 metres. The next spring high tide will be on 25th November 2019 and is meant to be 1.04 metres. It would be interesting to dig up the tide charts of 1966 when there was even higher flood level in Venice. In any case are both the maximum and minimum tide levels of 2019 about 15 cm higher than of 50 odd years ago, to correspond with 3 mm increase per year ? Wouldn’t you expect a 15 cm higher record this year= 2.09 ? The remarkable thing is that the record wasn’t broken even with generally higher sea level.
It looks like several factors could have contributed to the 1.87 m flood level this Nov 12th 2019, which is still lower than the 1.94 m flood level of 1966. I read an article in which the author claimed that dredging to deepen the main canal for huge cruise ships to dock at Venice has aided the floods. How would anyone go about testing that claim ? Does it sound plausible ? See article , “GOOD OR BAD? THE TRUTH ABOUT THE CRUISE SHIPS IN VENICE, ITALY” on veneziaautentica
The River Sile in the north and the River Brenta to the south have long been diverted to bypass the Venetian Lagoon but can the water coming out into the Adriatic back up and flow into the lagoon under high spring tide conditions with SE winds and low pressure centered above ? What about water coming directly into the lagoon from towns on the mainland shore north of Venice ? What about amount of rain falling directly into the lagoon ? Can anyone find if the wind over the Adriatic sea on the 12th November was wholly from the south. My spot checks seem to give conflicting results.
https://www.bbc.co.uk/news/science-environment-50438611
Unmitigated horst schist.