Guest post by Paul Dorian
*Potential role of low solar activity this winter as solar minimum deepens and the wide-ranging impacts of increasing cosmic rays*

The sun is blank again today and for the 200th day in 2019 as the solar minimum deepens; image courtesy NASA
Overview
The sun continues to be very quiet and it has been without sunspots on 200 days during 2019 or 72% of the time which is the highest percentage since 2009. We have entered into a solar minimum phase of the solar cycle and sunspot counts suggest this could turn out to be the deepest of the past century. Low solar activity has been well correlated with an atmospheric phenomenon known as “high-latitude blocking” and this could play an important role in the upcoming winter season; especially, across the eastern US. In addition, one of the natural impacts of decreasing solar activity is the weakening of the ambient solar wind and its magnetic field which, in turn, allows more cosmic rays to penetrate the solar system. The intensification of cosmic rays can have important consequences on such things as Earth’s cloud cover and climate, the safety of air travelers, and as a possible trigger mechanism for lightning.

Daily observations of the number of sunspots since 1 January 1900 according to Solar Influences Data Analysis Center (SIDC). The thin blue line indicates the daily sunspot number, while the dark blue line indicates the running annual average. The recent low sunspot activity is clearly reflected in the recent low values for the total solar irradiance. Data source: WDC-SILSO, Royal Observatory of Belgium, Brussels. Last day shown: 30 September 2019. Plot courtesy “climate4you.com”.
Background
Solar cycle 24 was the weakest sunspot cycle with the fewest sunspots since cycle 14 peaked in February 1906. Solar cycle 24 continued a recent trend of weakening solar cycles which began with solar cycle 21 that peaked around 1980. The sun is blank again today for the 200th day this year and the last time the sun was this spotless in a given year on a percentage basis was 2009 during the last solar minimum when 71% of the days were without visible sunspots. That last solar minimum actually reached a nadir in 2008 when an astounding 73% of the year featured a spotless sun – the most spotless days in a given year since 1913 – and this year has a chance to match or exceed that quietest of years in more than a century.

Low solar activity years are well correlated with abnormally high geopotential height anomalies at 500 millibars over high-latitude regions such as Greenland and Iceland (shown in red, orange, yellow); data courtesy NOAA/NCAR
Low solar activity and “high-latitude blocking”
As any snow lover and weather enthusiast knows living in the I-95 corridor, it takes many ingredients to fall into place for a snowstorm to actually take place; especially, in the urban areas of DC, Philly, New York City and Boston. One requirement for accumulating snow is, of course, cold air near or below freezing, but it can be a little more complicated than that. It is one thing to have cold air around at the beginning of a potential storm, but the best chance for significant snow comes when there is sustained cold air; otherwise, you could end up with a snow-changing-to-rain type of event; especially, in the big cities and areas closer to the coast. One of the ways to sustain a cold air mass in the Mid-Atlantic/NE US is to have “high-latitude blocking” and that type of weather phenomenon is well correlated with low solar activity.
“High-latitude blocking” during the winter season is characterized by persistent high pressure in northern latitude areas such as Greenland, northeastern Canada, and Iceland. If you look back at years with low solar activity, the upper-level geopotential height anomaly pattern is dominated by high pressure over these high-latitude regions during the winter season (December-to-February). Without this type of blocking pattern in the upper atmosphere, it is more difficult to get sustained cold air masses in the eastern US during the winter season.
In addition to the increased chance of sustained cold air during low solar activity years, “high-latitude blocking” in the upper atmosphere tends to slow down the movement and departure of storms along the Mid-Atlantic/NE US coastlines and this too increases the chances for significant snowfall as long as there is entrenched cold air. In fact, some of the greatest snowstorms in the Mid-Atlantic/NE US regions took place in low solar activity winters including, for example, those in February 2010, December 2009, and January 1996. There are, of course, other important factors in addition to solar activity to consider in the prediction of accumulating snow along the I-95 corridor including sea surface temperatures in the western Atlantic and the positioning of polar and sub-tropical jet streaks. The 2019-2020 “Winter Outlook” by Perspecta Weather will be released shortly and low solar activity will certainly be one key factor among several.

Data source: The Sodankyla Geophysical Observatory in Oulu, Finland. Plot courtesy Spaceweather.com
Low solar activity and cosmic rays
Galactic cosmic rays are high-energy particles originating from outside the solar system that can impact the Earth’s atmosphere. Our first line of defense from cosmic rays comes from the sun as its magnetic field and the solar wind combine to create a ‘shield’ that fends off cosmic rays attempting to enter the solar system. The shielding action of the sun is strongest during Solar Maximum and weakest during Solar Minimum with the weakening magnetic field and solar wind. The intensity of cosmic rays varies naturally during the typical 11-year solar cycle with about a 15% variation because of the changes in the strength of the solar wind.
Evidence of an increase in stratospheric radiation
One way to monitor cosmic ray penetration into the Earth’s upper atmosphere is to measure stratospheric radiation over an extended period of time. “Spaceweather.com” has led an effort for nearly four years to monitor radiation levels in the stratosphere over California with frequent high-altitude helium balloon flights. These balloons contain sensors which detect X-rays and gamma-rays in the energy range 10 keV to 20 MeV and are produced by the crash of primary cosmic rays into Earth’s atmosphere. These energies span the range of medical X-ray machines and airport security scanners. The findings confirm the notion that indeed cosmic rays have been steadily increasing over California as we climb into the solar minimum.
During the last solar minimum in 2009, radiation peppering Earth from deep space reached a 50-year high at levels never before seen during the satellite era – and we’re getting very close to those same levels and a new record is certainly on the table in the near future. Ground-based neutron monitors and high-altitude cosmic ray balloons are registering the increase in cosmic rays. Neutron monitors at the Sodankyla Geophysical Observatory in Oulu, Finland show that cosmic rays are just percentages away from a new record in the satellite era which was set in 2009. Data has been measured at this observatory in Finland since 1964. When cosmic rays hit Earth’s atmosphere, they produce a spray of secondary particles that rain down on Earth’s surface. Among these particles are neutrons and the detectors at the observatory in Oulu count them as a proxy for cosmic rays.
Consequences of increasing cosmic rays
1) Cloud cover/climate
The correlation between cosmic rays and cloud cover over a solar cycle was first reported by Svensmark and Friis-Christensen in 1997. A more recent study by Svensmark published in the August 2016 issue of Journal of Geophysical Research: Space Physics continues to support the idea of an important connection between cosmic rays and clouds.
In this publication, the authors found that “the observed variation of 3–4% of the global cloud cover during the recent solar cycle is strongly correlated with the cosmic ray flux. This, in turn, is inversely correlated with the solar activity. The effect is larger at higher latitudes in agreement with the shielding effect of the Earth’s magnetic field on high-energy charged particles. The above relation between cosmic ray flux and cloud cover should also be of importance in an explanation of the correlation between solar cycle length and global temperature that has been found”.
2) Threat to air travelers
Not only can an increase of cosmic rays have an impact on Earth’s cloud cover and climate, it is of special interest to air travelers. Cosmic radiation at aviation altitudes is typically 50 times that of natural sources at sea level. Cosmic rays cause “air showers” of secondary particles when they hit Earth’s atmosphere. Indeed, this is what neutron monitors and cosmic ray balloons are measuring–the secondary spray of cosmic rays that rains down on Earth. Secondary cosmic rays penetrate the hulls of commercial aircraft, dosing passengers with the whole body equivalent of a dental X-ray even on ordinary mid-latitude flights across the USA. International travelers receive even greater doses (source). The International Commission on Radiological Protection has classified pilots as occupational radiation workers because of accumulated cosmic ray doses they receive while flying. Moreover, a recent study by researchers at the Harvard School of Public Health shows that flight attendants face an elevated risk of cancer compared to members of the general population. They listed cosmic rays as one of several risk factors.
3) Possible lightning trigger
Finally, there has been some research suggesting there is a connection between cosmic rays and lightning (paper 1, paper 2). When cosmic rays smash into molecules in our atmosphere, the collisions create showers of subatomic particles, including electrons, positrons, and other electrically charged particles. This shower of electrons would collide into still more air molecules, generating more electrons. All in all, cosmic rays could each set off an avalanche of electrons and trigger lightning.

Circled areas on plot indicate locations that experienced the northern lights during the Carrington Event of 1859.
Final Thoughts
While the frequency of solar storm activity generally lessens during periods of low solar activity (e.g., during solar minimum phases), there is actually some evidence that suggests the severity does not diminish. In fact, the most famous solar storm of all now known as “The Carrington Event” took place in 1859 during an overall weak solar cycle (#10). In addition, other solar activity, such as coronal holes that unleash streams of solar material out into space, can amplify the auroras at Earth’s poles. The bottom line, a lack of sunspots does not mean the sun’s activity stops altogether and it needs to be constantly monitored – even during periods of a blank sun.
Meteorologist Paul Dorian
Perspecta, Inc.
perspectaweather.com
Major US Nor’easter snowstorms typically occur when the Arctic Oscillation is turning strongly positive after being strongly negative. So during a stronger period of solar wind immediately following a period of weaker solar wind. Solar coronal hole streams vary in intensity considerably on weekly to monthly scales.
With clouds, weaker solar wind drives warmer ocean phases, ENSO and the AMO (via negative NAO/AO), which reduces low cloud cover in the mid latitudes, and increases low cloud cover in the Arctic. That’s probably why Arctic summers have been often below average temperature since 2001. See the increase in annual UK sunshine hours from the mid 1990’s with the warming of the AMO:
Working out the solar deep minimum’s effect on the global cooling isn’t an easy task. About couple of years ago I did an exercise analysing the Maunder minimum type effect on the N. Hemisphere’s climate trends.
The ‘conclusion’ was that a ‘short’ solar minimum effect would be negligible while a 50 year Maunder type minimum would result in up to 0.75 degree C temperature fall, or about 20 years of cooling in excess of 0.5 degree C.
The analysis is based on the past ‘reality’, which suggest there are long term natural variability cycles, not necessarily directly related to the deep solar minima.
The intensity of cooling that may occur depends where the Maunder type minimum falls in relation to the multi-decadal & multi-centenary cycles.
In this exercise I looked at possibility that the MM start coincides with any of the three future cycles: SC25 or SC26 or SC27.
In this link I show graphic representation of my analysis
http://www.vukcevic.co.uk/NH-GM.htm
From the above, accounting for the Atlantic’s multi-decadal and global multi-centenary trends, initial cooling was a slow process while the subsequent warming appears to have been more rapid.
The beginning of a new cycle will probably launch La Nińa.
You know, we’ve had a decrease in sunspot activity, and yet this year has had the hottest June, July, and September on record.
Doesn’t this CONFIRM that rising levels in greenhouse gases are the biggest role in the current temperatures?
Satellite readings take into account the temperature rise in the lower stratosphere, which is a mistake. The temperature in the southern hemisphere is very low this winter.

The height of the tropopause in winter decreases significantly towards the pole.
http://ds.data.jma.go.jp/tcc/tcc/products/clisys/STRAT/gif/zt_sh.gif
You must go to the North Pole if you want to have a temperature above the average.
Doesn’t this CONFIRM that rising levels in greenhouse gases are the biggest role in the current temperatures?
No. Records show climate is always changing naturally. No one can “prove” that it isn’t just the same natural changes that have always occurred.
There will be unusual temperature drops next week in Colorado at night.
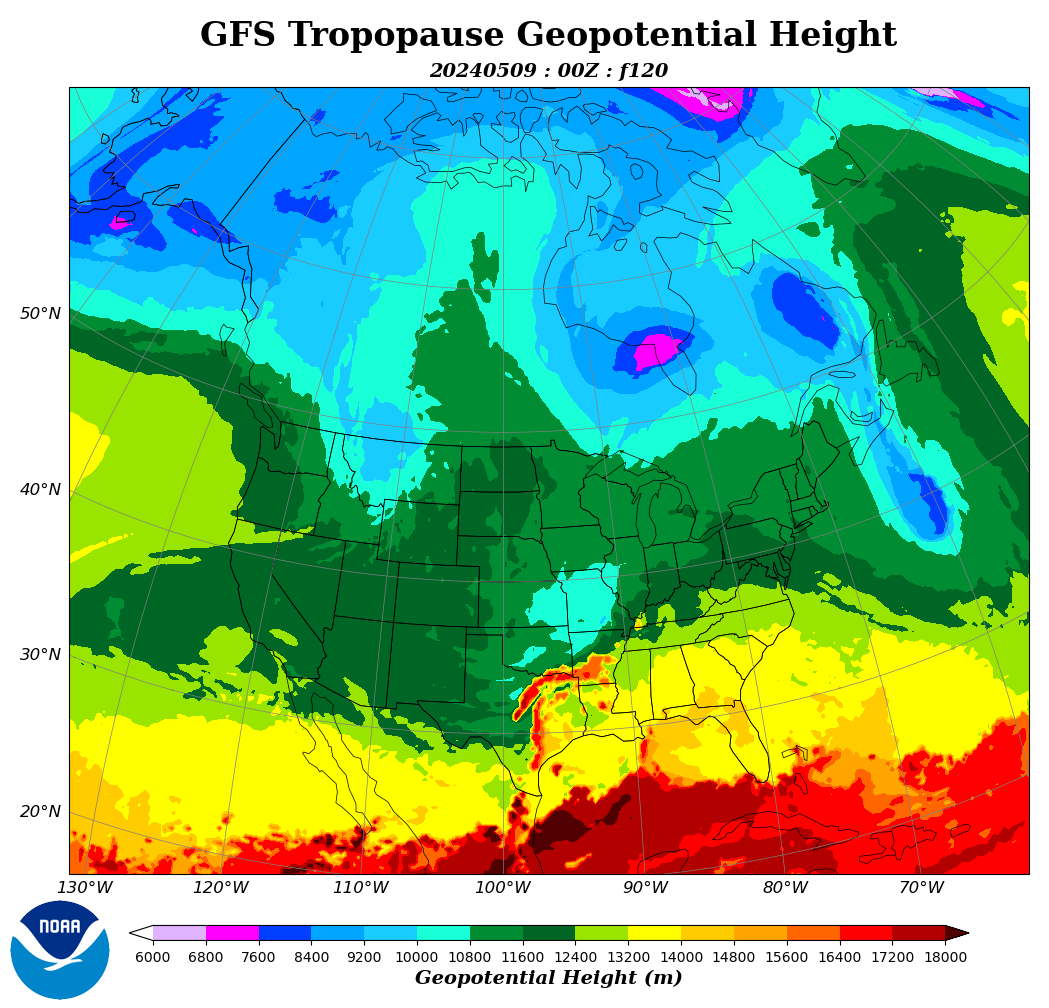
A high vertical temperature gradient will lower the tropopause height to just 6 km.
It looks like a serious attack of winter in the Midwest.
Thanks REN – I always check your links; appreciate the heads up of the atmospheric conditions. We had a horrible cold wet spring into early summer after a bitterly cold/stormy winter- crops are delayed and a percentage of fields were not planted, I do see the crop fields that are empty this year, in our local. I’ve not seen exact numbers yet but it’s noticeable difference. My relatives out west say it’s the same there and they just shoveled a foot and a half of that magical carbon causing AGW snow off their driveway – in Sept.
Canada.
This will cause a strong drop in temperature at night and a large temperature difference on the front.

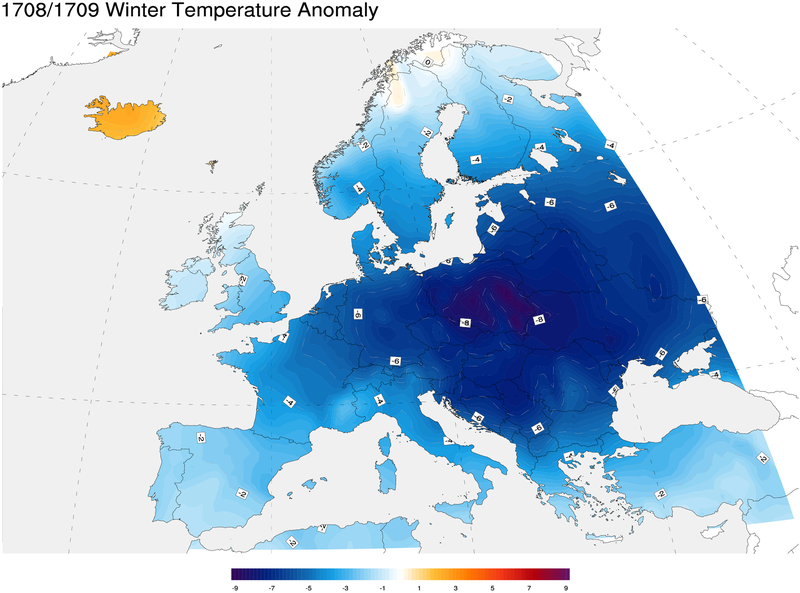
A positive anomaly in Iceland indicates a strong circulation blockade during the winter of 1708/1709.