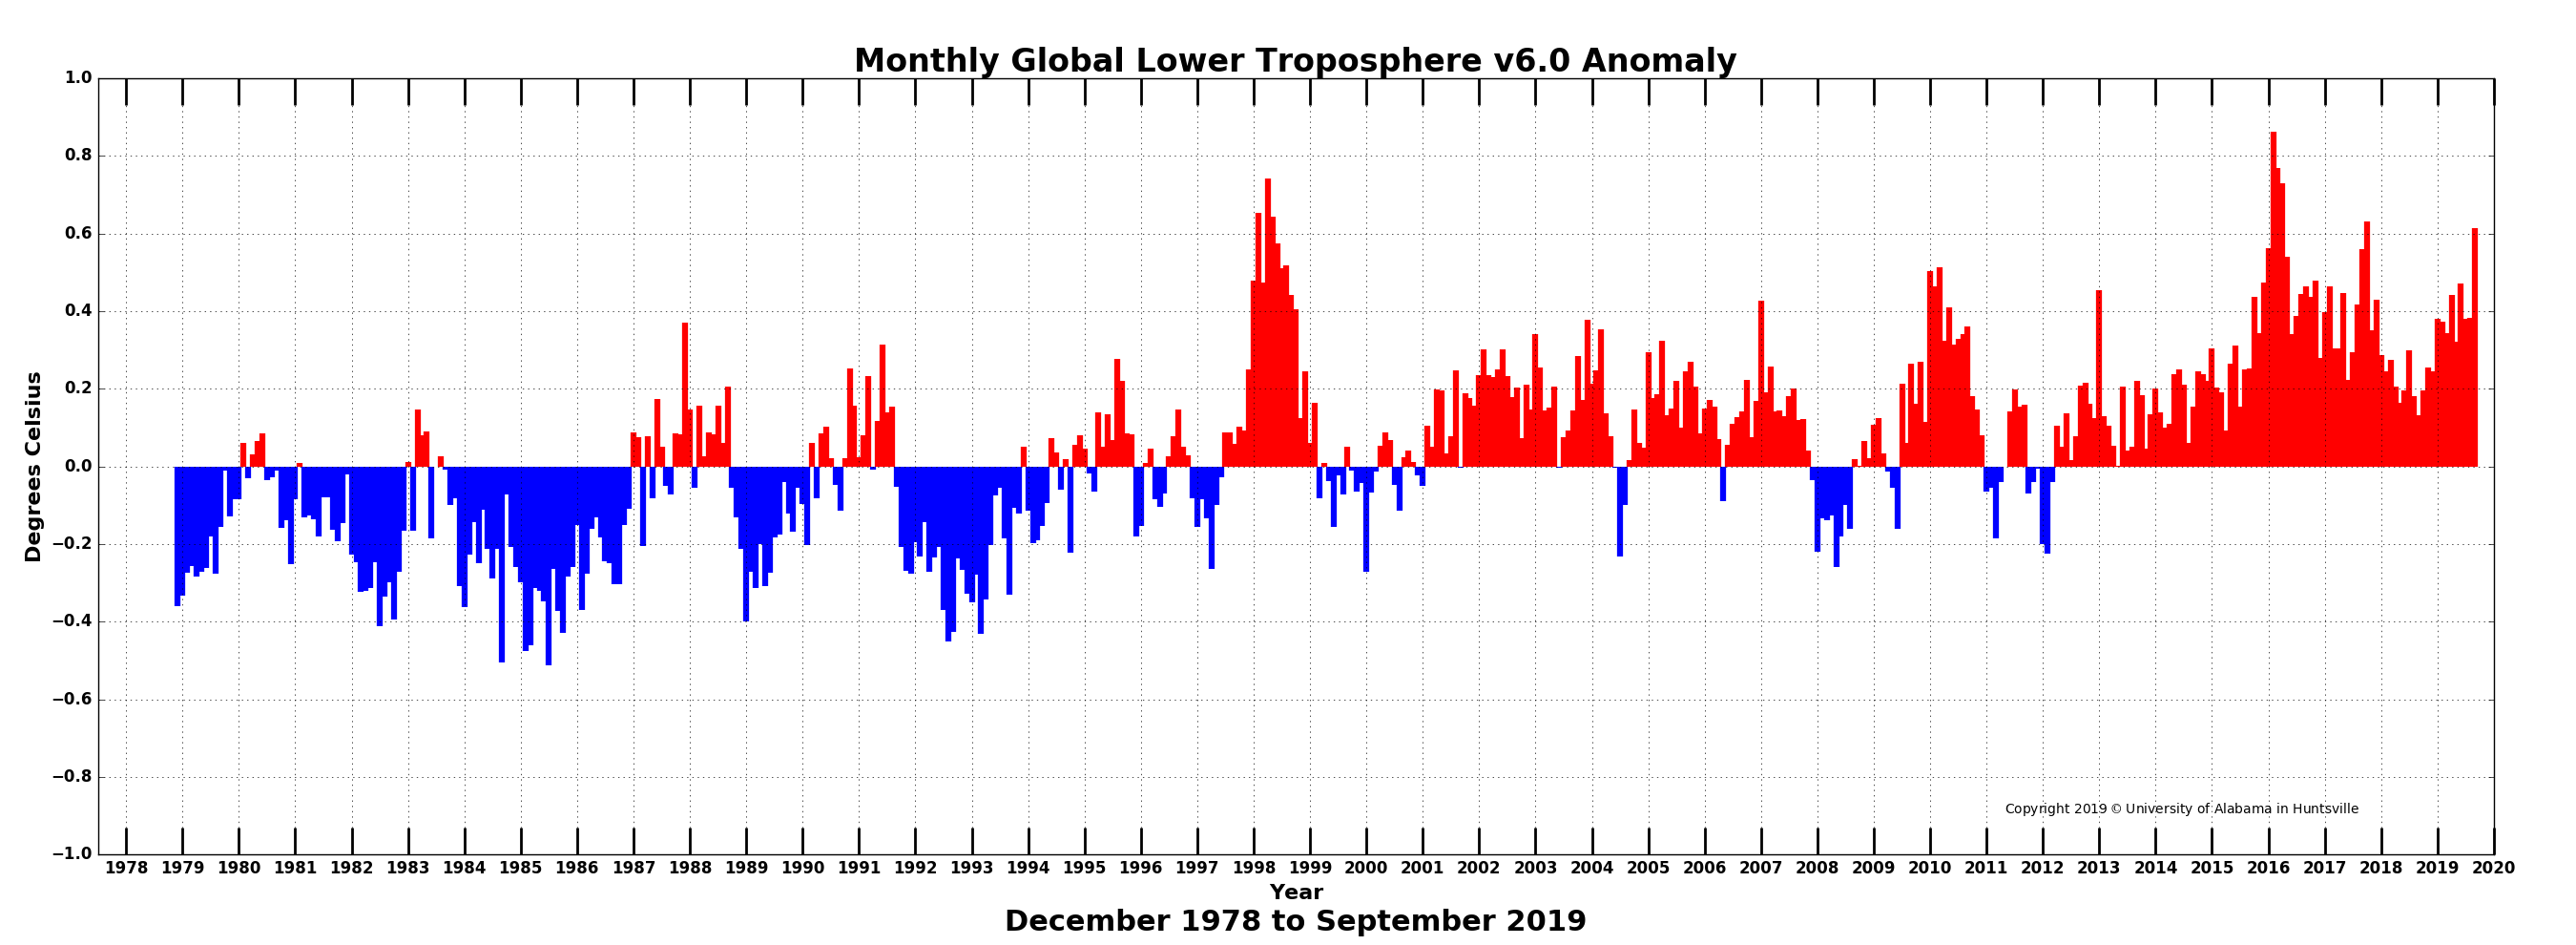
Global climate trend since Dec. 1 1978: +0.13 C per decade
September Temperatures (preliminary)
Global composite temp.: +0.61 C (+1.10 °F) above seasonal average
Northern Hemisphere.: +0.64 C (+1.15 °F) above seasonal average
Southern Hemisphere.: +0.58 C (+1.00°F) above seasonal average
Tropics.: +0.60 C (+1.08°F) above seasonal average
August Temperatures (final)
Global composite temp.: +0.38 C (+0.68 °F) above seasonal average
Northern Hemisphere.: +0.33 C (+0.59 °F) above seasonal average
Southern Hemisphere.: +0.44 C (+0.79°F) above seasonal average
Tropics.: +0.45 C (+0.81 °F) above seasonal average
Notes on data released October 3, 2019 (v6.0)
September’s globally-averaged, bulk-layer atmospheric temperature anomaly of +0.61°C (+1.10°F) represented the warmest September reading of the past 41 Septembers in our satellite record. The jump from August was substantial (+0.23°C) and ranks among the largest month-to-month changes. (Several previous jumps were greater than 0.3°C however.) The warmth was global in extent with warmest September temperatures posted for both hemispheres and the tropical belt. This month-to-month heating is possibly related, at least in part, to the tropical Pacific Ocean’s loss of heat energy to the atmosphere in the recent months as El Niño conditions declined.

The impact of additional greenhouse gases in the atmosphere over the last 41 years plays a role as well in terms of the slow, longterm rise, though the magnitude of this effect is uncertain. Though this is the warmest September departure from average recorded by satellites, other months, especially those in the heart of the El Niño cycle (Feb-Apr) achieved departures exceeding 0.7 °C.
The conterminous U.S. experienced one of its warmest Septembers (+1.14 °C, +2.05 °F) though well below the warmest from 1998 (+1.78 °C, 3.20 °F). The Northwest was below average but a larger area of the Eastern half of the lower-48 (and Alaska too) was above average.

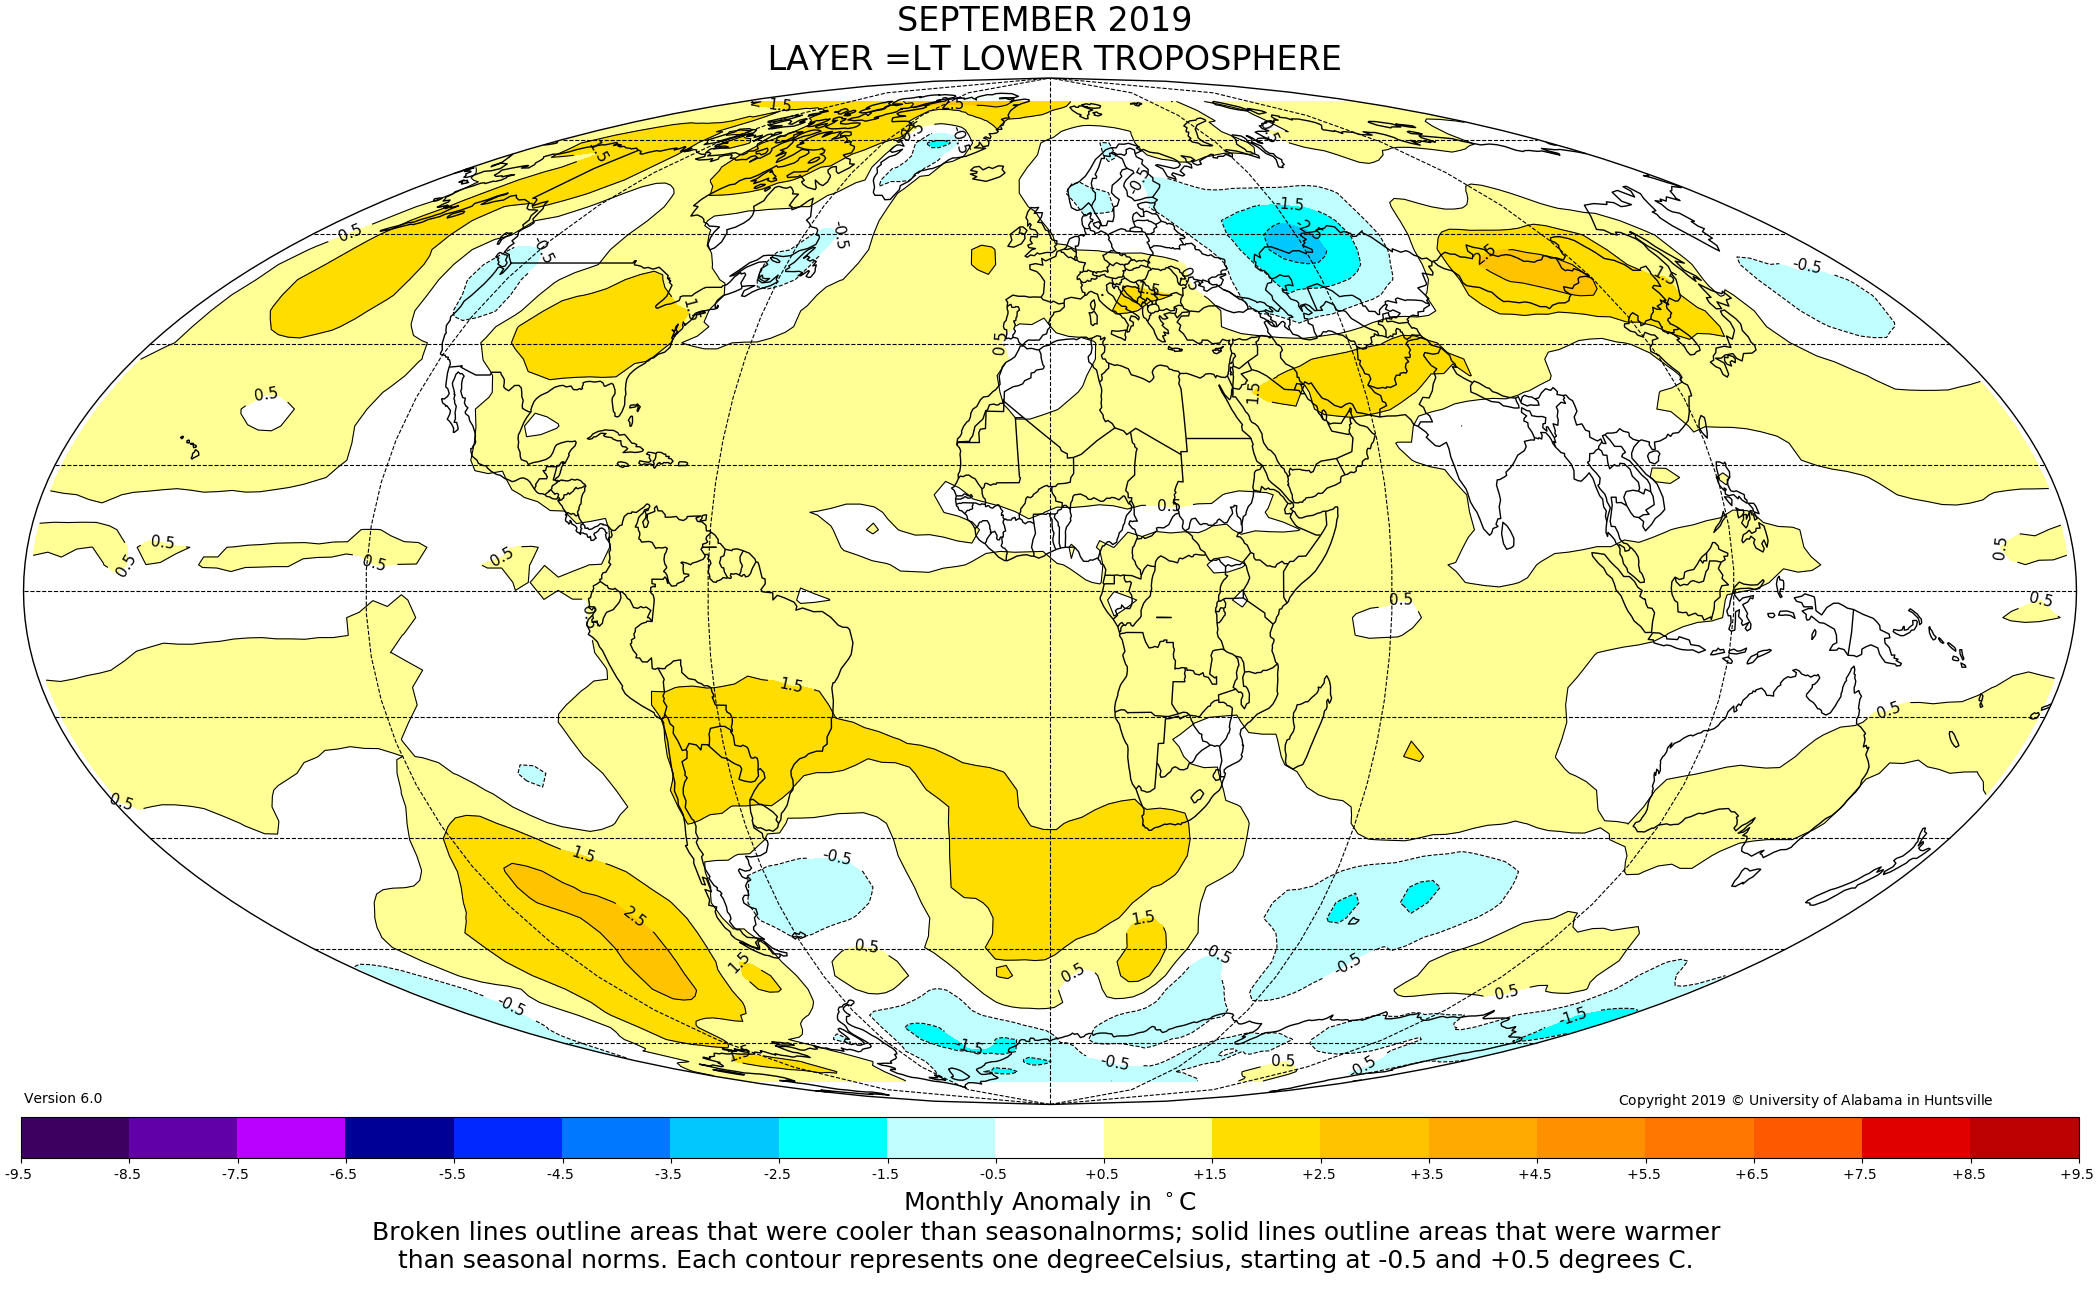
Globally, locations with sustained warmer-than-average temperatures for the month appeared over the SE and NE Pacific Ocean (the latter known as the warm “blob” by coastal residents there). The Arctic warmth in the western hemisphere was associate with the warmest local temperature anomaly in Northern Greenland of +3.2°C. Other warm spots were central South America eastward across the South Atlantic to South Africa, parts of the Middle East and much of central China.
The planet’s coldest departure from average this month was -2.9 °C in western Russia near Khmelevka on the Kazakshstan border. Other cool areas were seen on the south Greenland Plateau, South Indian Ocean, NW Pacific Ocean and portions of Antarctica.
NOTE: It appears some of the raw data from the satellites are problematic for September 2019. The values should be used with caution as they appear to be too warm in the lower troposphere and too cold in the stratosphere. We are investigating.
Spoiler Alert first published March 2019: As noted over the past several months in this report, the drifting of satellites NOAA-18 and NOAA-19, whose temperature errors were somewhat compensating each other, will be addressed in this updated version of data released from March 2019 onward. As we normally do in these situations we have decided to terminate ingestion of NOAA-18 observations as of 1 Jan 2017 because the corrections for its significant drift were no longer applicable. We have also applied the drift corrections for NOAA-19 now that it has started to drift far enough from its previous rather stable orbit. These actions will eliminate extra warming from NOAA-18 and extra cooling from NOAA-19. The net effect is to introduce slight changes from 2009 forward (when NOAA-19 began) with the largest impact on annual, global anomalies in 2017 of 0.02 °C. The 2018 global anomaly changed by only 0.003°C, from +0.228°C to +0.225°C. These changes reduce the global trend by -0.0007 °C/decade (i.e. 7 ten-thousandths of a degree) and therefore does not affect the conclusions one might draw from the dataset. The v6.0 methodology is unchanged as we normally stop ingesting satellites as they age and apply the v6.0 diurnal corrections as they drift.
To-Do List: There has been a delay in our ability to utilize and merge the new generation of microwave sensors (ATMS) on the NPP and JPSS satellites. As of now, the calibration equations applied by the agency have changed at least twice, so that the data stream contains inhomogeneities which obviously impact the type of measurements we seek. We are hoping this is resolved soon with a dataset that is built with a single, consistent set of calibration equations. In addition, the current non-drifting satellite operated by the Europeans, MetOP-B, has not yet been adjusted or “neutralized” for its seasonal peculiarities related to its unique equatorial crossing time (0930). While these MetOP-B peculiarities do not affect the long-term global trend, they do introduce error within a particular year in specific locations over land.
As part of an ongoing joint project between UAH, NOAA and NASA, Christy and Dr. Roy Spencer, an ESSC principal scientist, use data gathered by advanced microwave sounding units on NOAA, NASA and European satellites to produce temperature readings for almost all regions of the Earth. This includes remote desert, ocean and rain forest areas where reliable climate data are not otherwise available. Research Associate Rob Junod assists in the preparation of these reports.
The satellite-based instruments measure the temperature of the atmosphere from the surface up to an altitude of about eight kilometers above sea level. Once the monthly temperature data are collected and processed, they are placed in a “public” computer file for immediate access by atmospheric scientists in the U.S. and abroad.
The complete version 6 lower troposphere dataset is available here:
http://www.nsstc.uah.edu/data/msu/v6.0/tlt/uahncdc_lt_6.0.txt
Archived color maps of local temperature anomalies are available on-line at:
Neither Christy nor Spencer receives any research support or funding from oil, coal or industrial companies or organizations, or from any private or special interest groups. All of their climate research funding comes from federal and state grants or contracts.
-30-
Wrote Roy on this but may have wound up in spam In most cases, NCEP CFSR and UAH are close ( within .1C) UAH is the gold standard to me, the NCEP CFSR tho it is an initialization every 6 hours of the model can give us hints. This is the biggest difference I can remember NCEP CFSR was 4th warmest on its record, at .317 C but that is way below UAH, In August, they were close to each other, So something interesting is going on, Aug was .318C, and as Dr Spencer mentioned, it was .38 C, which was within .1C
Joe
Excellent late summer and early Autumn in the SE of the UK. October has only just seen single digit temperatures at night, so very comfortable and pleasant although a bit wetter than usual.
Happy to see average temperatures rising as a warm planet is a good planet!
When you don’t have typhoons and hurricanes to extract the heat, you get temperatures to go up.
I see that Roy has posted an update:
“We have discovered that the last 1-2 months of LT data could be biased high. This is based upon a quick analysis of tropical temperatures where our mid-tropospheric (MT) and upper-tropospheric product (TP) anomalies are usually in good agreement. September 2019 is a clear outlier, with TP much too cold compared to MT. MT was cooler in the tropics in than in August, but because TP fell so much more, their weighted difference produced a spuriously warm result for LT. Furthermore, the tropical LS (lower stratospheric temperature) is at a record low in the tropics, a result which I do not believe. I will provide an update when we figure out the problem.”
Maybe the same type of problem affected the September and October 2017 values. They were also higher than would be expected and just happen be occur in the same time frame.
Well, RSS has posted September temperatures and both TLT and TTT are the warmest on record, up around 0.2 C from August.
These results confirm UAH, so I don’t think Dr Spencer and Christy have any reason to suspect errors (cool bias) in the TTP (or TLS) channel.
The TTP channel (MSU3/AMSU7) is not used in RSS TLT or TTT, and the TLT product is only using TMT (but from different angles to subtract stratospheric cooling)
Interesting, it looks like the issue is related to the huge SSW event over Antarctica. Will blog on it today I hope.
Does stratosphere warming count as climate warming? I thought it was reciprocal – cooling as the troposphere warms and vice versa. Thus SSW’s lead to cold weather events. I guess it’s all atmosphere. But is it also weather, or climate?
> The impact of additional greenhouse gases in the atmosphere over the last 41 years plays a role as well in terms of the slow, longterm rise, though the magnitude of this effect is uncertain.
If you don’t know the magnitude you cannot say anything about the contribution.
Yes, “the magnitude of this effect” might just be zero net heat added to the atmosphere by CO2. Assuming CO2 is adding net heat to the Earth’s atmosphere is just a guess, not a given.
Have a guess Tom,
When do you expect to see the global anomaly back into the blue?

When the grand solar minimum gets going?
We are on it. Just 6 days with sunspots in all the third quarter of 2019 (JUL-AUG-SEP).
Solar radiative forcing variance is swamped by anthropogenic forcing.

1) TSI isn’t the only way the sun affects climate.
2) wikipedia isn’t a reliable source of information
3) Nylo, learn the difference between a cycle minima and a grand minima.
“The dog would’ve frozen solid from the ambient air temperature, but, luckily, he had enough fleas on him generating heat that he turned up fine.” Said no dog owner ever.
The notion that a trace gas in the thin atmosphere could be the sole temperature control knob for a planet blessed with stupendously large oceans is just goofy. Thinking that the little bit more of that trace gas that we add to that thin atmosphere is a powerful factor in and of itself is just daft.
Lloydo
What if most transport of heat from the surface up to the emission height, was by convective ladder, not radiation?
What if radiation plays a very minor role in atmospheric heat dynamics? And most is convection?
What if the universe were more than 300,000 years old, and was already in the matter dominated transparent epoch, rather than the early light dominated opaque epoch? Just saying..
Matthew Schilling,
Great Comment! Double plus good! 🙂
Matthew Schilling
The notion that a trace gas in the thin atmosphere could be the sole temperature control knob for a planet blessed with stupendously large oceans is just goofy. Thinking that the little bit more of that trace gas that we add to that thin atmosphere is a powerful factor in and of itself is just daft.
Spot on!
The concept of an emission height may be correct – a mean height of radiation of heat back to space.
But how is heat is transported from the surface to the emission height?
Warmists believe it is by radiation only but this is nonsense.
It is mostly by convection – a convective ladder.
Trace radiative gasses are indeed irrelevant.
1) TSI isn’t the only way the sun affects climate.
Maybe, but 1365kw/m2 of TSI surely dwarfs any other effect.
2) wikipedia isn’t a reliable source of information
Wiki provides links to the research which you can check for yourself, so in that respect it is completely reliable.
Phil, two strawman myths in one post, nicely done.
“the sole temperature control knob for a planet”
No one says its the *sole* control knob, look at the graph at my link it shows about 10 other forcing agents.
“Warmists believe it is by radiation only…”
Who believes that exactly? How about sticking to the facts instead of just making stuff up.
Within the next few years the temps will plateau then begin to come back down in line with the AMO is my guess. This explanation is far more valid than yours. The reason for this is that no one can explain the MWP, the RWP or the 30’s/40’s warming or and until they can, they cannot under any circumstances explain it by the current co2 concentration. We should all feel very fortunate to be living during this beautiful warm period. The Earth has had a self regulating heat system ( evidence = life) and what you are so afraid of right now has nothing to do with climate. It’s variation in the weather. Remember the definition of climate is just made up nonsense by humans with short-sightedness.
Like maybe why the last glaciation melted? what about a 40 day and night atmospheric river convection event?
Since the temperatures in the recent past (1930s) and the MWP were as warm as today or warmer (less ice in Greenland), and CO2 was lower, it is hard to say when the cycle will turn cooler again. We don’t have enough data to even know what drives the temperature. It can’t all be CO2 because we cannot explain previous warm periods during this interglacial. The temperature was warmer several thousand years ago, proven by the sea level being 2 meters higher than it is today. When we can explain these warmer periods, we may be able to predict the next portion of the cycle. The hardest thing for a scientist or car mechanic to say is, “I don’t know.”
When do you expect to see some empirical evidence that CO2 is causing the warming? I could write a computer program that showed wet sidewalks cause rain, and it would have about the same predictive power as the models in use today.
Tom Abbott October 3, 2019 at 7:32 pm
Yes, “the magnitude of this effect” might just be zero net heat added to the atmosphere by CO2.
Assuming CO2 is adding net heat to the Earth’s atmosphere is just a guess, not a given.
___________________________________________
2nd: adding net heat [] is just a guess, not a given.
But 1st: “additional greenhouse gases” ain’t mandatory CO2:
The impact of additional greenhouse gases in the atmosphere over the last 41 years plays a role as well in terms of the slow, longterm rise, though the magnitude of this effect is uncertain.
So we’re done for, right? I’ll start writing my will.
Relax. A warmer world is a healthier, more prosperous, and happier world.
OTOH, we are all going to die, so do write a will if you have property and a desire to ensure that certain people get it. A common problem is that in many states the property of those who are married with children will be split between the spouse and the children, even if they are minors and the spouse is responsible for their care. Please retain competent legal counsel to assist you.
Haven’t you done that yet ? I think Greta has already left her royalties to the parents .
Gotta look after the oldies , they will outlive the young and doomed .
‘they told me that’
Nino 3 & 4 jumped by 0.5C during the week of the Sept equinox. Prior to last month Nino 4 has been as high as now quite often before this year.
http://www.cpc.ncep.noaa.gov/products/analysis_monitoring/enso_update/ssta_c.gif
Nino 4 leads the Pacific NW Warm Pool by about 6-7 months, and Nino34 leads sea ice extent.
So the northern ocean and arctic will feel the effect of the warm Nino 3 & 4 region for months.
I foresee lots of snow in the upcoming NH winter….
“Nino 3 & 4 jumped by 0.5C during the week of the Sept equinox.”
I noticed that. It seemed to be quite a large movment in a short period of time.
Nino12 also jumped by 0.8C. It gets down to seasonal change and low solar activity, oddly, non-intuitively.
I’ve said many times before that solar effects are layered and time-dependent, and this is a perfect example of solar minimum high insolation from fewer clouds, from less energetic sunshine, combined with a seasonal effect.
The seasonal effect on Nino12 this year is right on cue with it’s annual minimum in Sept. The large jump is owed to the fewer clouds at the time when the sub-solar point was over the area during the equinox.
The ssta_c.gif shows weak LaNina-ish temps prior to the warm-up. During that period of Ninobelow zero anomaly the cloud cover diminished over the equatorial Pacific because the sun’s energy barely changed from a low level to the point where there was little warming and little to no convection of any significance out of the Nino 3 & 4 areas, opening the skies to more sunlight, ie higher insolation.
Low TSI has cooled the equatorial ocean until recently.
I just made and reviewed a movie of Pacific ocean images saved every 30 minutes for Aug-Sep to see this effect clearly. Usually such a warm-up will upwell then evaporate into convection and eventual storms, which happened with the precipitation stream we’ve seen in the US this week.
Thanks for that explanation, Bob. Very interesting! I was wondering what could cause such a large change in a short time and now I know. 🙂
So we are not sure about the accuracy or consistency of the data, but we can report it to two decimal places as the hottest ever, with no error bars.
Spot on. No errors in warming data, heretic!
Yes sir. Yes we can. But don’t start eating babies quite yet!
It does look hinky….
Let’s see what the re-analysis determines before we get into the ‘half full/half empty” glass argument.
Hate to be a broken record but if temps are recorded to the nearest one tenth of a degree that is as much precision as you can ever have. I know of no document nor practice in physics or chemistry that says you can gain additional precision over and above the recorded precision. Temps should be stated to the nearest one tenth with an uncertainty of +/- 0.05. Quoting out to one one-thousandth (and without an uncertainty shown) just makes climate scientists look less than knowledgeable about proper procedures.
In a fluid like air or water you can make an instrument reading to 0.1 deg C. In fact you can make a dozen readings in a minute. Probably three or four different ones.
??? …. last time I checked, 0.1 and a tenth of a degree were the same thing. Am I misinterpreting something here?
On another note, I don’t believe much of any of this. IMO, we “may” be able to get within a 0.5 C range …. but I’m not even sure we are capable of that with any accuracy.
Composite. So, models. Something to consider.
just stopping and pausing a bit – what does this report mean for the warming activists and those of us skeptical re agenda and human influence –
What does it mean?
Well clearly that ‘It is Worse Than We Thought(tm)’ and ‘It May Already Be Too Late(tm)’.
What other answers are there?
Sooo if it’s getting so warm, why am I wearing a jacket?
I’m freezing too. Wind whipped 47F where I am…average high for today, 64F. It’s causing me concern, and I may have to start eating babies.
Warmer is nice. Let’s have more warmth.
Question. Where do climate change advocates go on vacation?
Answer: Someplace 10 to 30C warmer than where they live.
The net effect is to introduce slight changes from 2009 forward (when NOAA-19 began) with the largest impact on annual, global anomalies in 2017 of 0.02 °C. The 2018 global anomaly changed by only 0.003°C, from +0.228°C to +0.225°C. These changes reduce the global trend by -0.0007 °C/decade (i.e. 7 ten-thousandths of a degree) and therefore does not affect the conclusions one might draw from the dataset. “
I like it when it is room temperature outside.
🙂
Anomaly from what? The perfect temperature? Which is …?
Interesting that none of these years have “zero” anomaly.
I’m on board with Gerlich and Tscheuschner – there is no way to define a “global temperature” that has any physical meaning.
Not the ‘perfect temperature’, just the difference from the 1981-2010 average lower troposphere temperature for September, according to the UAH TLT data set. The anomaly reference period is of course set to zero, so that differences from it can be reported.
But what does that then mean? I assume the 1981-2010 figures aren’t normally distributed but have an upward trend? So the earlier years are lower than the later years, so what is the average supposed to show? Positive figures for a month can be cooler than 2010 or 1997 or whenever. An average of a rising trend doesn’t seem to mean much does it?
Averaging removes the trend. 30 years (latest 3 full decades) is recommended by the WMO as a period of ‘climatology’. In 2021 UAH will start using 1991 – 2020 as its anomaly base and the anomalies will be smaller because, as you point out, the data contain a warming trend and the period 1991-2020 is likely to be considerably warmer than 1981-2010 (it’s +0.12 C warmer in UAH TLT at the moment).
Climatology is generally referenced from a 30-yr baseline. This is usually set to the previous three full decades.
https://www.ncdc.noaa.gov/news/defining-climate-normals-new-ways
It’s currently 1981-2010. In the 2020’s, it will be 1991-2010. However, different time periods are used for some purposes.
http://www.woodfortrees.org/notes#baselines
Before they had 30 full years of data, UAH also used 1979-1998.
The purpose of a temperature anomaly is to estimate how much the temperature is varying from climatology.
The term ‘anomaly’ can be misleading. Do you mean that temperatures show how far away they are from the mean of the 30 year period?
Surely it would be clearer to express the data as p-values. What is the probability of the observed temperature assuming the 30 year average is from a normal distribution.
… and why only 1981 to present? It’s meaningless unless we have a full history, which isn’t possible.
I would like someone explain how “global temperature” can be expressed solely by degrees C or K, without referring to humidity and enthalpy.
There’s a helluva lot more thermal energy in 100 degrees C in super-humid Delhi just before the monsoon, than in 100 degrees C in bone-dry Death Valley.
Referring to musical intonation, Arlo Guthrie said “Once you take acid, you realize there’s no such thing as ‘in tune’.”
So, the starting temperature is 1978? IIRC, that is at a low point in recent history. That skews the temperature rise higher.
The series starts in 1978, but the reference period (anomaly base) is the 1981-2010 September average.
The baseline is Jan 1981 – Dec 2010.
It’s not a month-by-month thing.
No, the September anomaly is in comparison to other Septembers. Otherwise there would be a seasonal variation throughout the year.
No. The anomaly is measured against the 30-yr baseline.
It’s global, annual temperature.
I think you’re wrong. Monthly absolute temperatures change by several degrees over the year. If you used the annual temperature as the baseline, you would always be seeing warm anomalies during the NH summer and cold anomalies during the winter.
“It’s global, annual temperature.”
Bellman is right. The anomaly is always measured relative to the expected value for that place and time; in this case, the monthly average (over 30 Septembers etc). Otherwise you’d see full seasonal oscillation in the anomalies.
I’ve been taking a look at the north polar region, an there aren’t a lot of stations up there. In fact, there is a huge area up there where there are no stations across te Pole within 1200 km and more.
How can area weighting be done when it requires there to be stations witin that distance for interpolating values in that area. ?
By all rights, the entire area should be marked “no data available ” — especially the whole zone above 85°.
I don’t think we have to start eating our babies just yet.
“We need to eat the babies”. If this woman is a troll, she’s good. But I suspect she might not be, and that’s scary. Check out her T-shirt.
https://twitter.com/RealSaavedra/status/1179908480322289664
This is the best compilation of studies showing that the entire planet is warming at twice the rate as the rest of the planet.
https://twitter.com/Natalia01Mateo/status/1179442677210894336?s=19&fbclid=IwAR0p7RVnAjJPsIndvl1WXaM9inr7XWnWLiUQEeKr2foNPXqEXz4WcpVAAGk
Hm. Ms Natalia claims she went from “skeptic” to “believer” – unfortunately losing her capacity to construct a meaningful sentence somewhere along the way. Sad.
But I think she’s being sarcastic
Definitely. Everywhere is heating faster than everywhere else. Another compilation:
https://twitter.com/DawnTJ90/status/1115598553215320069
Ian Gillan, Deep Purple, “The Mule”, Made in Japan, 1972
UAH gives a breakdown of various regions in it’s monthly updates with the trend for each shown at the bottom of its respective column: https://www.nsstc.uah.edu/data/msu/v6.0/tlt/uahncdc_lt_6.0.txt
The global rate in UAH is +0.13 C/dec. Only the Arctic (NoPol) is running at approximately twice that rate of warming, currently +0.25 C/dec.
Yeah, and no stations within 1200km across the pole from which data can be interpolated. Where are they getting those values?
That is F’ing hilarious.
… the same way I stop ingesting over-ripe fruit? Satellites give me a tummy ache under the best of conditions.
Nah – tastier than babies as long as you dodge the radioactive bits! This guy could have done it:
https://www.ripleys.com/weird-news/mangetout/
‘Over the course of Monsieur Mangetout’s career, his diet included 18 bicycles, seven TV sets, two beds, 15 supermarket trolleys, a computer, a coffin (handles and all), a pair of skis and six chandeliers. That’s pretty dang impressive by anybody’s standards, but the pinnacle of his entertainment career was the time he ate a whole dang airplane.’
Similar large month-on-month increase reported by RSS lower troposphere data set: http://images.remss.com/msu/msu_time_series.html
There is no such thing as an average temperature either for the globe or a locality nor is there an average weather. That sort of description is just of abstract data that does not reflect reality. When looking up at the sky, whether there are clouds there or not, every small section of the atmosphere will have a different temperature because the pressure is changing all the time as is the wind and at every change in level. It is not uncommon to have the wind direction at 180 degrees the other direction between 5000′ levels in altitude. One never hears it spoken about average pressure, which would be ludicrous, and yet all temperature is proportional to pressure. And further there is no such thing as average wind around the globe or any particular area, again something that is directly related to pressure and temperature. 55 years in aviation is behind these comments.
Furthering rk, there is no such measurable thing as average precipitation — even if it’s averaged to two decimal places for added verisimilitude.
rk
“There is no such thing as an average temperature either for the globe or a locality…”
https://drive.google.com/file/d/1p1Cjw4L7WqCZCGKUnNth1lVwergBk-tt/view
You can see the (amazing) correspondence between
– the global averaging of the temperatures measured by ten thousands of weather stations all around Earth,
and
– the global averaging of all measurements made by satellite-on board devices about 5 km over land in the lower troposphere.
Maybe you think a bit about what this means…
Regards
J.-P. D.
J.P.D.
Unfortunately much of the data shown in that link would be wrong. Many weather stations around the world are at airports and in areas where the temperature is being affected by industry and other heat causing activities. In Australia, a guy has currently already found 120 sites that don’t meet the Met Bureau’s own regulations. The latest at Lucinda in North Queensland is situated on the roof of a sugar loading terminal, on a metal roof for goodness sake – been there for 30/40 years. I personally have seen countless false or wrong records by our Bureau and of course their forecasts are just as bad. I know from a long career of airline flying there is no such thing as average weather or temperature and no one looks at temperature or the weather more than pilots.
Best wishes
RK
The globe looks rather too uniform! Everywhere was just a bit warmer? That doesn’t seem very likely given the randomness of weather.
It is lower troposphere. They have different weather (and climate) up there.
From the article: “The satellite-based instruments measure the temperature of the atmosphere from the surface up to an altitude of about eight kilometers above sea level.”
I guess Nick missed the part about UAH measuring the temperatures “from the surface”.
Nick wants to pretend that the satellite measurements are not equal to the surface temperature measurements. Nick can’t explain away why the balloon data agree with the satellite data. And the balloon data measures the temperatures “from the surface” too.
Tom Abbott
“I guess Nick missed the part about UAH measuring the temperatures ‘from the surface’.”
He very certainly did not.
The reason you will find in various hints made over the years by Roy Spencer concerning the difficulty in obtaining a correct LT time series, when coming to much in the near of the surface, because that inevitably generate biases, especially over the oceans.
I lack the time for a complete search, but here is at least a first hint on the problem:
Thus, no: UAH does not measure directly from the surface, as this would automatically invalidate their lower troposphere’s time series.
Source: https://www.drroyspencer.com/2015/04/version-6-0-of-the-uah-temperature-dataset-released-new-lt-trend-0-11-cdecade/
Rgds
J.-P. D.
“Thus, no: UAH does not measure directly from the surface”
Well, then Roy Spenser ought to delete that claim from his website and articles. Don’t you think?
“Nick can’t explain away why the balloon data agree with the satellite data.”
Simple. It doesn’t.
The satellite indices don’t even agree with each other.
Here’s a pretty good discussion of radiosondes and satellite temperatures. I excerpted a few comments from the discussion:
https://wattsupwiththat.com/2018/10/16/the-new-rss-tlt-data-is-unbelievable-or-would-that-be-better-said-not-believable-a-quick-introduction/
“Note that all satellite data warm relative to radiosondes before about 2000, and then cool after about 2000. We don’t know if this overall pattern is due to problems with the radiosonde data, with the satellite data or (most likely) both.”
“As noted in the paper, UAH and RSS (as compared with satellite datasets of NOAA and UW) had the lowest error rates relative to ALL of the radiosondes, with UAH a bit better. Note also the tropical plots and trend differences – demonstrating RSS tends to warm up more rapidly than the other various datasets (balloons and reanalyses).”
end excerpts
Now what did you say about balloon data and the UAH satellite readings agreeing, Nick?
Nick said: “Simple. It doesn’t.”
Got any references that back up your claim, Nick? “Simple. It doesn’t.” is not good enough for me, and I’ll bet it’s not good enough for most people, and it says nothing about UAH being a better match than the others, as is stated above. Can you refute that statement?
When some people don’t have a good argument they give terse, little one-liners as a substitute for facts, like Nick does most of the time. They count on you thinking they know what they are talking about and so you won’t question them. That doesn’t always work.
“Got any references that back up your claim, Nick?”
Got any references to back up your prior claim? Other than a WUWT post which cites no radiosonde data at all?
It does, however, link to an RSS FAQ, which does give data (Fig 6). And what it says is
1. There is disagreement all around
2. RSS agrees better with radiosonde than UAH V6.0.
RSS V4 also agrees quite well with UAH V5.6.
Tom
Scientists are scared of radiosondes because they smell of Ferenc Miskolczi who used radiosonde data to show that CO2 back-radiation warming is non-existent.
Bit of a disappointment to this elderly obsessive who was hoping to see the crash towards an earnestly expected Holocene resumption before he pops his clogs. Or a much younger Dryas
UK climate crisis update – it was the 24th warmest September since records began!
https://cliscep.com/2019/10/02/september-2019-uk-climate-crisis-update/
If this doesn’t convince everyone that we have to start eating babies, what will?
24th Warmest September – in the UK.
Good to see that someone takes his job about temperature reporting seriously. NASA GISS still has not published the August temperatures, and we are in October. Spanish AEMET also didn’t publish August summary yet.
“NASA GISS still has not published the August temperatures”
NASA GISS posted August on 17 September.
You are right. I thought they hadn’t because my link was old, taking me to version 3 of NASA GISS. They have stopped publishing temperatures there, it seems, now they only have data for version 4.
Version 3:
https://data.giss.nasa.gov/gistemp/tabledata_v3/GLB.Ts+dSST.txt
Version 4:
https://data.giss.nasa.gov/gistemp/tabledata_v4/GLB.Ts+dSST.txt
It is an interesting comparison, the two versions. Now, before any readers have the temptation to go and see the changes, who thinks that they have probably cooled the past and warmed the present?
OK, yes, it was an extremely easy answer. We all know what GISS does to historical temperatures.
1998 used to be a record. Now it is so small that 14 of the 20 following years show greater yearly average temperatures. In version 3 it was only beaten by 10 of the 20 years.
We can also see that this years’ temperatures are MUCH higher in version 4 than they were in version 3. There must be a very good reason for this. Or maybe not.
“OK, yes, it was an extremely easy answer. We all know what GISS does to historical temperatures. 1998 used to be a record. Now it is so small that 14 of the 20 following years show greater yearly average temperatures. In version 3 it was only beaten by 10 of the 20 years.”
And according to James Hanse there are no years other than 2016 that were warmer than 1998, and 1998 and 2016 are in a statistical tie for warmest year in the satellite era. GISS and all the other fraudulent Hockey Stick charts are lying to the people. They demoted 1998 and turned it into an insignificant year temperature-wise just so they could set up the claim that year after year was the “hottest year evah!” making it appear that CO2 is overheating the Earth.
When the truth is it was just as warm in the 1930’s as it was in 1998 or in 2016, so we are not experiencing unprecedented warmth today, contrary to alarmist claims. The whole purpose of the fraudulent Hockey Stick chart was to make it appear that the Earth was experiencing unprecedented warming, so the Fraudsters who manipulated the temperature data erased all the periods in the past that were as warm or warmer than today. It’s a blatant fraud on the people of the world.
That being said, I think President Trump should order NASA Climate and NOAA to publicly justify all the changes they have made to all the temperature records. They can start by justifying the changes they have made to the U.S. surface temperature chart. If we are going to spend TRILLIONS of dollars because of a temperature chart, then we should know that the temperature chart is accurately reflecting reality.
It’s time for NASA Climate and NOAA to explain themselves and their actions with regard to the historical temperature record. They are on the public dole and the public wants to know what they have been up to and why they are recommending that taxpayers spend TRILLIONS of dollars on trying to reduce the temperatures. Is this spending necessary or not? NASA Climate and NOAA need to give us these answers..