From Pierre Gosselin:
During last week’s record-setting European heat wave, Germany’s previous record of 40.3C was impressively shattered by the measurement station located at the northwest city of Lingen, near the Dutch border, some 50 kilometers from where I live. The German DWD weather service and media loved it!
Controversial siting
Yet, controversy now swirls about the new record setting measurement since it has come to light that the measurement is fraught with some considerable siting issues.

As the photo published by T-online here shows, the station is located right near a DWD office building, is shielded from the wind by grown trees and is located not far from a public swimming pool.


Meteorologist Michael Theusner told t-online.de:
“The monthly average of the daily highs in Lingen has been deviating more and more upwards from the average of the highs in Lower Saxony since 2010.” The station has become increasingly shielded and thus tends to heat up more.
Swiss veteran meteorologist Jörg Kachelmann wrote the extra heat possibly could be heating the station by up to another 3 degrees!
DWD accepts overheated reading
Germany’s DWD national weather service has even confirmed that the station’s siting is no longer adequate and that a move to a new site had been already long planned. But despite the acknowledged poor siting, the DWD went ahead and confirmed the reading as valid. The 42.6°C reading now stands as Germany’s new all-time recorded high temperature, no matter how questionable the reading may be.
Valid? How does Lingen compare to other temperature stations located nearby? I did a check.
Fifty kilometers to the east of Lingen where I live (Quakenbrück), my home thermometer showed a high of 38.2°C. That’s unofficial, of course, but it made the Lingen reading look suspicious. So I decided to compare Lingen to the other official stations nearby to see if their readings were as hot as Lingen’s.
The surrounding readings do indeed confirm meteorologist Kachelmann’s gut suspicion. Lingen readings are suspiciously 2 – 3C hotter than those of its neighboring stations.
What follows is a chart depicting the readings recorded by the Lingen station over the past past week. The DWD itself stated that the mercury in fact reached 42.6°C on Thursday (Do. 25.07)!

Chart: wetter24.de
Now looking at the Nordhorn station, located some 20 kilometers away, here the mercury climbed to 40.9°C, which is 1.7°C below the Lingen reading:

Chart: wetter24.de
At the Meppen station, also located some 20 km away to the north of Lingen, the mercury reached 39.2°C, a far cry (3.4°C) from Lingen’s maximum reading:

Chart: wetter24.de
At the military base in Diepholz, some 65 km to the east, the high on Thursday reached 38.7 degrees, i.e. almost 4°C below the Lingen reading!
…
More than 2°C hotter than surrounding stations!
A summary of all the temperature readings recorded at Lingen compared to those of six nearby stations for the past five days, July 23 – July 27:

On every single day, Lingen handily beat its neighbors by at times large margins.
Lingen 2.6°C hotter than adjacent stations
On the record-setting date of Thursday, July 25, 2019, the mean of the six neighboring stations listed in the table was an eyebrow-raising 2.6°C below the Lingen reading.
All the stations cited around the Lingen station all share very similar topographical characteristics, and all are located on the north German flatlands, and thus comparable.
No doubt the reading at Lingen is accurate. But it looks like the siting of the Lingen station is causing overheated conditions.
Full report at No Tricks Zone
In order to resolve this controversy, no doubt the other stations will be adjusted upwards in order to match the station that agrees with the models.
In 2016 our famous KNMI ‘lost’ 16 of the 23 heat waves from the period 1901 – 1951 after an homogenisation made by the KNMI itself. After the homogenisation it seemed that the Netherlands in the first half of the twentieth century cooled down considerably: most heat waves were gone. Warm and very warm days in our main station De Bilt were down ward corrected by up to 1.9 degrees Celsius. https://clintel.nl/hittegolven-geschrapt/ (sorry, the articles mentioned in the links are in Dutch).
A recent extensive report criticized the homogenisation: https://klimaatgek.nl/document/De%20homogenisatie%20van%20De%20Bilt%20def.pdf
Both KNMI and the Dutch Government (responsible for the KNMI) did not react on the report.
In a further correct article the Dutch ‘Financieele Dagblad’ used the now officially presented homogenised heat wave data in the following graphic: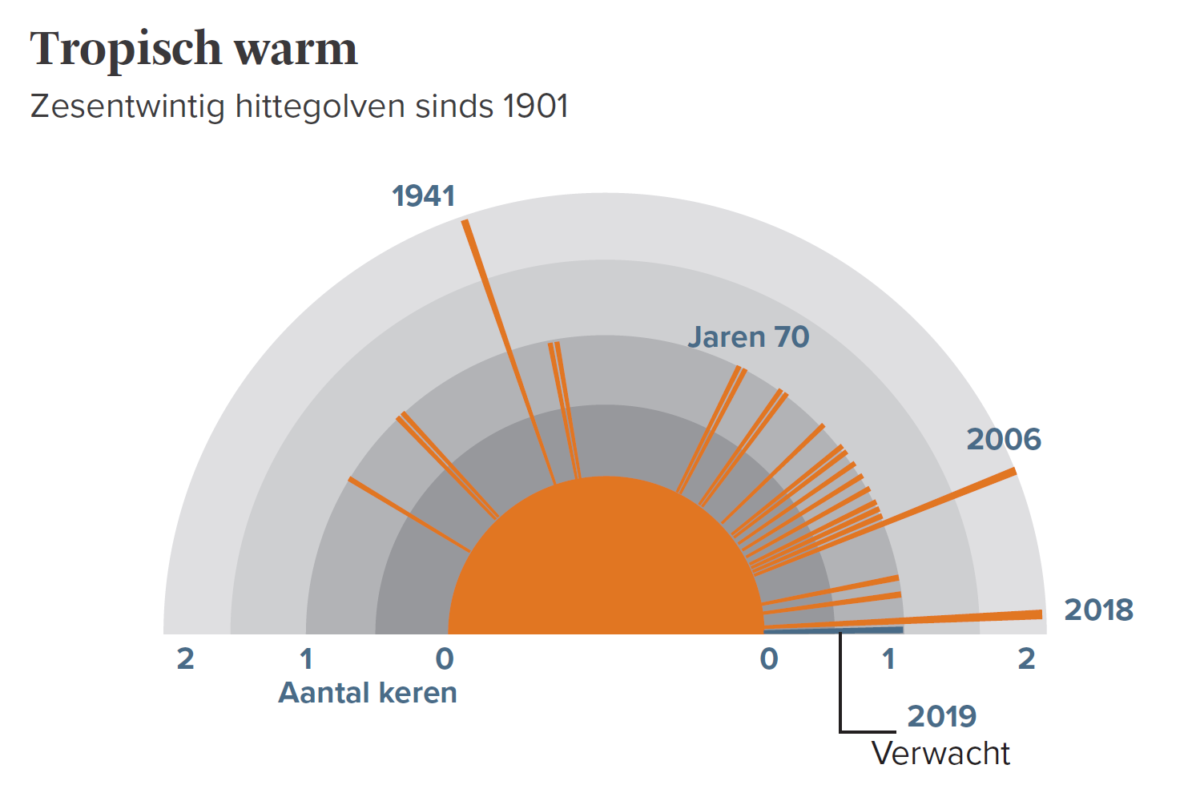
But the Groene Rekenkamer produced the same graphic with added the measured (!) but disappeared heat waves since 1901: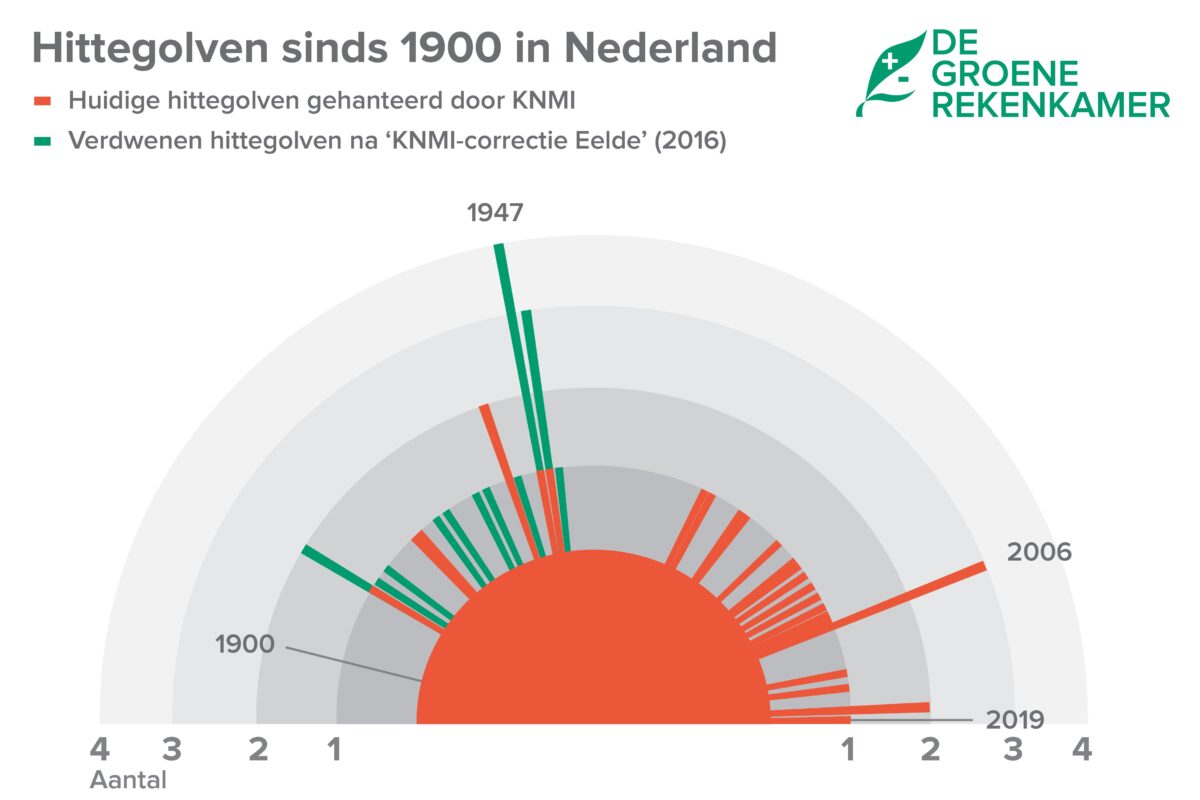 In green the measured heat waves that ‘disappeared’ from the present (since 2016) official numbers.
The second image is completely different from the first homogenised one: in the homogenised version it seems that heat waves are far more present in recent times. The original data however show that there were many heat waves in the Netherlands before 1950 – conform the stories told by our parents.
The KNMI homogenised the centrally located De Bilt with the temperatures of only one station (Eelde) that is situated 150 kilometre to the northeast. Joking I sometimes say: situated just below Norway.
KNMI is asked to restore the old situation from before the homogenisation until a correct and acceptable homogenisation has taken place. Lately asked again here: https://www.climategate.nl/2019/07/knmi-blijft-oost-indisch-doof-voor-het-raadsel-van-de-verdwenen-hittegolven/
The article in the Financieele Dagblad shows that ‘a new reality’ is going to be created. A reality that is not conform what has been measured. The reality of the first half of the twentieth century showed very warm periods that after the ‘correction’ by the KNMI are no more visible in the number of heat waves as officially presented since 2016.
Reminds of two days of 123F and 124F on a weekend in my old home town in Australia in 1906. The second day was 1F higher than Australia’s highest recorded maximum. Using data from a town 300 km away (200 miles) they figured that the Saturday was actually 8F cooler. The Sunday was ignored because they refused to believe someone actual came into work to record it.
Same in The Netherland, the old record of 1944 in Warnsveld was set in a garden in a river valley. The new record was on the military airfield Gilze-Rijen next to the runway on dried out sandy soil.
Average monthly maximum temperature for Warnsveld in July: 23.1C
https://www.buienradar.nl/weer/warnsveld/nl/2745003/klimaat
Average monthly maximum temperature for Gilze-Rijen in July: 24.2C
https://www.buienradar.nl/weer/gilze-rijen/nl/6296686/klimaat
On the average Gilze-Rijen is 1.1 degree warmer in July than Warnsveld in July. But different ‘record data’ make a difference too.
The old record of Warnsveld was set on the 23rd of August in 1944. As the average maximum temperature in Warnsveld goes down from mid August to mid September from 23.3 to 19.8C, a raw estimation would be that the average temperature for the 23rd of August should be in the range of 22.5C.
The new record (40.7 degrees Celsius) has been set in Gilze Rijen on a normally warmer date (25th of July) than the 23rd of August (Warnsveld). The normal average mid July average maximum temperature for Gilze Rijen does not differ much from the mid August temperatures for that place: 24.2 to 24.1. The difference between ‘normal 23rd August Warnsveld temperatures’ and ‘ normal 25 July Gilze Rijen temperatures is around 24.2 minus 22.5 = 1.7 degrees. As the new record in Gilze-Rijen is 2.1 degrees higher than the old one in Warnsveld, the difference from ‘normal’ has gone up 2.1 -1.7 = 0.4 degrees over a period of 75 years if corrected for temperature differences for the places of measurement and for the dates of measurement.
A rise by 0.4 degrees is not as spectacular as a simple comparison (a rise from 38.6 to 40.7 degrees for different places and different locations) suggested. So far I did not see this apple to apple comparison in the Dutch media nor by the Dutch KNMI. Like in Germany in Holland by the media and by the official (national) meteorological institutes a preference for ‘super high records’ prevails. Making people crazy about ‘climate change’ while ‘the facts’ show moderate changes in temperatures.
The official institutes should be corrected by their governments. Correct measuring is their task – not supporting emotions that are based on non-comparable and/or on non-validated data.
Obviously all the surrounding station readings need to be homogenized up to match Lingen. Talk to NASA about how to do that!
These poorly sited weather stations are becoming laughable. XD
Fact is that we had several utterly nice days. And last time I checked, summer is supposed to be hotter than chilling icy winters.
Reality is that we have all lost track of what summertime is all about. That many endless winters on the clock drift the perception of nice sunny weather, joyful “Biergartens”, romantic evenings.
Guys in electric cars hate summer as air conditioning lowers significantly their range and cruising with open windows is not something they have discovered yet.
As far as I know not a single sched flight has been cancelled nor incident reported due to “extreme heat”.
Summer rocks !
So it’s all a set-up….surprise, surprise…
M Herrera extreme temperatures: “Lingen 42,6 questioned, likely set under not proper conditions”
What we need is an international temperature doping observation group….
I don’t yet see mentioned here that the big soccer field next to the station has artificial grass. It is not as bad as bitumen but will still heat up above 50 degrees C in these circumstances that in sharp contrast to natural grass. If in recent years they have changed the grass surface that alone would easily account for the changes in the stations readings (not only the higher trees)
Some googling came up with figures of 75 degrees C above the artificial grass in these circumstances. Natural grass can heat up to 40.
So it wasn’t some private device situated on the roof of a house this time?
Wasn’t it the last time (France) either, although many here belived that.
Look for comments from Francois here.
Or there:
https://wattsupwiththat.com/2019/06/29/frances-new-hottest-recorded-temperature-ever-is-in-question-guess-where-it-was-measured/#comment-2735165
Sorry, but I don’t get it : you are refering to some comments which have been debunked : the station is not situated on the roof of a building, it is out in the middle of nowhere and, by the way, a station situated ten km away recorded a temperature slightly higher on that very day (46°, at Vérargues, Hérault, population 776, so it would be difficult to argue about an urban island heat effect) then again, a record high was registered in Paris a month later (42.6°), a bit higher than the previous one in 1947 (40.4°).
You could easily argue UHI effects for Vérargues when you see how close it is to surrounding villages/hamlets. The weather station cannot be far from at least a road and it looks like you can see one through the trees in the background when looking at the link you provided for the “record”
http://www.meteofrance.fr/actualites/74345599-c-est-officiel-on-a-atteint-les-46-c-en-france-en-juin
https://www.google.com/maps/place/34400+V%C3%A9rargues,+France/@43.7261195,4.101123,4520m/data=!3m1!1e3!4m5!3m4!1s0x12b69fd99025ac7f:0x6b7d139ec2f6fc0!8m2!3d43.716449!4d4.100409
Next structure (single Building 50m, next larger structure 120m (cementary) Hamlet 250m with lots of open water (cooling). Orchards with cooling effects around the station.
Road?!? Did you look at the raod you were rerferring to?
You must be joking or dreaming of weather stations where ther is nonting around for hundreds of meters. The station reflect the ordinary landscape in southern France as it is existing for several decades.
If the weather station in Lingen was located near a building, it would be interesting to know what face of the building (north, east, south, or west) it was located. Since the hottest part of a sunny summer day is usually early to mid-afternoon, if the weather station was located to the south or west of the building, in addition to direct sunlight, the building would have reflected sunlight toward the weather station and increased the temperature above the “correct” ambient temperature, which should be measured in the shade. A weather station to the north of the building (in the shade most of the day) would not have as much artificial warming from the building.
The weather station is to the east lof the building.
Next to that, weather stations provide shade to the thermometer and shall be well ventilated. But they shall not be placed in the shade.
Has anyone ever commented about the general location of the small local weather stations in Switzerland?
The vast majority that I have seen are all located right alongside tarred roads or concrete pavements, so that the data can be collected by Bluetooth (or another means of transmission) without the need for the people collecting the data to get out of their vehicles. The temperatures measured there in summer must surely be significantly higher now than when they were located in their original positions well away from paved roads and paths.
Concerning the 46.0 °C registered in France during July, beating by a little bit the highly questioned, but now official measurement of 45.9 °C in Gallargues-le-Montueux (Herault).
This 46.0 °C measurement was performed at the Meteo France weather station in Verargues (Herault).
The official description found in
https://donneespubliques.meteofrance.fr/?fond=contenu&id_contenu=37
is here:
https://drive.google.com/file/d/1oCRiDRevfWtMQk1gb3YAgMBp_JzUTXFL/view
Exact lat/long position of the station: 43.72124 N 4.09666 E
Maps:
https://www.google.de/maps/place/43%C2%B043'16.5%22N+4%C2%B005'48.0%22E/@43.721271,4.0920882,931m/data=!3m1!1e3!4m5!3m4!1s0x0:0x0!8m2!3d43.72124!4d4.09666?hl=en
As Francois accurately explained, the station is ‘in the middle of nowhere’.
Please stop your endless storytelling nonsense about roofs, concrete or asphalt.
It gets a bit boring inbetween.
Rgds
J.-P. D.
Full Acknowledge.