
Guest Post from Jim Steele
From What’s Natural? Column
published in Pacifica Tribune June 26, 2019
I was recently asked if the record June 2019 heat in the San Francisco Bay Area validated CO2 driven climate models. Surprisingly climate scientists have now demonstrated the heat wave was largely due to an intrusion of record cold air into the Pacific Northwest. How?
Basically, the winds’ direction controls the San Francisco Bay Area’s weather. In summer, California’s inland regions heat faster than the ocean, so the winds blow inland from the cooler ocean. Those onshore winds bring cooling fog, our natural air conditioner. Later, as the sun retreats southward in the fall, the land cools faster than the ocean. Seasonal winds then reverse and blow from the cooling land out to sea. Those winds keep the fog offshore. Without fog, San Franciscans finally enjoy pleasantly warm days in September and October. In northern California those strong offshore winds are called the Diablo winds. Although Diablo winds bring welcome warmth, those winds also increase wildfire danger.
Typically, inland California heats up in June drawing in the fog. But that temporarily changed when a surge of record cold air briefly entered Washington state and then moved down into northeastern California and Nevada. Dr. Cliff Mass, a climate scientist at the University of Washington, studies the Diablo winds. On his popular weather blog, he discussed how that intruding cold air created an unseasonal burst of Diablo winds that then kept the fog offshore. Without cooling fog, solar heating increased temperatures dramatically. According to Accuweather, San Francisco’s maximum temperature on Friday June 7th was 67 °F, skyrocketed to a record 97 °F by Monday and then fell to 61 °F three days later as onshore winds returned.
Such rapid temperature change is never caused by a slowly changing greenhouse effect. Nevertheless, the media asks if rising CO2 concentrations could have contributed to the higher temperatures or made the heatwave more likely?
Although definitions vary, the World Meteorological Organization defines a heat wave as 5 or more consecutive days of prolonged heat in which daily maximum temperatures are 9+ °F higher than average. Assuming the rise in CO2 concentration increased all temperatures relative to the 20th century average, it is believed maximum temperatures are more likely to exceed that 9 °F threshold. But heatwaves are not caused by increasing greenhouse gases.
The science is solid that greenhouse gases can intercept escaping heat and re-direct a portion of that heat back to earth. That downward directed heat reduces how quickly the earth cools, and thus the earth warms. However, heat waves typically occur when greenhouse gas concentrations are greatly reduced. Eighty percent or more of our greenhouse effect is caused not by CO2, but by water vapor. Satellite data shows the dry conditions that accompany a heat wave actually reduce the greenhouse effect because drier air allows more infrared heat to escape back to space. However, like less fog, less water vapor and less clouds allow more solar heating. So despite the increase in escaping heat, increased solar heating dominates the weather and temperatures rise.
The important contribution of dryness to heat waves helps explain why the USA experienced its worst heat waves during the 1930s Dust Bowl years (see EPA Heatwave Index above). Furthermore, the EPA’s heat wave index appears totally independent of rising CO2 concentrations. Dryness also helps to explain why the hottest air temperature ever recorded anywhere in the world happened over a century ago in Death Valley on July 10, 1913; a time of much lower CO2 concentrations.
To summarize, an intrusion of record cold air into the Pacific Northwest generated unseasonal Diablo winds in northern California. Those offshore winds prevented the fog from reaching and cooling the land. In addition, because the Diablo winds are abnormally dry, solar heating of the land increased. Those combined effects caused temperatures to temporarily jump by 30 °F.
Lastly, not only can Diablo winds cause heatwaves, Diablo winds will fan small fires into huge devastating infernos such as the one that destroyed Paradise, California. Fortunately, there were few wildfire ignitions during this heat wave. To be safe, Pacific Gas and Electric had shut off electricity to areas predicted to have high wind speeds. So Dr. Mass mused, that because colder temperatures generate the destructive Diablo winds, climate warming may have some benefits.
Jim Steele is retired director of the Sierra Nevada Field Campus, SFSU
and authored Landscapes and Cycles: An Environmentalist’s Journey to Climate Skepticism
Yes Natures air conditioning, where the FOG is the result of moisture being stripped from the air, leaving the RH low. Low RH air has less heat capacity than air with higher RH levels. With less heat capacity, the temperature heats up faster. Thus the wonderfully dry sunny summers in Northern CA. So, cold air from the cold ocean conditions the air, by precipitating moisture out, (seen as fog). The fog also cleans the air… or said another way, the water droplets in the fog gather particles in the air which end up clumping and falling down as dust. So cleaner drier air and nice climate where I live 10 miles from the Bay warm dry summer days and cool summer evenings.
So there you go, Global Cooling causes heatwaves. So do reduced levels of Carbon Dioxide. Who would have credited it.
Good science at last but who’s going to broadcast that? Not Al Gore, that’s for sure.
“Global Cooling”? You haven’t been paying attention have you John.
Surely this is the wrong way round! We have been told that Global Warming is causing the colder winters, and I, for one, do not dare doubt it.
“The science is solid that greenhouse gases can intercept escaping heat and re-direct a portion of that heat back to earth.”
Is there more heat for CO2 to reflect in the daytime or in the nighttime? Daytime, obviously.
So, should the CO2 heating signature be most evident in the daytime or in the nighttime? Daytime, obviously.
So why is the measured temperature change that is blamed on CO2 predominantly seen in nighttime temperatures in some of the coldest places on earth?
Hi Ktm! “The science is solid that greenhouse gases can intercept escaping heat” is correct. But “re-direct a portion of that heat back to earth” is not.
To understand this, consider that at resonant CO2 frequencies around 667 cm^-1, complete saturation occurs within metres or hundreds of metres from the Earth’s surface. Because the temperature profile (lapse rate) of the troposphere shows a drop in temperature from 288 K (15 Celsius) at the surface to 220 K (-53 Celsius) at 10 km (the tropopause), the change is 68 K over 10 km, or 6.8 K per km. This means only 0.68 K change over 100 m. So the back-radiation from CO2 at 667 cm^-1 near the Earth’s surface will be essentially the same as that emitted upward by the 288 K solid or liquid surface of the Earth.
So for every W/m^2 at 667 cm^-1 emitted from the 288 K Earth’s surface, there will be 1 W/m^2 emitted as back-radiation, and another 1 W/m^2 emitted upward toward outer space, for a total of 2 W/m^2 emitted by CO2 molecules in the first 100 m. This seems to violate the Law of Conservation of Total Energy.
Here’s what is really happening: at thermal equilibrium, two emitting surfaces will exchange photons back and forth, but there will be no NET change in temperature. All the energy balance diagrams (e.g. Trenberth’s) showing back-radiation warming the Earth’s surface are WRONG, except when there is a temperature inversion (for example, during the long Polar winters, the Earth’s surface loses energy via IR photons emitted to space faster than the first few hundred metres of the troposphere, so net energy can flow from the troposphere to the surface, reducing the rate of heat loss from the surface).
The mechanism for the greenhouse effect in the literature is also basically wrong. A 288 K Earth’s surface emits IR radiation according to the Stefan-Boltzmann Law. CO2 molecules in the ground vibrational state (with vibrational quantum number v=0) efficiently absorb 667 cm^-1 photons, and are boosted to the v=1 first vibrational state. Those v=1 excited state molecules can then re-emit 667 cm^-1 IR photons. as they drop back down to the v=0 ground state. However, the v=1 excited state molecules can also LOSE their energy of excitation during non-radiative collisions with N2 and O2 molecules of the atmosphere, which outnumber CO2 molecules by 1,000,000:400 = 2500:1 for 400 ppmv CO2. Since there are about 10^10 collisions per second for molecules at atmospheric pressure and 288 K, almost all of the extra absorbed energy by CO2 during the daytime is transferred to non-emitting N2 and O2 molecules, and the troposphere warms up. The heat capacity at constant pressure, Cp, for linear molecules like CO2, N2 and O2 is 7k/2 per molecule, or 7R/2 per mole, where k = Boltzmann’s constant and R = Ideal Gas constant, so about 2500 times more energy is stored in N2 and O2 molecules than in CO2 molecules during the warming daytime.
N2 and O2 don’t emit or absorb IR photons because they are non-polar molecules with zero changing electric dipole moment, and dipole radiation is the most important mechanism for photon exchange. Because CO2 is a linear molecule, it too is non-polar, but during bond-bending vibration at 667 cm^-1, there is a changing electric dipole moment perpendicular to the O=C=O axis, explaining its power to absorb and emit IR photons.
v=1 excited CO2 molecules can also be formed by collision of v=0 ground state CO2 molecules during energetic collisions with N2 and O2 molecules. At 288 K, about 3% of CO2 molecules are in the v=1 excited state at equilibrium. So the back-radiation at 667 cm^-1 observed by spectrometers looking upward from the Earth’s surface is real and cannot be denied, but simply indicates thermal equilibrium.
During nighttime, there is no incoming Solar visible radiation, but IR emission from the Earth’s surface to outer space continues, and the temperature drops. However, the heat stored during the daytime in the troposphere (mostly in N2 and O2 molecules which have gained in translational and rotational kinetic energy) can now be transferred back to the cooling surface via IR photons emitted from CO2 (and water vapor) in the downward direction.
This is an example of LeChatelier’s Principle: if a stress is applied to a system at equilibrium, the equilibrium shifts in such a direction as to partially relieve that stress. The stress is a decreasing surface temperature of the Earth, which means less IR emitted upward to be absorbed by CO2. But the IR emitted as back-radiation from CO2 partially compensates for that decreasing surface temperature, by reducing the rate of temperature drop. This will decrease the % of v=1 excited state CO2 molecules in the troposphere, but collisions between v=0 ground state molecules and warm N2 and O2 molecules will create some more v=1 excited state CO2 molecules. But the relief is only partial, so overall the temperature of the troposphere also falls slightly at nighttime, and the % of CO2 molecules in the v=1 excited state is decreased relative to the % peak in the daytime.
During Polar winters, when nighttime lasts for weeks or months, the rate of loss of IR energy from the surface to outer space can be so great that it cannot be balanced by back-radiation from CO2 (and water vapor back-radiation is weak during Polar winters or over desert areas). Heat transfer by conduction from gases is poor, and convection can transfer heat upward, but not downward. So a temperature inversion can form over the first several hundred metres. Then there can be net heat flow via radiation from a warm troposphere to a cooler Earth’s surface, but because heat loss via radiation from the surface to outer space is so great, the surface temperature continues to drop, not increase.
So now we can see what happens during the daytime: with no temperature inversion, there is a continually decreasing temperature with increasing altitude. So the IR back-radiation from CO2 cannot be greater than the surface emission at 667 cm^-1, or even be equal to it. So back-radiation does not warm the Earth’s surface, even though it does exist, and is close to the equilibrium value for an isothermal troposphere (at constant temperature).
As for the Law of Conservation of Energy, each W/m^2 at 667 cm^-1 of daytime back-radiation is essentially balanced or powered by 1 W/m^2 emitted from the Earth’s surface at the same temperature; this is what is meant by thermal equilibrium, with no net change in either surface or CO2. Each W/m^2 at 667 cm^-1 in the UPWARD direction from CO2 near the Earth’s surface is powered by ANOTHER 1 W/m^2 emitted from the Earth’s surface, and ultimately THIS is powered by incoming Solar visible radiation which passes through a transparent atmosphere and is absorbed by the Earth’s surface. 1 W/m^2 upward is balanced by 1 W/m^2 incoming Solar visible radiation, so Conservation of Energy is not violated.
The dry adiabatic lapse rate of -9.8 K/km can be derived from equating the increase in gravitational potential energy U = mgh for a molecule of mass m with the drop in enthalpy (heat content) H = CpT = 7kT/2 for diatomic molecules N2 and O2. I.e. from dU/dh = – dH/dh = -(dH/dT)(dT/dh) , where we have used the Chain Rule for derivatives. “Adiabatic” means no injection or withdrawal of heat as molecules move up or down, and “dry” means ignoring water vapour (which has a smaller mass than N2 or O2, and a slightly different Cp).
Since greenhouse gases (including CO2 and water vapour) absorb about 32% of the IR emitted from a 288 K Earth’s surface, and transfer the energy to non-emitting N2 and O2 molecules (see the MODTRAN spectrum at https://en.wikipedia.org/wiki/Radiative_forcing ), the rate of temperature drop with altitude is moderated by about 32%, or 0.32(9.8 K/km) = 3.1 K/km. Therefore the actual lapse rate should be about -9.8 + 3.1 = -6.7 K/km, close enough to -6.8 K/km that we can claim to have explained the observed lapse rate. This assumes that each molecule in the troposphere gets, on average, an equal share of any net absorbed energy, regardless of altitude or latitude, in keeping with Statistical Mechanics and the Law of Equipartition of Energy.
I trust this answers your valid questions.
Nice response, Roger. I have a small issue with your statement that Trenberth type balances are “wrong”. Maybe “easily misinterpreted”? Because, how else can you show, on a fairly elementary graphic, that the (-Tsky^4) term in the SB equation Q= C ( Tground^4 – Tsky^4) ? If you just show the net 66 watts IR from ground, many people will use SB to calculate incorrect temperatures, then claim the numbers are “wrong”, having failed to understand that “Tsky” is the result of greenhouse gases in our otherwise IR transparent atmosphere.
Hi DMacKenzie! The fundamental error in your equation for Q is that the sky does not radiate like a Planck black body (its spectrum is not a smooth Planck curve). Greenhouse gases do radiate with intensities equal to that of a Planck curve at their resonant frequencies IF THE LINES ARE SATURATED (i.e. are totally absorbed and then totally emitted according to Kirchhoff’s Law that a good absorber is a good emitter). So, for example the intensity of 667 cm^-1 back-radiation matches that of a 288 K Planck black body, within about 0.68 degrees.
But other frequencies, especially those in the “window” from 800 to 1000 cm^-1, show next-to-zero back-radiation. This does not mean that the atmosphere is near absolute zero in temperature!
As I wrote, the 667 cm^-1 back-radiation is basically powered by an equal amount of W/m^2 emitted from the 288 K Earth’s surface which DOES emit a near-perfect Planck black body spectrum (emissivity is generally given as 0.98). So if x W/m^2 emitted by the 288 K Earth’s surface is absorbed by CO2 at 667 cm^-1 and then CO2 re-emits x W/m^2 back to the surface, there is no net change in the Earth’s temperature due to the back-radiation.
There is a net absorption by CO2 in the 10 km of the troposphere, however, because the temperature drops 9.8 K per km adiabatically (heat is energy transferred from hot to cold). Most of the energy absorbed by CO2 is transferred via inelastic collisions to non-radiating N2 and O2 molecules that outnumber CO2 by 2500:1. Together with water vapour, CO2 reduces the temperature drop to 6.8 K per km; this is the atmospheric greenhouse effect.
According to the MODTRAN spectrum at https://en.wikipedia.org/wiki/Radiative_forcing , at 300 ppmv CO2 the TOA outgoing flux is 260.12 W/m^2. Plugging this into the Stefan-Boltzmann Law for emissivity 1 yields a temperature of 260.25 K (-12.9 Celsius), which simply means that a 260.25 K perfect Planck black body emits 260.23 W/m^2 . It does NOT mean that IR photons escape from the Earth’s atmosphere at around 4.1 km (where due to the -6.8 K/km lapse rate the temperature is -12.9 Celsius). The reason is that the troposphere is not a Planck black body, so applying the Stefan-Boltzmann Law to it is simply non-physical. It’s obvious, if you look at the TOA spectrum calculated by the MODTRAN computer program which closely matches satellite spectra (for example, the one shown in the 3rd Fig at http://climateaudit.org/?p=2572). The ragged spectrum is nowhere near that of a smooth Planck black body (although the total area under the spectrum exactly matches that of a 260.25 K Planck black body – because we equated the two in using the Stefan-Boltzmann Law).
Note that the 260.12 W/m^2 is a whopping 20 W/m^2 above the 240 W/m^2 usually used to balance energy flow. The reason is that the computer spectrum is necessarily calculated for a cloudless sky. For an Earth 62% covered with clouds, the TOA flux from clouded areas of the Earth must be 228 W/m^2 [Check: 0.62(228) + 0.38(260) = 240 W/m^2]. It also means that the computer calculations of climate sensitivity based on cloudless sky are too high because the tops of the clouds are cooler than 288 K, emitting a smaller initial Stefan-Boltzmann flux, because the path length to the TOA is smaller than 10 km, meaning fewer absorbing CO2 molecules, and because the extra absorption on doubling CO2 is due to v=1 excited state molecules whose % decreases exponentially as temperatures drop in the upper troposphere (the v=0 lines are basically completely saturated). The tiny area difference between the green and blue computed MODTRAN spectra at https://en.wikipedia.org/wiki/Radiative_forcing occurs due to sidebands centered at 618 and 721 cm^-1 where the absorbing molecules are initially in the v=1 excited state.
Using a TOA flux of 240 W/m^2 and emissivity=1 in the Stefan-Boltzmann Law yields a temperature of 255 K. The difference between this and 288 K is 33 K, widely touted as the quantitative measure of the greenhouse effect. However, this does NOT mean that IR photons escape to outer space at 4.9 km (where the temperature is 255 K) because, again, the atmosphere is not a Planck black body (the TOA spectrum is nowhere near Planck in shape, even if we include clouded areas). The 33 K estimate is also wrong because it assumes that the albedo (which includes cloud cover) remains unchanged; since the main greenhouse gas is water vapour, if there were no greenhouse gases there would also be no clouds, oceans or life forms including vegetation, and the albedo would be close to that of the Moon.
The bottom line is that (Tsky)^4 is a non-physical calculation which shows lack of physical insight into the mechanism of the greenhouse effect (this is not meant as a personal attack, just a comment on the literature). Hope this helps (your initial comments were right on the mark).
Roger Taguchi says: The heat capacity at constant pressure, Cp, for linear molecules like CO2, N2 and O2 is 7k/2 per molecule, or 7R/2 per mole, where k = Boltzmann’s constant and R = Ideal Gas constant, so about 2500 times more energy is stored in N2 and O2 molecules than in CO2 molecules during the warming daytime.
The Cp of CO2 and dry air are both known. The specific heat tables do not have a statement that say must be augmented by forcing equation if IR involved. Thermodynamics says the energy can be of any form to raise temperature. Until specific heat tables change and thermodynamics is changed your explanation, however sensible does not explain Anthony’s CO2 experiment failure to show temperature increase with increase in CO2.
Hi mkelly! Yes, specific heat tables are accurate (Cp for CO2 is slightly higher than 7k/2 because 3% of the molecules at 288 K are in the v=1 first vibrationally excited state, and 7k/2 assumes zero contribution to specific heat due to vibrational energy).
However, the connection you are thinking of is deltaH = Cp.deltaT . Net absorbed energy (heat) increases enthalpy (heat content), H, so a non-zero deltaH means a non-zero deltaT . Therefore computer MODTRAN or HITRAN calculations showing a non-zero increased absorption on doubling CO2 mean non-zero deltaH and non-zero deltaT.
Hallo, Roger .
Let’s take a little more detail with heat capacities. See the reference values of the molar heat capacities of certain gases at constant pressure (in J/ (mol K)): N2 29.1, O2 29.2, CO2 36.8, CH4 39.8, N2O 24.2, H2O (vapour) 33.5. Doesn’t it seem strange to you that the heat capacity of water vapor (molecules are highly polar) is less than that of nonpolar methane, and that of nitrous oxide (greenhouse gas) is less than that of nitrogen and oxygen?
Recall another well-known fact. All substances, including air, absorb heat by themselves, regardless of the presence of impurities that absorb infrared radiation. Is it worth it to talk about the transfer of energy from CO2 molecules to nitrogen and oxygen molecules, as you did in the post of 11:45 a.m.?
Can the vibrational energy of CO2 molecules be converted into kinetic energy of translational motion and, moreover, transferred to other molecules? It is doubtful and at least not proven.
Is it worth mentioning mathematical models if the physical justification of the greenhouse effect is doubtful?
In reply to aleks who posted at 3:40 pm:
The values of Cp for N2 and O2 you posted are consistent with 7R/2 per mole or 7k/2 per molecule (using R = 8.31 J/(K.mol).
H2O has a higher value of Cp because it is non-linear, and so has 3 degrees of rotational freedom instead of 2, so its value of Cp=4R = 33.2 not counting any contribution from vibration. Its polarity means it can absorb and emit IR radiation, but this is irrelevant for its heat capacity.
CO2 , though linear, has Cp higher than that of N2 and O2 because its vibrational energy levels are so close together that a significant number of molecules are in higher vibrational states. This means as temperature increases, more and more energy can be stored in vibration as well as rotation and translation, so its value of Cp should increase with temperature (check measured values to see that this is so).
Methane (CH4) is non-polar, but also non-linear (its 5 atoms form a tetrahedron with carbon at the centre). So it has 3 rotational degrees of freedom. Values of Cp slightly higher than 4R would indicate some energy stored in some weaker vibrations.
The value of Cp you quote for nitrous oxide (N2O) does not match 2 separate values I have found in the literature (24.2 is too low, and so I cannot justify it theoretically).
Yes, it is true that all substances can absorb heat via conduction and convection, in addition to radiation. But gases are poor conductors of heat (so double or triple glazed windows are used for insulation in cold climates like Canada). Convection can transport heat more efficiently than radiation in the troposphere, but energy balance with incoming Solar radiation can only be achieved by radiation of IR to outer space; convection requires currents in material mediums and is irrelevant for the upper atmosphere and outer space.
You are wrong about energy transfer between molecules. 50 years ago I was a grad student at the University of Toronto under Prof. John Polanyi who deservedly won the 1986 Nobel Prize for Chemistry for his work on infrared (IR) chemiluminescence. His work had to consider quenching of excited states of molecules by inelastic collisions to rotational and translational energy of background molecules. I thought up, executed and wrote up a short experiment in which electronically excited mercury atoms, Hg*, were quenched by hydrogen fluoride (HF) molecules which were boosted to upper vibrational states which were detected by their emission of IR radiation as they fell down to lower vibrational states. My thesis was supposed to show the quenching of electronically excited sodium atoms, Na*, with carbon monoxide molecules (CO); IR emission in the first overtone was detected from vibrationally excited states of CO, but the distribution of vibrational states was Boltzmann, showing that the initial states had been degraded by energy transfer from excited vibrational states during inelastic collisions with ambient molecules (argon was a carrier gas in a flow tube). The distribution of observed vibrationally excited HF molecules in the experiment with mercury was highly non-Boltzmann, so I argued that it was close to the initial distribution of molecules formed in the elementary reaction: Hg* + HF = Hg + HF’ , where HF’ represents a vibrationally excited molecule, Hg* a mercury atom in the 6 triplet P state, and Hg a mercury atom in the 6 singlet S ground electronic state.
A significant fraction of radiation wattage comes from the atmosphere, as opposed to directly from the Sun. If wattage from the atmosphere increases, temperatures will be increased, but a majority of that increase will be in the winter and at night.
I originally started to develope this issue when I read some posting purporting to prove the Stefan-Boltzmann law “wrong” based on lunar temperatures. You might find this link, regarding Newton’s law of cooling, of interest.
http://www.ugrad.math.ubc.ca/coursedoc/math100/notes/diffeqs/cool.html
The law gives this equation:
T(t) = Ta + (T0 -Ta)*1/(e^kt)
Where T(t) gives Temperature, T, as a function of time, t,
Ta is ambient background temperature, and T0 is the starting temperature of the body warming up or cooling off.
mass atmosphere = 5* 10^18 kg=5*10^21gm
temp atmosphere 255K (effective radiating temp to space- underestimates heat content of total atmosphere)
specific heat 1.01 joules/gm C
5* 10^21*1.01*255= 1.288 * 10^24 joules
radius earth = 6400km= 6.4*10^6 meters.
area earth = 4 pi r^2 =514,718,540,364,021.76
240 watts/sq meter = 240 joules/sec per square meter
60 sec/min*60 min/hr*24hr/day=86,400 secs per day
5.147* 10^14 sq meters*240 joules/sec/sq meter *8.64*10^4 secs/day= 1.067*10^22 joules per day radiated away
1.067*10^22/1.288*10^24 = 0.83%
So the daily loss of heat of the atmosphere is less than 1% per day. That makes sense when you realized that although surface
temperatures may swing by 20 degrees K or more during the 24 hour day/night cycle, meteorologists are still able to make fairly accurate estimates of daily highs and lows for about a week- because of that temperature stability. Since the temperature for most of the atmosphere remais about the same throughout a 24 hour day, we continue to get the
same daytime radiation from the sun, but the radiation from the atmosphere increases by the same amount both day and night. Since temperature is proportional to the fourth ROOT of radiation, that implies more warming at night than during the day from additional greenhouse warming.
“That makes sense when you realized that although surface temperatures may swing by 20 degrees K or more during the 24 hour day/night cycle, meteorologists are still able to make fairly accurate estimates of daily highs and lows for about a week … ”
Please will you advise the Australian BOM because from where I sit, they can’t get within 2C at any time, always warmer than what the online forecasters are showing.
Clouds at nightime can make a difference of up to 11C warmer, which far outweighs any back radiation from H2O or CO2. In fact scientists can’t measure the back radiation from CO2 only at night in a desert like Atacama, Chile which is the 2nd most arid place on earth only beaten by an off the trail hidden valley in West Antarctica.
Email a copy of this to every High School in California.
Simple, succinct, relevant, free of propaganda.
Just what is needed to educate children about science.
In three days, another stratospheric intrusion with cold air from the north will occur over California.
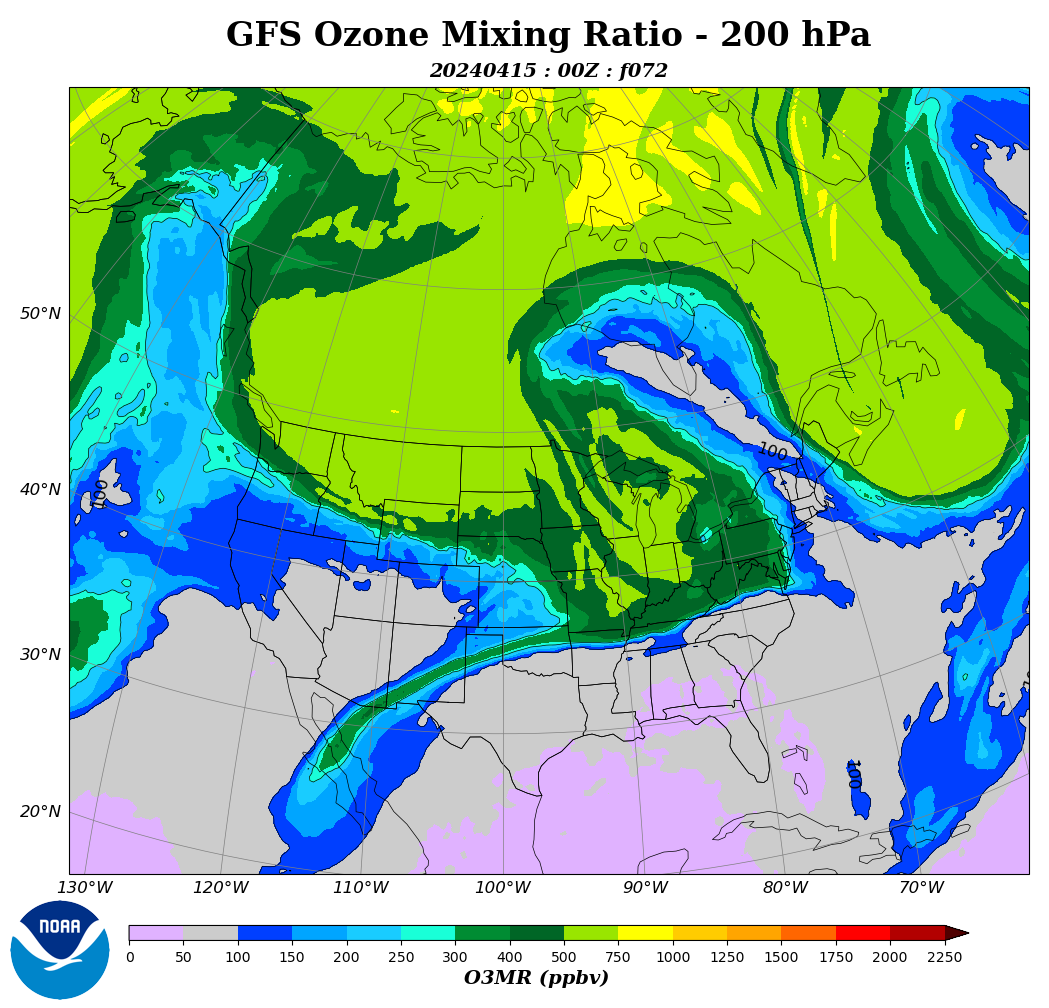
https://www.cpc.ncep.noaa.gov/products/stratosphere/strat_int/
“The science is solid that greenhouse gases can intercept escaping heat…”
If by ‘solid’ you mean ‘flexible depending on the grant money on offer’ then I completely accept this statement.
If you are using solid in any other context I believe you are utterly wrong. ‘Greenhouse Gases’ are a wonder substance that do wonderful things and are so magical that they defy computer modelling purely by their utter magical nature.
If the science was solid the observations would match the models.
The observations do NOT match the models.
Ergo we do not fully understand how greenhouse gases work at all.
Craig, The models do not match observations because the models are over sensitive to greenhouse changes, do not adequately account for natural oscillations and do not accurately account for feedbacks. This article is aimed at laypeople to show them there are other reasons for warming other than CO2.
Greenhoue gas science is solid only in regards to the proven ability of greenhouse gases to absorb and emit certain wavelengths of energy.
When you say,
The science is solid that greenhouse gases can intercept escaping heat and re-direct a portion of that heat back to earth. That downward directed heat reduces how quickly the earth cools, and thus the earth warms.,
I keep thinking some perspective is missing, like the heating power of that back radiation is -80C, so it doesn’t add much of a “blanket” for slowing down cooling at surface 15C, does it?
Same as in Europe this week.
A wavy jet stream allows more extremes of hot and cold whilst increased cloudiness cools the system in the background.
The wavy jet stream being a product of low solar activity.
increased cloudiness cools the system in the background.
What we call the Great British Summer
Except when an active Sun occurs whilst the jet stream is loopy as hell. Come on Steven, why the hell do you continue this nonsense????
You will find that to be an exception rather than the rule.
Thank you for declaring the null hypothesis cannot be rejected. This means your premise can finally be laid to rest in the dust bin of other nutty ideas.
You wish.
Active gases in the mid to far infrared spectrum (CO2, WP, …) contribute to dissipate heat by radiative transfer from warmer to colder aeras, thus counteracting (even if weakly) any temperatures extrema.
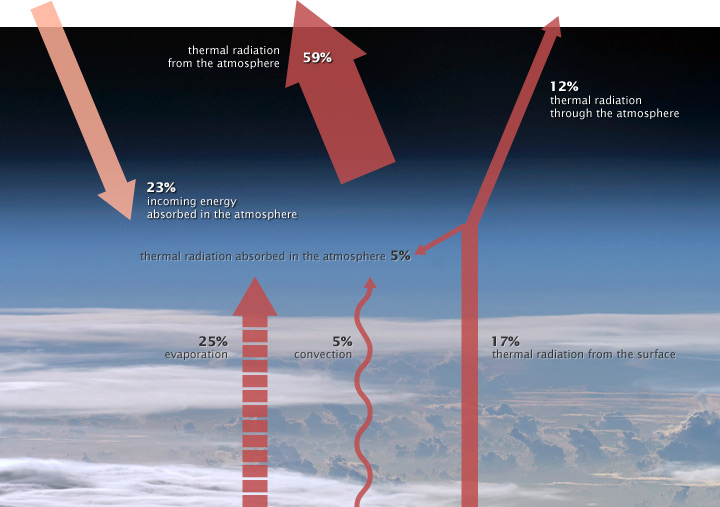
Those same gases contribute also to cool the atmosphere by radiating heat into space despite the fact that they absorb some heat from the upward infrared radiative flux emitted by the Earth’s surface (17W/m²) :
– this net radiative heat absorbed by the atmosphere is indeed much smaller than the heat radiated from the atmosphere into space in the infrared spectrum (170W/m²). CO2 and WP mainly contribute to this radiative heat transfer.
See for example, the mean Earth energy budget from NASA 2009 :
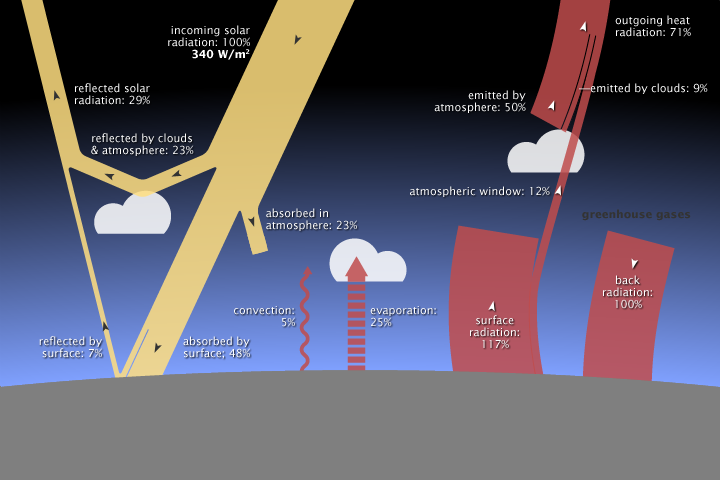
This perhaps contribute also to explain why the more we have “greenhouse” gases, the less we face heat waves.
This is interesting. Water is considered a GHG which warms the planet, yet here we have water vapour cooling California.
(Note : Here vapour is a mixture of vapor (gaseous) and liquid droplets.)
the deadliest heatwaves are the humid ones
As we have been experiencing lately here in Florida. But here is something you never see discussed very often. The current heat and lack of rain is being caused by dry air in the mid levels of the atmosphere thereby suppressing thunderstorm activity, which like San Fransisco’s fog is a natural air conditioning. So we have high temperatures and humidity at the surface but no thunderstorm development. We have had temperatures in the mid to high 90’s (F) but the heat index has been up around 107-110 F. As the mid level dry air moves out, thunderstorms will return to the normal summer pattern as what happened in some places late yesterday.
This thread is about surface weather phenomena but is drifting off into the effects of GHGs again so I’ll just say this:
Do anyone else realise that faster convection lowers the effective emission height whereas slower convection allows it to rise?
The effective emission height is set by the length of time it takes for a single cycle of convective overturning.
One can verify that by noting that if the convective overturning cycle were instantaneous the emission height would be at the surface as for radiation whereas if convection stopped completely it would be at the top of atmosphere as for a solid.
Therefore, everything turns on the speed of convection and nothing else.
So, back radiation adds energy to the surface which accelerates convection which reduces the effective emissions height which causes a planet to radiate from a lower warmer height which neutralises the surface warming effect of back radiation.
Neat, isn’t it ?
It follows that the denser an atmosphere and the more viscous it becomes, the slower convection runs, the higher and colder the effective emission height becomes and the hotter the surface becomes.
Hence Venus.
Stephen, does that mean as the lower atmosphere get more polluted the convection will slow down and it will get warmer?
Only to the extent that atmospheric mass is increased by the pollution. Otherwise average density does not increase. And note that particulates are heavier than air and will fall to the ground in due course.
I don’t think human production of pollution is going to do much to increase total atmospheric mass.
Stephen,
Interesting viewpoint that is never brought up. Makes one wonder of the cell sizes in the models are small enough to take this effect into full account.
Stephen, now you are getting there. This is exactly what Dr. William Gray stated long ago although he stated it more simply by just saying that much of the extra energy produced by the GHE goes into enhanced convection and is therefore unavailable to produce heat. Basic conservation of energy.
https://tropical.colostate.edu/media/sites/111/2018/01/Bill-Gray-Climate-Change.pdf
Dr Gray relies on changes in the rate of evaporation whereas I say it works even in a dry atmosphere.
He doesn’t deal with the downward leg of convection either.
Most of his paper repeats the basic contentions of my Hot Water Bottle Effect hypothesis of several years previously.
Interesting.
Now where is the article on the stalled Jetstream creating a record June heatwave in Europe?
(something clearly caused by climate change)
that may be but CO2 has nothing to do with it …
Absolutely caused by climate change. After all, the jet stream never stalled until CO2 levels hit 380 ppm /sarc.
‘(something clearly caused by climate change)’
Why ?
Griff
Have the rivers dried up like they did in the 1300s and 1500s? If they do then you might have some records.
So it isn’t an increase in the greatest Greenhouse Gas (by volume) but rather a decrease in greenhouse gas concentration that causes an increase in temperatures??
griff, the number of heatwaves has decreased. Is that what you meant by “climate change”?
An informative and well written essay. I will make one comment regarding:
“So Dr. Mass mused, that because colder temperatures generate the destructive Diablo winds, climate warming may have some benefits.”
I see where you are going with that but it may be the case that climate warming increases the incursions of polar air thus potentially exacerbating Diablo winds. This is a hot topic of research and by no means settled.
“Eurasian cooling trend in the era of Arctic amplification can largely be explained by polar vortex variability…”
https://journals.ametsoc.org/doi/10.1175/BAMS-D-16-0259.1
I’m puzzled by that paper.
There is a west to east circumpolar jet in the troposphere but the stratosphere is quite different. The stratospheric polar vortex is a region of descending air from the mesosphere, down through the stratosphere to the lower stratosphere.
The author seems to have confused those two phenomena.
Apart from that error the paper is essentially covering the same ground as my old article published here:
http://joannenova.com.au/2015/01/is-the-sun-driving-ozone-and-changing-the-climate/
“Previous studies showed that a weak stratospheric polar vortex can lead to cold-air outbreaks in the midlatitudes, but the exact relationships and mechanisms are unclear.”
From this it follows that the state of the stratospheric winter polar whirl depends on what is happening in the stratosphere, not in the troposphere. Look at the graphics below. The stratosphere is dominated by UV and GCR (in the lower stratosphere in higts latitude).
http://ds.data.jma.go.jp/tcc/tcc/products/clisys/STRAT/gif/zu_sh.gif
http://ds.data.jma.go.jp/tcc/tcc/products/clisys/STRAT/gif/zt_sh.gif
Some interesting info to eyeball at this link:
https://www.currentresults.com/Yearly-Weather/USA/CA/San-Francisco/extreme-annual-san-francisco-high-temperature.php
Scroll down and check out some other San Francisco record highs for June, e.g. 95F on June 29, 1934 and June 21, 1929.
Lovely weather in the East Bay those days this year.
“The science is solid that greenhouse gases can intercept escaping heat and re-direct a portion of that heat back to earth. That downward directed heat reduces how quickly the earth cools, and thus the earth warms. ”
Another blogger who doesn’t understand the definition of heat.
Heat is defined as a spontaneous flow of energy from one object to another, caused by a difference in temperature between two objects. Heat is not a property of an object and the cooler atmosphere cannot raise the temperature or slow down the release of heat from the earth’s surface. There is no observational evidence that this can happen and it was not until Feldman et al (2015) that anyone tried to measure anthropogenic CO2 forcing.
The Stefan-Boltzmann equation defines the radiating power of an object to a sink at zero degrees Kelvin and is not about back radiation or other exterior influences that can magically affect that radiating power.
“Eurasian cooling trend in the era of Arctic amplification can largely be explained by polar vortex variability…”
https://journals.ametsoc.org/doi/10.1175/BAMS-D-16-0259.1
Cool Loydo – a conclusion-based conclusion. What could possibly go wrong doing science that way?
Anyone with a penchant for data crunching and solar gain might look to the temperatures in and around SF Bay for the weeks before and during the devastating Paradise fires last season. With the exception of the day the fire started the weather pattern was exceptionally stable throughout, but the quantity of smoke dramatically lowered temperatures across the bay for days after.
“The science is solid that greenhouse gases can intercept escaping heat and re-direct a portion of that heat back to earth.”
There are three basic arguments in the great climate change/global warming debate.
What it does.
Bickering over the alleged global warming symptoms allegedly caused by mankind’s evil carbon dioxide, i.e. melting ice caps and glaciers, rising sea levels, extreme weather and a plethora of other apocalyptic hallucinations. Refuting these speculative, baseless, fact-free fears with actual observed data proving natural variations fails since these delusions are nothing more than articles of faith, voices in heads and monsters under beds.
How it works.
Unsettled quasi-scientific bickering over details about the mechanism behind the undeniable Radiative GreenHouse Effect, i.e. 1. the atmosphere warms the earth, 2. warming produced by an upwelling/downwelling/”back” perpetual and divinely balanced GHG LWIR energy loop, 3. which is powered by a calculated theoretical “what if” ideal S-B BB LWIR energy upwelling from the surface. Entire RGHE theory is nothing but thermodynamic rubbish!!!
Does it even exist.
Whether the greenhouse effect is even real. By reflecting 30% of the incoming solar radiation the atmosphere actually cools the earth much like that reflective panel behind a car’s windshield. Without an atmosphere the earth would receive 25% to 40% more kJ/h and get warmer becoming much like the barren lunar surface, blazing hot lit side, deep cold dark side, a total refutation of RGHE theory which claims just the opposite.
No greenhouse effect, no greenhouse gases, no man caused climate change or global warming.
“Unsettled quasi-scientific bickering over details about the mechanism behind the “undeniable Radiative GreenHouse Effect”
The article and comments have been very entertaining. It provides comic relief whenever people start flexing their mathematical abilities to demonstrate who has the greater understanding of a terrestrial system that is far too complex to be represented by a few lines of mathematical symbols. I am not trying to say that mathematics is not an important component in the debate. And I hope those who have put a lot of thought and effort into this keep doing so.
Because the alarmists are constantly trying to impress politicians and the public with their mastery of mathematics and computer modelling; it is very important to be able to demonstrate the flaws in their constructs. But trying to show who has superior insight using similar tactics results almost entirely in endless nearly meaningless debate. And the spectators are mostly unimpressed.
If we have glaciers on the outskirts of major cities 30 years from now… we will still have lefties blaming anthropogenic emissions and trying to exploit the situation for political gain.
I live on Whidbey Island, in the Pacific Northwest. I live in the middle of the blue area on the map in that other article talking about “record cold” in the area. I didn’t experience any of the record cold. Where I live it’s typically 10-15F cooler on sunny days than just 13 miles inland, due east, where I work. There was no record cold in either place that I encountered. Nothing was mentioned on the radio regarding record cold. It was pretty average, maybe slightly above. I still question the whole thing.
Thank you Jim and Cliff.
Oh Lord, where do I begin?
Best not to even start.
Is it true that one of the reasons Death Valley has the records for heat is because it is below sea level and hence has a slightly higher air pressure – on average? PV=nRT and all that.
An interesting case study would be to ask 1 million Americans to draw a graph like the EPA heat wave index graph above but have them decide where the spike is. Given the incessant propaganda and illiteracy of history in our country, I predict that 99.9% of the graphs would have the spike in the 21st Century.
For those who are knowledgeable about history, it would be a no brainer.
“The science is solid that greenhouse gases can intercept escaping heat and re-direct a portion of that heat back to earth. ”
The MODELS, not the SCIENCE, is solid.
There’s no such thing as a ‘greenhouse gas’. The mechanism proposed is pure conjecture.