Below is a plot from a resource we have not used before on WUWT, “RIMFROST“. It depicts the average temperatures for all weather stations in Antarctica. Note that there is some recent cooling in contrast to a steady warming since about 1959.
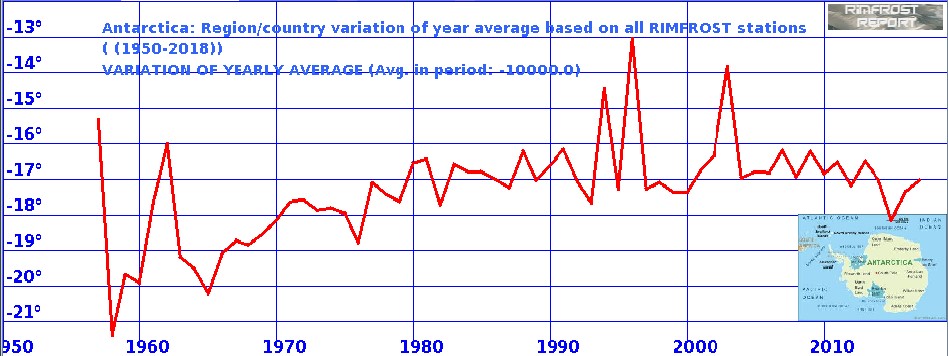
Data and plot provided by http://rimfrost.no
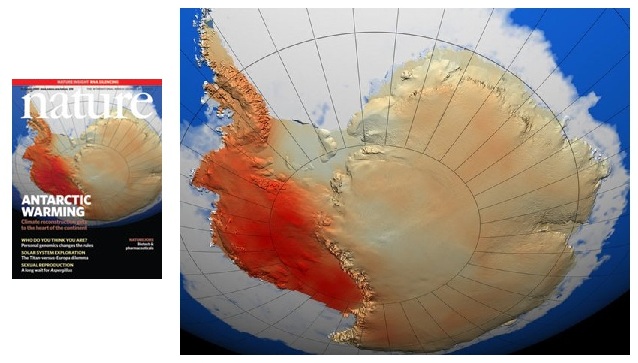
Contrast that with claims by Michael Mann, Eric Steig, and others who used statistical tricks to make Antarctica warm up. Fortunately, it wasn’t just falsified by climate skeptics, but rebutted in peer review too.
Data provided by http://rimfrost.no
H/T to Kjell Arne Høyvik on Twitter
ADDED:
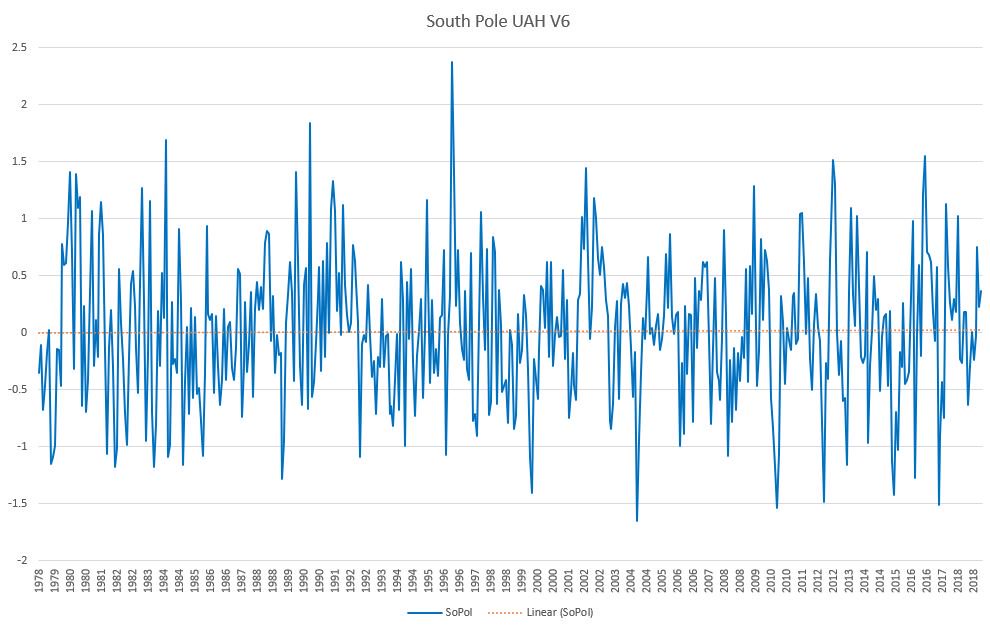
No warming has occurred on the South Pole from 1978 to 2019 according to satellite data (UAH V6). The linear trend is flat!
Currently, there is a significant anti-intellectualism of the formerly respected environmental and major media. Their credibility is shot and their politics is showing.
“I am skeptical about everyone in the whole wide world (including myself) and everything in that world, without 3 forms of trusted, independent verification.”
Anonymous Heins
Wonderful summation comment anonymous Stephen!
Plus 100+
Kindly specify if the verticle axis of the plot is in degrees Fahrenheit or Celsius.
UAH is in deg C. The other one, being Norwegian, will also be in deg. C though it is sloppy not to mark the axes on any graph ( unless you are a sociologist ).
However, the RIMFROST dataset is appropriately named since almost all of its stations are near the coastal rim of the continent, as we can tell by the fact that the mean in “only ” -18 deg. C. Also a disproportionate number are on the Antarctic peninsula which, as Jim Steele pointed out a couple of years ago, is heated by Foehm wind effects: basically being heated by surrounding sea temperatures and not at all relevant to the rest of the continent.
There is also no discussion of the changing number and distribution of stations between the beginning and end of the record. Just looking at the variability, I suspect there were far fewer stations around 1960.
This d18O proxy form Gomez Dome at the base of the peninsula.
source:
Liz Thomson et al 2009
Ice core evidence for significant 100-year regional warming on the Antarctic Peninsula
GEOPHYSICAL RESEARCH LETTERS, VOL. 36, L20704, doi:10.1029/2009GL040104,
2009
This RIMFROST dataset is NOT necessarily representative of the continent of Antarctica. The interior is much colder and IIRC shows cooling.
That Nature cover was nothing more than a cartoon.
What does this mean for the so called “arctic amplification” , where the poles are supposed to be warming more rapidly than the rest of the earth?
Or is there some magic that that happens only at the north pole?
Polar amplification (a better term) is somewhat valid but does not apply in the current situation. The Arctic warming is likely driven by the NAO/AMO and hence is not an example of polar amplification. When the AMO turns negative I fully expect to see the Arctic cool back down.
Polar amplification is where the the entire planet is warming and since heat is generally transported to the poles, which are smaller in area, they show a larger degree of warming. The fact Antarctica is not warming is indeed evidence contrary to AGW.
Heat is generally transported to the poles by water, at least in large quantity. The artic works very well in this regard. Antartica is the perfect geologic arrangement to give little care to what the rest of the planet is doing; a large landmass centered on the pole surrounded by ocean. If one wanted to find polar amplification they should be able to see it loud and clear in the north long before they could find a trace of it in the south.
The top of the water is warmer than the bottom so it is logical that the Arctic is warmer than the Antarctic.
Needed a sarc tag Rick!
The magic is that pretty much nobody is able to go to the poles to verify the claims.
No warming trend in Antarctica?
Cool!
For reference, this is HADCRUT4 70-90S:
Wow, lots of information crammed into that site. Interesting how much the temperature fluctuates over short periods of time in the Antarctic.
Suspiciously noisy ground based data…and not consistent with the satellite data (which is also noisy with frequent 2 to 3 degree changes in less than 24 months).
I suspect that the instability may be due to the very low amounts of liquid water (over most of the continent) as a moderating/limiting factor in the hydrological cycle.
Satellite data isn’t the best way to look at the poles. Because of geometry.
But weather stations on the ground are certainly more significant than computerised extrapolations across a continent from a peninsular.
What changed in 1980?
MC – what happened after 1980?
Atmospheric circulation changes due to a phase of I creased tropical convection, causing increased ozone dilution above Antarctica and increased volumes of cold surface atmosphere flowing off the continent creating conditions for increased sea ice.
The barriers to transport of tropical convection to the south pole strengthened causing more of that tropical heat to go to the Arctic which is the weaker pole. Arctic amplification is a natural phenomenon that results in warmer atmosphere and sea surface disturbance lowering sea ice and short periods of rapid surface melt on Greenland.
The cooling of Antarctica is the result of increased tropical convection.
Regards
Thank you, Martin Cropp. That sounds plausible.
Another thought in the same vein. It may be fruitful to discuss the Arctic/Antarctic variations in light of this article and that just forwarded by Willis re: ENSO. The polar seesaw has been observed for decades. If Willis is correct, periods of increased el ninos warm the northern hemisphere (especially oceans) but not the southern hemisphere. Would periods dominated by la ninas do the opposite, create the seesaw. I’m a firm believer in ocean control of the climate. As our knowledge increases slowly, and bit by bit, we may unravel some of the major events causing observed variations. If there are patterns, and if they persist, we may be better able to decipher why climate change occurs. Willis showed a short-term response to el nino (months), but with longer effect in ocean temps than land temps. The minor warming presently occurring, therefore, could relate to the number and timing of el nino/la nina events. May be worth some discussion.
Satellite data is not looking at the ground and it is not computerized extrapolations. It is looking at the atmosphere above the ground, pixel by pixel. It is saying there is no long-term atmospheric warming over the Antarctic.
RB, Satellites do look at the atmosphere.
But they also don’t cover the poles well or they fall out of the sky.
“Antarctica warming” is kind of like “oceans acidifying.”
From about 1958 to about 1990 Antarctica became, on average, a smidgen less brutally cold.
Like the oceans became, on average, a smidgen less caustic.
Which means the sky is falling.
A couple of years ago there was an article picked up by several news sources that record high temperatures were being recorded in the arctic. One news source described the temps as “freakishly warm” and “super hot.” The accompanying graph showed the temperatures were actually far below freezing. The graph was then quickly deleted from the article.
With the Antartica icecap at an average altitude of 8,200 feet, and with an average temperature of about -40 C or colder with 6 months of that in near darkness, it isn’t surprising there hasn’t been any warming and little effect on melting the southern continent that has been frozen over in an ice age for 34 million years. And with CO2 levels higher than now, including much higher average global temps for the majority of that time that didn’t see Antarctica melt since 34 MYA.
It is also probable as NASA has even published, that the southern icecap has been acquiring more annual snowfall than what ice melts, sublimates or slides into the sea as ice. This probably explains why there is no acceleration in SLR globally, as we know the temperature of the oceans is increasing slightly and thermally expanding, including some melting from Greenland and other terrestrial glaciers around different regions of the good Earth. If the general population were aware of these statistics, including no net warming in Antarctica the last 30-40 years, I think everyone would relax a little on any impending global climate emergency.
Beneath your feet at the South pole lie over 3000 metres (about 9800 feet) of ice, 4000 metres (13,123 feet) in parts, which rests not on the sea but on land. Antarctica is a frozen continent larger than Europe, larger even than the United States and Mexico combined. A massive icecap covers 98 percent of that land, swallowing a continent higher than any on Earth. The length of the polar winter night increases with latitude until at the pole itself, the sun sets just once a year. For a while after it disappears, the setting sun provides aglow above the horizon, and then leaves the polar world in complete darkness for half the year
The warmth the polar regions absorb in the summer is far less than the heat they lose in the winter. Only in November and December, the very height of the Antarctic summer, does the South pole actually gain heat. The Antarctic is much colder than the Arctic. The average winter temperature in the Antarctic is minus 60 degrees Celsius. Even on a good summer’s day it’s minus 30 degrees Celsius, colder than the coldest winter’s night at the North Pole. Antarctica is the highest continent on Earth, three times higher than any other.
There are larger waves, stronger winds, and more powerful currents in the Southern Ocean than anywhere else on the globe. Icebergs are a real threat to shipping. At times they show up on the radar screen as hundreds on tiny white dots, which in reality could be an iceberg which could easily sink the largest vessel. It is absolutely essential to keep a lookout posted around the clock, and many captains prefer to avoid travelling at night whenever there are lots of icebergs about. On land, cold air from the high continental plateau rushes down the gradient to the sea causing katabatic winds. These can reach over 300 kilometres an hour and add terrifying windchill to the already freezing conditions.
If you sail around Antarctica, you will see mainly white ice. Sometimes it towers over you as mighty ice shelves. Elsewhere great glaciers tumble into the ocean, calving off icebergs which make navigation very dangerous.
The above was written by Alistair Fothergill in his book ‘Life in the Freezer’, published in 1993 before the current climate change hysteria..
Fast forward to the present. Greenpeace on its website states that ‘… parts of the Antarctic are warming three times as fast as other parts of our planet. Scientists recently recorded its warmest day ever – a distinctly not-freezing 17.5°C’ and also that ‘Changing ocean temperatures are also important, because they warm the massive Antarctic glaciers from below, making them less stable.’
Quite how changing ocean temperatures are warming the Antarctic glaciers from below given that the Antarctic is a land mass below ten thousand feet or so of ice is not explained – but then, who needs explanations, the scary story is what counts. And where exactly was the claimed temperature of 17.5 degrees measured, and under what circumstances? The British Antarctic survey states; ‘Around the coasts of Antarctica, temperatures are generally close to freezing in the summer (December-February) months, or even slightly positive in the northern part of the Antarctic Peninsula. During winter, monthly mean temperatures at coastal stations are between -10°C and -30°C but temperatures may briefly rise towards freezing when winter storms bring warm air towards the Antarctic coast. Conditions on the high interior plateau are much colder as a result of its higher elevation, higher latitude and greater distance from the ocean. Here, summer temperatures struggle to get above -20°C and monthly means fall below -60°C in winter. Vostok station holds the record for the lowest ever temperature recorded on the surface of the Earth (-89.2°C).
Greenpeace also say that ‘ Glaciers form on the Antarctic landmass as snowfall compresses into ice over time, and they flow under their own weight towards the ocean – like a very slow river. But as these glaciers feel the heat of a warmer ocean underneath them, they speed up their slow march to the coast, causing big chunks of ice to break off into the sea as icebergs at a faster speed. The melting and break down of glaciers into the ocean raises sea levels all around the world. Antarctic glaciers are now losing ice faster than snow is falling to add new ice. The rate at which Antarctic ice sheets melt under increasing temperatures will affect coastal communities globally, whether living in small island states or mega-cities.’
Yet there have clearly always been plenty of icebergs in the Southern Ocean. Greenpeace are yet again telling us fairy stories (to put it politely).
Of course Antarctica is cooler; cold settles. Duh.
Makes sense. Also explains the Arctic getting warmer, heat rises. Someone should notify the UN.
Wait a minute, how can you call rising from -20 deg C to -16 deg C “slight warming”? The rest of the Earth only has 12 years left to live with + 1.5 deg C warming. Shirly, all of the polar bears and penguins died during this earth cooking + 4 deg C event? Well? Are there polar bears in Antarctica? No! Penguins? Still a few but we are regularly informed that they are dying wholesale. We’re doomed! And to double-down on stupid, my wife and I are about to leave for vacation in Hawaii (when we obviously should be going to Iceland). Sarcasm? Me?
Ron: I just checked and you should avoid Honolulu or you’ll surely be roasted. Honolulu has the highest average annual temperature of any major US city at over 24 C (anomaly of 9 C) that’s 6 times the 1.5 C increased temperature level that is going to result in environmental disaster. You couldn’t pay me enough to visit this hellhole. /s/
One explanatio for this lack of warming is probably that more CO2 in the atmosphere is actually expected to cause cooling in inland East Antarctica where there is a semi-permanent temperature inversion. Below are three IR spectra from Sahara, the Mediterranean and Antarctica. Notice that the radiation is actually slightly increased not decreased in the H2O and CO2 absorption bands:
Seas will not rise fast if Antarctica doesn’t warm up. That’s good news for the Maldives that according to top scientists 30 years ago should already be gone do to sea level rise.
Jared, these coral islands grow with sea level rise. They actually kept pace with much more rapid sea level rise with the melt back of the last glacial maximum. The sea rose ~ 120m and guesd what? When the US drilled Bikini Atoll (atomic bomb test site) in the 50s, they went through 120m of coral limestone and into volcanic rocks. A study done by NZ researchers using 1940s areal photos to compare with modern photos, they determined that most of the South Pacific islands had increased in area and stood the same elevation above sea level that they did before, despite continuous sea level rise. These things are alive!
‘aerial photos’ that is.
Perhaps consider adding this plot to the Reference Pages/Global Temperature Page.
Interesting.
Sarc on, panic now,as the POLE freezes,the sea ice will expand ever northward, eventually(Sorry suddenly and catastrophically) rendering the souther sea lanes unusable.
Doom Doom Doom.
Mark Twain springs to mind; “Science is wonderful,you can gain so much speculation from so few facts”Paraphrasing of course.
Or as we are discussing Climatology,extrapolating linear trends from cyclic data is so much fun.
Well, actually, as the sea ice around Antarctica relentlessly expanded from 1992 through 2016, the projected sea ice edge would close the Straits of Magellan and Cape Horn in 2023 – 2025 in September each year.
(Now, that threat has been eased since the NSIDC put the Cryosphere Sea Ice group out of business in mid 2016 and “retired” its primary researchers. Once the NSIDC secured its data, Antarctic sea promptly receded back to its “proper” -1.5 million km^s loss that their CAGW theory calls for in only 3 months. But, in June 2014, just the “excess” sea ice around Antarctica exceeded the entire area of Greenland!)
“…gain so much speculation from so few facts…”
I think you meant to say “such big grants”.
Antarctica’s albedo appears to have increased over most of the continent, which could explain the cooling.
https://earthobservatory.nasa.gov/images/84499/measuring-earths-albedo
Speculation: fresh snow has a higher albedo than ice, so if Antarctica gets more snow as has been reported by NASA, it would cause cooling.
https://earthobservatory.nasa.gov/images/144438/snow-over-antarctica-buffered-sea-level-rise
Bart Tali wrote, “Antarctica’s albedo appears to have increased over most of the continent, which could explain the cooling.”
Well, maybe.
Antarctica doesn’t absorb much sunlight, anyhow. Even though Antarctica is very cold, so it doesn’t emit much radiant energy (and all of it at long IR and microwave wavelengths), it still emits more radiative energy than it absorbs from the Sun, year-round.
The deficit is made up by (relative) warmth carried in by moving air. That’s why the Antarctic interior has an upside-down lapse rate: the air is warming the ground, instead of vice-versa.
“Albedo” is a shorthand that aggregates color changes across the solar or visual spectrum (solar, in this context). Those color changes presumably also affect the rate of emission of very longwave radiation, rather than just the rate of absorption of solar radiation. If they are affected equally, I think raising the albedo would make Antarctica warmer, rather than cooler, because it would reduce radiative emissions by more than it would increase absorption of solar radiation.
But that’s a big “if.” I don’t know that higher albedo (lower emissivity) in the “solar” range of wavelengths necessary also means lower emissivity in the longwave IR and microwave bands where Antarctica emits.
Here’s a paper, about how Antarctica’s upside-down lapse rate causes a negative greenhouse effect:
https://agupubs.onlinelibrary.wiley.com/doi/full/10.1002/2015GL066749
Oops!
“…because it would reduce radiative emissions by more than it would increase absorption of solar radiation.”
should be:
“…because it would reduce radiative emissions by more than it would reduce absorption of solar radiation.”
I hate it when my mistakes invert my meaning!
Thanks, yes, I like the terminology “reverse greenhouse effect” and this seems to be happening in Antarctica.
Albedo fresh snow:~80%
Albedo ice: ~40%
Warmer ocean -> more evaporation -> more water vapor -> more precipitation -> dumped as fresh snow on Antarctica.
More fresh snow on Antarctica, more albedo, less upwelling IR, less greenhouse effect.
We can expect those temperatures to be “adjusted” in 3…2…1…
That was the Steig et al. Nature cover that recently a CBC “journalist” , Nicole Mortillaro senior Science Reporter, included in her article… https://www.cbc.ca/news/technology/climate-report-1.5081643
Not at all bothered by the fact it had been debunked by O’Donnell et al.
Obviously those thermometers need to be replaced closer to some diesel generators. /sarc
Climate data shows no recent warming in Antarctica, instead a slight cooling
What it really shows is Antarctica is NOT melting. Do a “Google News Search on “Antarctica”
and then a search for “Melt” on the results.
About 15% of the articles blab about Antarctica melting.
If you are able to scientifically contradict the stuff below
https://www.scientificamerican.com/article/antarctic-melt-rate-has-tripled-in-the-last-25-years/
https://www.nature.com/articles/s41586-018-0179-y
(unluckily behind paywall)
please do!
I can’t 🙁
The study was of the Antarctica peninsula and the western ice sheet. All of this is caused by geothermal ridges warming the waters. And they used models to predict the melting rates. The rest of Antarctica is not melting which is 97% (if you don’t count the western ice sheet) ( ha ha) of it .
Bindidon … 5:25 pm
If you are able to scientifically contradict the stuff below
…
please do! I can’t
I can certainly comment. From your first link:
For now, though, the vast majority of the losses comes from vulnerable West Antarctica, where the intrusion of warm ocean water is melting some glaciers from the bottom up…
We are asked to believe that warm ocean water flows under the sea ice, under the floating ice shelf and then melts the glacier at the grounding line. Warm water rises, it doesn’t sink and flow under the ice. There are lots of lies in the whole body of “Climate Change” that are repeated endlessly, and this is one of them. Here’s an example of the usual claptrap:
http://cdn.antarcticglaciers.org/wp-content/uploads/2014/05/PIG.ai_-768×440.jpg
From your second link:
Although locally important, spatially integrated sublimation and meltwater runoff are typically one and two orders of magnitude smaller, respectively.
In other words, melting isn’t an issue. Since everything “Climate Change” is exaggerated, it’s probably two or three orders of magnitude.
And then this:
Over this period, ocean-driven melting has caused rates of ice loss
See my comment about warm water flowing under the ice above.
steve case
“I can certainly comment.”
Exactly what I did not ask for… because for that trivial task I truly need nobody.
“instead a slight cooling”
Ah well, there you go, proof of catastrophic anthropogenic global climate change warming if ever I saw it…..
“Consistent with” in any case…….
Never mind, the Green warmers will after much searching, still find some
warmth somewhere.
It might only be one hundredth of a degree, but its still warmth.
MJE VK5ELL
The instrument error must be less than 0.001C for them to be able to measure the temperature with an “accuracy of 0.01.
I don’t know anything about this Norwegian site.
I prefer to have a look at the well-known KNMI Climate Explorer:

and to download the corresponding data (anomalies wrt mean of 1981-2010):
https://climexp.knmi.nl/data/tlist_temperature_-180:180_-60:-90_10_1_-1_:___mean_a.txt
37 stations with at least 10 years with full data.
That gives you the following chart (starting with 1958, to exclude the strange drop before):
https://drive.google.com/file/d/1byYvhfhHvheHia0xLJzZ0Z1MmtVoKO-Q/view
Warming until about 2005, and stable since then.
“that threat has been eased since the NSIDC put the Cryosphere Sea Ice group out of business in mid 2016”
Are you saying there is a deception? And that Antartic sea-ice is not at an all-time satellite era low for the date?