By Dr. Roy Spencer
The Version 6.0 global average lower tropospheric temperature (LT) anomaly for April, 2019 was +0.44 deg. C, up from the March, 2019 value of +0.34 deg. C:

Various regional LT departures from the 30-year (1981-2010) average for the last 16 months are:
YEAR MO GLOBE NHEM. SHEM. TROPIC USA48 ARCTIC AUST
 2018 01 +0.29 +0.51 +0.06 -0.10 +0.70 +1.39 +0.52
 2018 02 +0.25 +0.28 +0.21 +0.05 +0.99 +1.21 +0.35
 2018 03 +0.28 +0.43 +0.12 +0.08 -0.19 -0.32 +0.76
 2018 04 +0.21 +0.32 +0.10 -0.14 +0.06 +1.01 +0.84
 2018 05 +0.16 +0.38 -0.05 +0.01 +1.90 +0.13 -0.24
 2018 06 +0.20 +0.33 +0.06 +0.12 +1.10 +0.76 -0.41
 2018 07 +0.30 +0.37 +0.22 +0.28 +0.41 +0.24 +1.49
 2018 08 +0.18 +0.21 +0.16 +0.11 +0.02 +0.10 +0.37
 2018 09 +0.13 +0.14 +0.13 +0.22 +0.89 +0.22 +0.28
 2018 10 +0.20 +0.27 +0.12 +0.30 +0.20 +1.08 +0.43
 2018 11 +0.26 +0.24 +0.28 +0.45 -1.16 +0.67 +0.55
 2018 12 +0.25 +0.35 +0.15 +0.30 +0.24 +0.69 +1.21
 2019 01 +0.38 +0.35 +0.41 +0.36 +0.53 -0.15 +1.15
 2019 02 +0.37 +0.47 +0.28 +0.43 -0.02 +1.04 +0.06
 2019 03 +0.34 +0.44 +0.25 +0.41 -0.55 +0.96 +0.59
 2019 04 +0.44 +0.38 +0.51 +0.54 +0.50 +0.92 +0.91
The UAH LT global anomaly image for April, 2019 should be available in the next few days here.
The new Version 6 files should also be updated at that time, and are located here:
Lower Troposphere: http://vortex.nsstc.uah.edu/data/msu/v6.0/tlt/uahncdc_lt_6.0.txt
Mid-Troposphere: http://vortex.nsstc.uah.edu/data/msu/v6.0/tmt/uahncdc_mt_6.0.txt
Tropopause: http://vortex.nsstc.uah.edu/data/msu/v6.0/ttp/uahncdc_tp_6.0.txt
Lower Stratosphere: http://vortex.nsstc.uah.edu/data/msu/v6.0/tls/uahncdc_ls_6.0.txt
Maybe w/a slight warming, my lot can escape the not-uncommon killing frost this May.
Pretty much what was expected as the current El Nino continues to hold on. Very possible the El Nino will now hold on through the summer. Naturally, this will be used by the alarmists to claim another “hot” year.
An El Nino should give us a “no major hurricane” year. That would finish off the decade nicely; it would tie for the fewest major hurricanes in the NOAA data base (which goes back to 1850). That used to be available at the now dead link here:
https://www.ncdc.noaa.gov/oa/climate/severeweather/hurricanes.html#earlier
Doesn’t this “graph” become a horizontal nearly flat line if you
expand the vertical scale to include + or – 10 degrees C ??
Also, what is the magnitude of the “error” in calculating
global temperature to a 0.1 of a degree C accuracy ??
its getting warmer
as for your graph suggestions? tuffte fail
Depends on your time frame. For the last few months it’s been warming. For the last 3 years it’s been cooling.
What is about you AGW acolytes and the need to cherry pick the data?
Except when it’s getting cooler… The graph goes up and down not a solid straight line up… The rate of warming has decreased from the back half of the graph as compared from the front half.. also a . 4 degree rise is not dire
And in the time of the data “its been getting” warmer, but 100% due to ENSO, not CO2.
So Mosher Do you agree that this is the only temperature data that both sides trust?
Outliers should be treated with more suspicion not less.
In climate science, the outliers are those who use actual data instead of modeled data.
Is it? The graph doesn’t show that – a downward slope on the average is cooler. And warmer than what? When it was cooler? Well that’s a trivial statement. Warmer than it should be? You know what it should be how?
“its getting warmer”
Still way below the Holocene average.
A mere bump above the freezing cold of the Little Ice Age.
Let’s all pray that the temperature continues to climb , or at least that it doesn’t start to drop too far.
That really would be catastrophic for the planet’s population
Plesae take one of Edward Tuftew’s course. I did. A bit pricy, but you get all his books and a poster showing Napolean’s disastrous foray into Russia.
https://www.edwardtufte.com/tufte/courses
Oops – Tufte.
The current El Niño is making itself felt in surface temperature. It should evolve towards a La Niña by late fall to next spring. I consider it likely that we might get a 2-year Niña that might return temperature values to Pause levels.
prediction?
Do you really need it to be spelled out?
I guess this is what happens when you let an English major play scientist.
How the hell did he ever get an English degree?
I mean he screwed up a single-word post.
‘Climate models indicate that if El Niño does develop it is likely to be short-lived.’ BoM
Javier is correct, a strong La Nina in 2020 is highly likely.
El niño will peak in December. Trust me I am from the future.
A 40 year el nino?
Did you take the same class as Mosher in how to say really stupid things?
No I didn’t, but how was it?
So they offered it twice.
Do you spot the pause?
The slight (as of the moment) El Nino is causing some problems with drought in Panama and the draft of the vessels that they are letting through the canal at the moment. https://www.hellenicshippingnews.com/drought-hits-panama-canal-shipping-highlights-climate-fears/ I expect the usual people will say the usual things.
So much for “the Earth is cooling” wish
You do understand that is exactly what it is showing, that energy has now gone. It is no longer in the Deep Oceans. It has escaped to the Atmosphere and on out in to space.
And all the time the Atmosphere is slowly shrinking.
There will be a lot of thunderstorms in North America.
http://cosmicrays.oulu.fi/
http://www.bom.gov.au/archive/oceanography/ocean_anals/IDYOC002/IDYOC002.201904.gif
Cold kills, who’d wish for that?
It just all depends on the scale being considered. Do you deny that?
I sure with the Midwest would warm up
According to the circulation.
Look out for tropical depression in Florida.
http://tropic.ssec.wisc.edu/real-time/mtpw2/product.php?color_type=tpw_nrl_colors&prod=namer×pan=24hrs&anim=html5
So much for the belief that one month doesn’t create a trend.
I thought you were the one who always pushed integrity in your comments?
Well, the 20 years since 2000 do make a nice warming trend. Warm is better than cold.
What warming trend? 18 years of no change ended by an El Nino.
It never ceases to amaze me how you acolytes can’t read even a simple graph.
spoken as a true believer, eh?
“What warming trend”
“can’t read a simple graph”
Is there such a thing as an irony tag?
Spoken like someone who can read an entire graph, instead of just focusing on the portion that supports your religious convictions.
I take it you don’t acknowledge the Pause?
Not being argumentative – just interested in your view.
And the 8000 years before that ?
You are hoisting your colors as a “warmist”
Could that be why you bullied your peers into flattening the solar cycles of the last couple of hundred years. 😉
Cooling would be bad. Warming is good.
So much for the scientists with not-so-hidden agendas wish.
An El Nino is a cooling event as it increases Boltzman and Evaporation.
What?
Who is crazy enough to wish for cooling? I do wish we could get people to stop pretending that warming is bad or that carbon dioxide is some control nob for climate.
Leif, so much for solar science that relies on ideal gas/gravity heating plus sometimes tunnelling, to ignite stars. Always.
But it could not compare to steel shells and weak IR in planetary gaseous atmospheres apparently. Convection and LH uplift are not good enough then, to defeat the need to sell the biggest con in history.
My physics training tells me to prefer Maxwell/Poisson to Santer et al. Brett Keane, NZ
As soon as Pierre Robitaille can prove that the sun is not a gaseous ball, all of cosmology will fall including Einstein’s theories and all hell will break loose on the scientific front. It would be nice if at the same time we could kill this global warming scam.
I’m more intrigued by the gasous ball scam and the the Einstein theory scam, why havn’t they been in the news?
Leif, as you well know, two successive data points do not constitute a reliable trend.
But maybe you were just being sarcastic?
Winter is coming (to Earth) . . . Mother Nature is not at all happy with so many humans usurping her power to determine what factors actually control Earth’s climate, so she’s going to teach us (especially all CAGW alarmists) a cruel lesson 🙁
3rd warmist April?
Since 1979 and according to UAH, yes.
It is not so hot at the North Pole.
http://masie_web.apps.nsidc.org/pub/DATASETS/NOAA/G02186/plots/4km/r11_Central_Arctic_ts_4km.png
According to the UAH update the Arctic was +0.92 C warmer than average for the month in April. It’s right there in the table from the article.
The Arctic warmed even more last year . It was 1.39 at one point.
The sea temperature anomalies oscillate around 0.3 C.

With the current El Nino resulting in heat coming out of the planets biggest heat storage facility(Pacific Ocean), why wouldn’t temperatures be going up at the receiving end of the heat(atmosphere) right now?
Mike,
Do you mean why isn’t outer space heating up? This is the ultimate destination of surface heat leaving the surface as photons consequential its thermal emissions which are proportional to T^4.
Surface heat as emitted photons either passes through the transparent window directly into space or are intercepted and delayed by clouds and/or GHG’s with a residence time in the atmosphere of between milliseconds and days. About half of this delayed energy supplements the radiant balance at TOA while what remains supplements the radiant balance at the surface where it’s added back to the energy stored by the surface, only to be re-emitted later as another photon. It’s this other half of the energy returned to the surface that offsets the 620 mw/m^2 of additional surface emissions per W/m^2 of forcing above and beyond the 1 W/m^2 of surface emissions per W/m^2 that would be characteristic of the Earth if there was no atmosphere, i.e. the Earth would behave as a black body much like the Moon.
co2isnotevil – “Surface heat as emitted photons …”
Now explain how Earth sheds heat in waves rather than photons.
If by wave you mean electromagnetic wave, that is what a photon is.
[In physics and chemistry, wave-particle duality holds that light and matter exhibit properties of both waves and of particles. A central concept of quantum mechanics, duality addresses the inadequacy of conventional concepts like “particle” and “wave” to meaningfully describe the behaviour of quantum objects]
Thomas,
The way to interpret the wave/particle duality relative to a photon is that it can be considered a Quantum Mechanical particle or a propagating electromagnetic wave per Maxwell’s equations. Both models work.
There is a subtle difference between the EM representation of a photon and that of an antenna driving planar EM. The resonant impedance of an antenna is ideally matched to the impedance of free space, Zo = sqrt(u0/e0) = 377 ohms. The resonant impedance of a photon is much higher, at Zo/a = 51K ohms, where a is the fine structure constant, but it still propagates through free space whose intrinsic impedance is a consequence of the speed of light. If you’re familiar with the concept of a resonant circuits Q, the Q of the LC resonant model of a photon is 1/a = 137.
Despite this significant difference, planar EM waves can also be consistently modeled as photons (particles) and photons can be consistently modeled as planar EM waves. Are photons exactly the same as planar EM radiation? It really makes no difference as both can be legitimately modeled as either.
The required resonant impedance of a photon can not be Zo because the photons energy is constrained by the Planck Equation and this much energy must also be stored in its LC resonant model, where LC resonance is another consequence of Maxwell’s Equations. The energy stored in the 377 ohm free space resonance associated with propagating planar EM is not similarly constrained. The photons equivalent resonant impedance can be derived by setting the Planck Equation equal to the energy stored in a capacitor whose impedance at the photons resonant frequency becomes Zo/a.
This shows how the fine structure links the wave representation of Maxwell’s Equations to the particle representation of Quantum Mechanics. When you dig deeper to connect the required resonant impedance of a photon to the geometry of the space-time it occupies, the fine structure can also be considered a scalar metric of space-time curvature quantifying how the geometry of a photon can be modeled as being curved and then un-curved in sync with the photons frequency in order to manifest the required L and C as the energy bounces between them without violating the speed of light and/or varying e0 and u0. In this context, the fine structure constant also links Quantum Mechanics to General Relativity.
There is a conceptual problem with photons because most view them as radiating energy in all directions – simply not possible for EMR to transfer energy against the potential gradient.
Just stick with Maxwell’s equations and understand that matter interacts with the E-M field at discrete energy levels.
A key point you seem to have missed is that the speed of interaction in the E-M field is solely a function of the electric permittivity and magnetic permeability. In a vacuum that is commonly referred to as the speed of light.
RickWill,
You can’t explain the energy emitted and absorbed by the electron shells of atoms and molecules without considering the packetization of energy i.e. photons, which we can even measure one at a time.
It’s a collection of photons that are going in all directions where each one goes in a single direction. It’s this collection that exhibits duality with a propagating EM field. The dual representations of an individual photon as a discrete particle or as a wave quantifiable with Schrodinger’s Wave Equation is what’s important to quantum mechanical wave/particle duality.
I know what you’re trying to say and I’m not completely convinced than EM radiation emitted by antennas is emitted as photons either, but I’m completely convinced that it can be accurately modeled as such and that Quantum Mechanics makes no sense without them. I’m equally certain that the silicon chips in your computer wouldn’t work if Quantum Mechanics was that wrong.
I definitely didn’t miss that the speed of light is related to e0, u0 and Zo and this is why a locally warped geometry occupied by the photon makes more sense as e0 and u0 are what they need to be relative to the reference frame of the photon while this reference frame is decoupled from that of the space-time it’s traveling through. In fact it must be, otherwise inertia would prevent it from traveling at c.
As implied by E=mc^2, the space-time curvature associated with mass is interchangeable with energy. There appears to be a way to express photons as a different organization of the same space-time curvature that manifests particles with mass. After all, where does the space-time curvature manifesting gravity go after matter and anti-matter are annihilated? I think it must comprise the resulting photons and I have a way to show how it can.
You seem to be neglecting the Energy contained in the Photons, anybody who says they are all the same must explain how UV, Short Wave and White Light have so much more energy than LWIR.
The ‘Global Temperature’ estimate, means absolutely nothing, yet so much seems to hang on it. Pure folly.
So, a rise of about 1.1 degree C. per century (assuming this trend continues)? Do I read that right? If so, how bad is that?
trp: How bad is 1.1C/century?
Bad enough to trigger a mass extinction, or something.
Meanwhile, on Earth, the Carbon Cycle of Life is more robust by relaxing the lone throttle with increased atmospheric CO2.
Thomas how does making it warmer trigger a mass extinction?
Ask AOC or Greta or the Extinction Rebellion.
The observations in the last 20 years do not support the assertion that there will be future increases in planetary temperature.
The fact that there is an unexplained pause (or is it the end of warming?) in warming is still valid.
The warming we have seen recently is the same magnitude and is in the same regions (in the past cycle warming periods that were always followed by cooling periods, the high latitude regions warmed the most and there was more warming in the high arctic) as past cycle warming.
The arctic warming has stopped. The cult of CAGW are no longer breathless predicting the end of summer sea ice in the Arctic.
In addition, the temperature records pre-1997 does not support the AGW theory. For example, there was unexplained Northern hemisphere cooling of 0.6C 1958 to 1963 that started the is there another ice age coming discussions.
https://notrickszone.com/2019/04/29/the-northern-hemisphere-cooled-by-0-6c-from-1958-63-that-cooling-has-now-vanished/
We need cooling of 0.5C to change the conversation from how much future warming there will be, to what caused the original warming and why is there cooling.
The earth has been gradually warming for 150 years. No one has yet presented convincing arguments that a long term cooling trend is about to begin. So when in doubt, predict the current warming trend will continue.
The only truly definitive evidence that a long term cooling trend is occurring will come when the thirty-year running average of GMT turns down and then remains in a continuously downward trend for another thirty to fifty years.
A year ago in early 2018, over on Judith Curry’s blog, I asked Javier to offer a prediction as to when he thought the permanent inflection point might occur, assuming his own theories concerning GMT’s cyclic behavior were applied.
His answer was that it happens roughly in the year 2200.
As long as the current warming trend continues, however small it might be, the debate over AGW will continue. If Javier’s analysis holds water, this means we have another two-hundred years to assess and debate the true dangers of climate change.
Have at it. If nothing else, this never-ending debate will keep our minds active and the muscles in our typing fingers strong.
This 1 graph demolishes climate science with 47 years of satellite data.
https://twitter.com/ATomalty/status/1122028323268227073
As far as mainstream climate scientists are concerned, as long as the earth is still warming, however slowly, then the climate models and today’s mainstream climate science narrative have both been confirmed. That’s their story and they are sticking to it.
According to UAH it’s currently a rise of 1.3 degree C. per century (since 1979) but with caveat that it could be 0.6 per higher or lower per century than that.
UAH has by far the lowest estimate of recent warming of all the global temperature data sets.
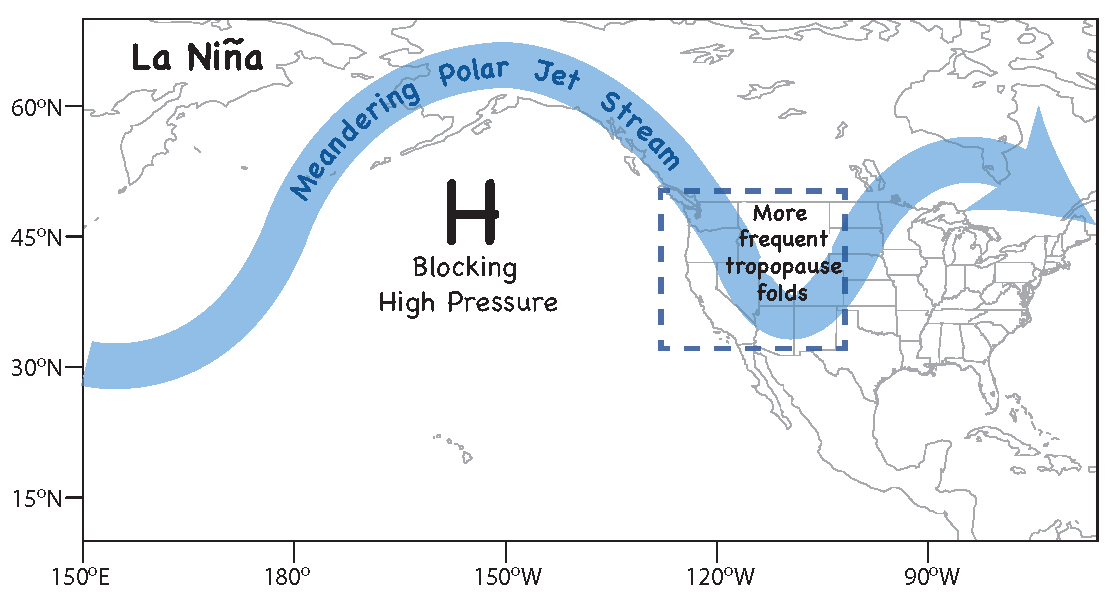
When people admit that the jet stream distributes heat in the atmosphere? Now look at the temperature in Europe.
https://earth.nullschool.net/#2019/05/02/0300Z/wind/isobaric/500hPa/equirectangular=-330.00,0.00,216
It’s all interesting……it’s cooling, it’s heating. It’s a cycle, no it’s CO2, no it’s the sun. No it’s our position in the galaxy
I have no idea but these are great times…
It’s more like thermal whack-a-mole. A little warmer in one region, a little cooler in another. Next month same thing only in different regions.
Except more warm than cool, to the point now where even the “cool” is still above the long term average.
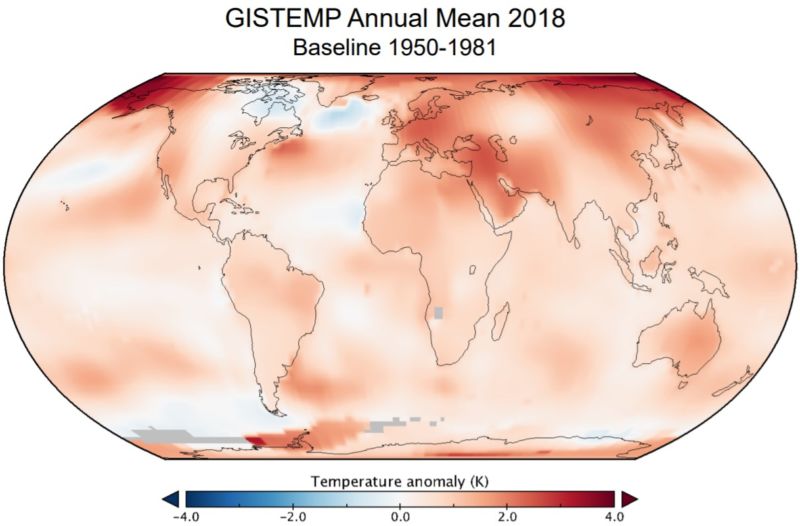
You actually believe what comes out of NASA?
Wasn’t all this predicted?
Depends who you ask.
Not that long ago some were predicting rapid global cooling due to (variously) reduced solar output and/or changes to the PDO/AMO. Think David Archibald (the sun) and Don Easterbrook (the PDO) circa 2008.
Around the same time the IPCC predicted (they prefer ‘projected’) continued warming at about ~0.2 C per decade for the next ~20 years. The warming rate in all global data sets (including from UAH) since 2008 is currently >0.2 C per decade.
The warmists are now clutching at straws .
The world has not warmed as the doomsayers predicted and no one has proven or produced proof that the fluctuations in the earths temperature record in the last 80 years has not been the result of natural cycles .
No scientist has proven that CO2 can control the climate on this planet.
Increasing CO2 may cause a very small amount of warming , but positive water vapour feed backs have to come into play to produce a rise in temperature more than .5 degree Celsius.
The theory of positive water vapour feed backs is a theory that has not been proven simply because more water produces more clouds and more clouds are impossible to model accurately .
From the warm blip in the 1930s and 40s the planet cooled and I will remind you the the scientific consensus in the 70s was we were heading for an ice age .
The satellites were launched in the late 70s and the small amount of warming since then takes us back to the warmth of the 1930s and 40s
I am sure that the true surface temperature of the planet after allowing for the urban heat affecting the record , has warmed less than half an a degree Celsius in the last 80 years which is probably within the margin of error.
Warm is certainly better at night and in the winter which is where most of the very small warming is happening .
“warming since then takes us back to the warmth of the 1930s and 40s”
No it doesn’t.
I keep reading this here.
Please provide evidence that GLOBAL average temperatures were higher in the 30’s and 40’s.
It takes us way beyond…….
THe Atmosphere has cooled, that is why it has shrunk.
So from 2002 to 2015, C02 increased by roughly 30ppm and did not do anything. (go figure) It did nothing for the decade starting in ’87. Now how much has been added sine 2015? 5 or 10ppm and it’s suddenly causing the current trend to kick off? I don’t buy it. All I can see is a jump of 0.2 degrees from ’98, and a lot of indefinable noise along with it.
What you see is temperature rising a at 1.3C/ century overlaid with background noise.
As a person that reads to learn and rarely comments, a question I haven’t seen addressed. What is the cyber security level of the data? There are only trillions of dollars riding upon it.
The real issue is CO2. Does this warming mean we need to upend civilization in pursuit of zero carbon emissions world wide? That’s what the activists will say so that’s why this subject is so touchy….
Obviously not April in the American northeast……we’re double digit below average.
It looks like we only have several centuries to adapt. Or quite possibly adaptation won’t be necessary either.
Look at the tropopause and circulation over North America.
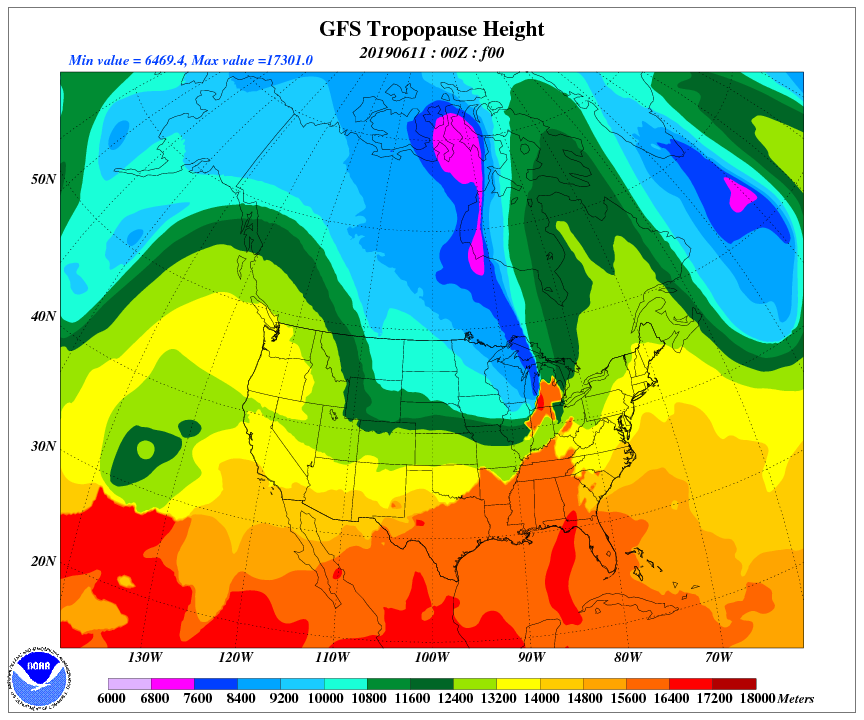
This is a big problem, especially in winter.
http://oi65.tinypic.com/1o13pj.jpg
Now El Nino is very far away.
http://www.bom.gov.au/archive/oceanography/ocean_anals/IDYOC007/IDYOC007.201905.gif
http://www.bom.gov.au/archive/oceanography/ocean_anals/IDYOC002/IDYOC002.201905.gif
There is currently a weak El Nino Modoki event in the Pacific.
$1,000 to anyone who can find any consecutive 30-year period in the following data where the global average temperature at the end of that period was lower than at the beginning!
http://ds.data.jma.go.jp/tcc/tcc/products/gwp/temp/ann_wld.html
The current trends reflect the El Nino Modoki.