Global climate trend since Dec. 1 1978: +0.13 C per decade
March Temperatures (preliminary)
Global composite temp.: +0.34 C (+0.61 °F) above seasonal average
Northern Hemisphere.: +0.44 C (+0.79 °F) above seasonal average
Southern Hemisphere.: +0.25 C (+0.45°F) above seasonal average
Tropics.: +0.41 C (+0.74 °F) above seasonal average
February Temperatures (final)
Global composite temp.: +0.37 C (+0.67 °F) above seasonal average
Northern Hemisphere.: +0.47 C (+0.85 °F) above seasonal average
Southern Hemisphere.: +0.28 C (+0.50 °F) above seasonal average
Tropics.: +0.43 C (+0.77 °F) above seasonal average
Notes on data released March 1, 2019 (v6.0)
[Note that we have updated the merging process for the period since 2009 which has very slightly altered the recent values as discussed at the end.]
March’s globally-averaged, bulk-layer atmospheric temperature anomaly of +0.34°C (+0.61°F) changed little from February. Values for the large sections (NH, SH and Tropics) were also similarly unchanged from last month. As noted in last month’s report, the official El Niño is having minimal impact on global temperatures thus far.

The month’s coldest seasonally-adjusted temperature departure from average occurred just south of Greenland in the North Atlantic: -2.5°C (-4.5°F). The warmest spot, at +6.2°C (+11.2°F), is obvious on the map, occurring over Inuvik in the NW Territories of Canada. The NW section of North America, including Alaska, was so warm that the departure from average of the conterminous U.S. was -0.55°C (-0.99°F) but when Alaska is included, the U.S. average rises to +0.12 °C (+0.22°F).

The monthly map for March 2019 indicates the El Niño signature of warm tropical temperatures is weak but distinct in the eastern Tropical Pacific Ocean but does not follow the usual situation in which these above-average temperatures spread throughout the tropics. Cooler than normal conditions appear from the eastern mid-latitude Pacific NE all the way to the Barents Sea. Warmer than average temperatures paralleled this cool band and are seen from (generally) the El Niño region of the eastern Tropical Pacific NE to Russia. Unusually warm conditions appear along the dateline in the SH with cool, meridional bands on either side.
New Spoiler Alert: As noted over the past several months in this report, the drifting of satellites NOAA-18 and NOAA-19, whose temperature errors were somewhat compensating each other, will be addressed in this updated version of data released from March 2019 onward. As we normally do in these situations we have decided to terminate ingestion of NOAA-18 observations as of 1 Jan 2017 because the corrections for its significant drift were no longer applicable. We have also applied the drift corrections for NOAA-19 now that it has started to drift far enough from its previous rather stable orbit. These actions will eliminate extra warming from NOAA-18 and extra cooling from NOAA-19. The net effect is to introduce slight changes from 2009 forward (when NOAA-19 began) with the largest impact on annual, global anomalies in 2017 of 0.02 °C. The 2018 global anomaly changed by only 0.003°C, from +0.228°C to +0.225°C. These changes reduce the global trend by 0.0007 °C/decade (i.e. 7 ten-thousandths of a degree) and therefore does not affect the conclusions one might draw from the dataset. The v6.0 methodology is unchanged as we normally stop ingesting satellites as they age and apply the v6.0 diurnal corrections as they drift.
To-Do List: There has been a delay in our ability to utilize and merge the new generation of microwave sensors (ATMS) on the NPP and JPSS satellites. As of now, the calibration equations applied by the agency have changed at least twice, so that the data stream contains inhomogeneities which obviously impact the type of measurements we seek. We are hoping this is resolved soon with a dataset that is built with a single, consistent set of calibration equations. In addition, the current non-drifting satellite operated by the Europeans, MetOP-B, has not yet been adjusted or “neutralized” for its seasonal peculiarities related to its unique equatorial crossing time (0930). While these MetOP-B peculiarities do not affect the long-term global trend, they do introduce error within a particular year in specific locations over land.
As part of an ongoing joint project between UAH, NOAA and NASA, Christy and Dr. Roy Spencer, an ESSC principal scientist, use data gathered by advanced microwave sounding units on NOAA, NASA and European satellites to produce temperature readings for almost all regions of the Earth. This includes remote desert, ocean and rain forest areas where reliable climate data are not otherwise available.
The satellite-based instruments measure the temperature of the atmosphere from the surface up to an altitude of about eight kilometers above sea level. Once the monthly temperature data are collected and processed, they are placed in a “public” computer file for immediate access by atmospheric scientists in the U.S. and abroad.
The complete version 6 lower troposphere dataset is available here:
http://www.nsstc.uah.edu/data/msu/v6.0/tlt/uahncdc_lt_6.0.txt
Archived color maps of local temperature anomalies are available on-line at:
Neither Christy nor Spencer receives any research support or funding from oil, coal or industrial companies or organizations, or from any private or special interest groups. All of their climate research funding comes from federal and state grants or contracts.
–30–
As usual, I am struck by the relative scale proportions in these sorts of graphs.
A whole YEAR gets less distance on the x-axis than a FIFTH of a degree gets on the y-axis.
Here’s how I see it:
Should I really be alarmed? Best answer wins a prize.
No. Do I win the prize?
We have a winner. As for the prize, you already have it — common sense. (^_^) I can only add to this with a compliment. Thanks for playing.
Forty years.
The entire Earth.
Remaining within one degree.
How many jobs and professional activities depend on the frenzy of interest in this?
Think I’ll base my next career on measuring variations in the length of flea legs. This is a very important field of endeavor.
Yours truly,
C. Lee Snark
In cartography, what you describe regarding the relative scales of the X and Y axes is called “vertical exaggeration.” If one is displaying a cross-section profile of the Earth, it’s obvious that the ground distance scale — perhaps one mile per inch — can’t be used for the elevation scale, especially across relatively flat terrain.
It’s easy to calculate the vertical exaggeration in a profile section, because both X and Y axes are distances. But how to determine it when one axis is time and the other temperature? One way might be to use the full range of temperatures in a year, for the region being profiled, as the equivalent of a year in the X axis. If the temperature range was -20C to +38C, then a vertical scale of 58 degrees/inch would be considered a 1:1 vertical exaggeration for one year.
That’ll sure flatten a chart out.
RSS LT now out for March: http://images.remss.com/data/msu/graphics/tlt_v40/medium/global/ch_tlt_2019_03_anom_v04_0.png
Similar patterns to UAH in terms of the spread of global temperature anomalies, e.g. US lower 48 much colder than average and NW North America much warmer.
However, in terms of numbers, the recent differences between RSS LT and the latest version of UAH LT (as published at Roy Spencer’s site) remains stark. Here both are base lined to the UAH anomaly period, 1981-2010: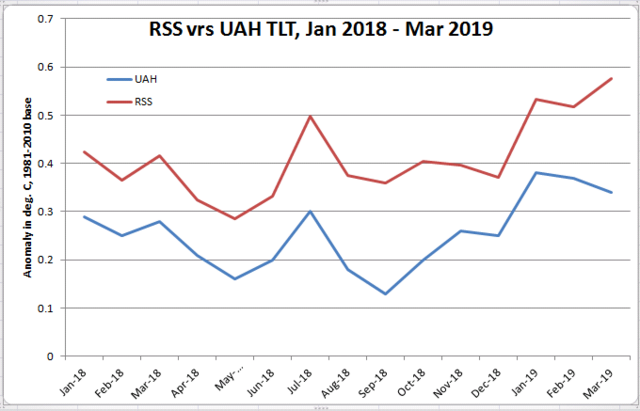
Did Mears ever respond to the criticisms of his latest version of RSS?
Were these criticisms ever formally submitted to the journal that published the article that describes the latest version of RSS? There’s no mention of any peer reviewed rebuttals or comments: https://journals.ametsoc.org/doi/10.1175/JCLI-D-16-0768.1
I get it now, DWR54; real CliScientists don’t look into substantive questions concerning their work unless they are published in journals run by like-minded CliScientists.
Are you related to R2D2? We don’t know who you are or where you are coming from. Why don’t you use your real name?
Well, from mid-August through mid-April, less sea ice across the Arctic Ocean means greater cooling from the Arctic Ocean to the infinite back cold of space.
It is only those few fleeting weeks of mid-April through mid-August that the Arctic Ocean absorbs enough heat from the sun to make up for the increased heat losses due to greater evaporation, greater thermal mixing of convection and conduction, greater long wave radiation losses.