About this time last year, I wrote a light-hearted review of New Zealand’s love affair with Wind Generation.
Since then I’ve become interested in seeing just how effective these things really are. Where I live adjacent to a string of Turbines, we get some pretty impressive winds – 150Kph is not that unusual. But we also get days of complete calm – usually at times when electricity demand is at its highest.
Nonetheless, our green-biased Government elected just over a year ago are still pushing so-called renewables as the way of the future. Interestingly New Zealand already produces more than 80% of its energy from Renewables, with Geothermal and Hydro way ahead of Wind.
Ironically, the green movement vehemently oppose any new hydro projects, and insist on visually polluting the beautiful GodZone countryside with these wind turbines.
Eventually I decided to try and discover exactly just how successful and efficient these wind turbine things really are. But finding the data seems like hard work. I’ve been unable to locate data on individual windfarms (unless someone can help me out here), but I have located data covering each of the North and South Islands.
Since July last year, I have been collecting the data via a computer script that downloads data at 5 minute intervals and stores it in a MySQL database. I needed to wait a reasonable interval before analysing just to make sure I had a representative sample.
I’ve just done my first analysis, and the results are as predicted – shocking.

The above graph shows theoretical “Plated” capacity versus actual average production by month.
Here’s the supporting data:
| Month | Plated Capacity | Generated MW | Average Production |
| July | 658 | 186.15 | 28.29% |
| August | 658 | 132.50 | 20.14% |
| September | 658 | 174.62 | 26.54% |
| October | 658 | 157.63 | 23.96% |
| November | 658 | 149.15 | 22.67% |
| December | 658 | 124.54 | 18.93% |
| January | 658 | 179.51 | 27.28% |
| February | 658 | 157.86 | 23.99% |
Clearly in 6 months, there has been no capacity added to the National Grid, and last July had a high of just 28.29% productivity yet December could only yield 18.93%.
These results are pretty damning and expose the deceit we are exposed to every time a new proposal is put forward.

Next time there’s a public meeting regarding how wonderful these visual pollutants are, at least I can now present data to refute many of the absurd claims. They’d be hard pressed to refute this data since it comes from the Government’s State-Owned Enterprise “Transpower” who manage the National Grid.
I have made my data available to anyone who wants to analyse it at http://www.andic.co.nz/windextract.csv
Andi
Discover more from Watts Up With That?
Subscribe to get the latest posts sent to your email.
I am as anti-AGW as is possible.
AGW is purely political. Worse than wasting $Trillions, AGW is sullying and debasing science…this is ugly and despicable beyond description. It is destroying our sacred institutions of science. I hope I live long enough to see these perpetrators convicted and pay/suffer sufficient to their crimes (somewhere…somehow)…including the lying propagandists in the press and all the cowardly scientists that remain silent in the face of this abomination.
Having said all that, I don’t hate wind generation (I think they look kind artfully graceful…sucking up energy from the wind…just NIMBY :-))…but Wind should not get more government subsidy than any other energy source. If investors can’t make money without special AGW subsidies they should lose their investment funds. Period. Then the market would justly and fairly adjudicate the viability of Wind Power.
Wind generators should only be sited where they don’t kill endangered birds. I really hate that. Nobody (including Hillary Clinton…after acquiring some “endangered” feathers illegally) should be able to skirt legitimate endangered species laws…they are laws (if you don’t agree with them…work to change the laws…or get over it). I speak out when “species” regulations are too stringent or too lax…many/most are excessive to my mind.
We still have lots of REAL environmental problems to address, which is another reason that I hate wasting all these $Trillions on non-existent AGW concerns.
If there is any justice in this world we will see these seekers of illegitimate power suffer and pay. If we see declining temperatures (as is likely over the next decade or 2) I for one will never never never stop pointing out that the lying liars were lying all along.
The Wind Power advocates were lying (even when leaving out the significant issue of inconsistency of power production…so “double fail”). The proof is now in. It’s time to pull the plug on Base Production Wind.
Engineering and technology may eventually bring wind “back”…but that should only be on the basis of a legitimate niche established in the free market.
Ontario Power has a website which posts hourly generation for each generator at each station plus wind, solar, biomass power and the current prices.
I am pretty sure you can go back in time for earlier records.
The Southwest Power Pool has real time which is moderately interesting. They also have csv files of historical data by generator type in 5 minute increments.
Great reading there Andi. I live on the Manawatu plains west of Palmerston North so I am more than familiar with the impact of wind farms on a region. I was a little surprised to see the percentage for Nov 2018 so low. Normally the windiest month on average in NZ period, last Nov here in Palmy North saw a daily mean wind-run of 324 km, about 11% above the long term mean. I am not a fan of the wind turbines in our area, and certainly don’t believe that we need to blot our landscape with them.
Another windfarm is currently being rushed into construction directly behind the city because its resource consent is about to expire. Those who stand to make copious amounts of money from these machines are very keen on selling the idea, or should I say myth, of their benefits. Those of us how are not enamoured of them find our ranks growing, hence the rush for this latest one to beat the axe.
I notice that you included a picture looking along the ridge featuring the so called show case wind farm, Te Apiti, with Wharite Peak in the background, which is BTW the windiest place in New Zealand where there is an anemometer to record such. Wharite is just on 3,000 ft high (just over 900m) so there are likely more windier spots in NZ. The interesting thing about wind run is, just like other features of our weather and climate, it is variable. Despite all of the hype about the ‘windy Manawatu’ we do have lengthy calm periods. The 1950’s & 90’s were noticeably calm compared to the rest of the period since the end of WWII. My point is even here where the Roaring Westerlies are ingrained into our psyche, you can’t rely on wind!
Wind data from AEMO grid in Australia that covers Qld/NSW/Vic/Tas/SA.
Nameplate capacity 5,661 MW.
Average generation 1698 MW, so 30% capacity factor.
Variability in supply 200-4,000 MW, lowest week 870 MW average.
One example of costs is wind farm near Ararat in Victoria.
75 towers, nameplate capacity 240 MW, capital cost A$450 million.
You say that no capacity has been added to the grid by the turbine farm. What do you mean by that? Obviously all those MW produced have added something.
I mean no change to plated capacity – ie commissioned turbines.
Cheers
Andi
It is downright bizarre that this delusional obsession with wasting money is so widespread.
Every day are new reports regarding how little they actually produce, how many birds and bats they kill, how oversold they are in terms of years of useful life and failure rates, dreadfully concerning reports of the long term health consequences of the sounds they emit, and so many other problems and shortcoming.
And right at the top of the list of ridiculousness’s is that these things may not wind up making a whole lot more power than it costs to make them.
I think its funny that people are arguing for wind turbines because they might produce less than half their rated capacity – 40% – on average… but not all the time.
Nuclear plants can produce 90% or more of their rated capacity day in and day out. And require a lot less land. And are reliable. Its called a stable base-load.
Solar PV has an even lower capacity factor than windmills at New Zealand latitude…maybe 18% to 20% if you are lucky with a PV Park and probably more like 15%-16% realistically or less with roof top. And less if it snows in winter. With solar, you can at least predict you will have peak generation about 2 hours either side of noon, but you never know with wind. A lot of times, wind is in the middle of night when temperature differentials are the greatest, but that is the least desirable time to have it generated for the grid.
It is really too bad that NZ doesn’t invest the final 20% required firm capacity in large hydro, small hydro and geothermal. Being a mountainous country, small hydro is semi base load for the season that does have water and that resource is barely tapped. NZ certainly is well situated to also be 100% renewable very easily with these available eternal resources. Do what has the best capacity factor, best cost and the maximum longevity of technology. Wind doesn’t come close in any metric to any of the three I mentioned.
Earthling
We have the slight consideration of also being on the boundary of two tectonic plates, Australian and Pacific, which divide the country nearly equally in half. The Southern Alps being the most prominent example
We do have earthquakes fairly often, add in the occasional volcano burping and it is an interesting country to find suitable places to build hydro without knowing that everything downstream is going to be washed away whenever the earth moves.
Geothermal is another source that isn’t used to full advantage as well.
Right you are Warren…but so does California and many other jurisdictions. Risk is part of the equation, but unacceptable risk isn’t. I understand that. Site specific surveys should be able to conclude what is acceptable risk and what isn’t. Large dams and hydro is also getting more expensive to build, especially when you factor in the pre-planing and permitting, including the legal and social costs of endless consultation and court cases. But it sure does have an excellent life span, compared to say wind. But wind in NZ also works very good with large hydro (storage) as one can retain storage when the wind blows and hydro is a spinning reserve that can ramped up almost instantly to meet demand. So your wind industry isn’t a total loss, but it is expensive.
Small hydro represents almost zero risk from earthquakes if there isn’t considerable water storage involved behind a big dam. And New Zealand, as you say, has the Southern Alps and is very mountainous and hilly overall. Run of River installations are very efficient, especially with a higher head component which New Zealand has. It is sad to see such a technology wasted because of opposition to the water being utilized for 5 minutes before being put out back in the original creek and water shed it originated from. It is also near base load quality when the watershed is flowing, at least far more reliable and predictable than wind.
New Zealand is fortunate that it has so many renewable resources, including geothermal that has much more capacity to utilize. I think New Zealand could really be hitting above it’s weight economically with electricity heavy industries if it wished, but I fear with your new socialist Gov’t, it is going to slaughter your viable and successful livestock industry, on the alter of GHG climate change stupidity (methane emissions from animals) and you will be a back water because of the poor choice of Gov’t there. From what I hear and can see from here in British Columbia…where we have a very stupid Gov’t, including a stupid prime minister in Ottawa.
Many good comments on intermittent and unpredictable output. Not so much on pathetic energy density. And the fact that a wind turbine will never produce enough energy to manufacture and build and operate another windmill.
Let alone to demolish it and restore the site when it’s output has declined and it is at the end of it’s life. More like 15 years than the claimed 25 years.
The fact remains that, unless you have plentiful hydro and geothermal (in which case only a moron or a very venal virtue signalling politician would even consider wind), there will be a fossil fuel generator somewhere which is going to have to operate completely inefficiently, at great expense, in order to keep the grid functioning.
The energy density issue is interesting. Did you work out the area of land you would need to cover with turbines to replace the coal power from Huntley?
Even forgetting about intermittency?
Don’t forget the disaster at Pike River Mine.
OK, the design and operation of the mine were grossly incompetent.
But part of the design failings were directly attributable to the tiny area they had been allowed to clear. Why on Earth would anyone with IQ score higher than their hat size, install the main ventilation fan underground ?
No such worries for venal greenie wind farm proponents!
” a wind turbine will never produce enough energy to manufacture and build and operate another windmill.
Let alone to demolish it and restore the site when it’s output has declined and it is at the end of it’s life.”
I believe it, but it would be lovely to have a written out explanation of how and why.
“This graph depicts performance of wind farms connected to the electricity grid in south-eastern Australia over a month.
https://anero.id/energy/wind-energy/2019/february
The default, capacity factor graph shows the output as a percentage of registered capacity. On average wind farms in south-east Australia operate at a capacity factor of around 30-35%.
Alternatively, you may view the actual output in megawatts.
Different wind farms may be included or excluded from the graphs by toggling the check boxes. The total will update accordingly.
Data for the month-long graphs is sampled at 3 hour intervals to reduce the number of data points. ”
But that average hides a multitude of sins and how ridiculous it is to believe you can pack enough of Tesla’s 2170 lego brick lithium cells into rack upon rack to even get that one third of installed capacity dispatchable 24/7 all year round-
https://anero.id/energy/wind-energy/2018/june
check the number of low points in a month here-
https://anero.id/energy/wind-energy/2018/april
Arguing over a few percentage points of any such average value for various geographic locations is utterly meaningless particularly with the doomsday cult that believe they’re going to save the world erecting these religious monuments worshipping Gaia. These are people who believe in an average global temperature and their hands on a plant food global thermostat for Chrissakes.
Average capacity factors are very similar to UK ones as measured by the grid and archived in my gridwatch site.
The government figures are always 10% higher.
A discrepancy no one has ever explained.
‘the green movement vehemently oppose any new hydro projects’
Because some small furry animal might have to move habitat, I guess.
Actually snails, centipedes and several grasses. https://www.doc.govt.nz/nature/native-animals/invertebrates/powelliphanta-snails/
Yesterday wind was providing 30% of electricity in the UK, now it is providing 5%!
Reliable!?!
A few years ago the head of the National Grid said in an interview that in the future we would only have electricity when it is available. It seems as if we are near that point now.
And what happens when all those electric cars need charging. ‘ Sorry boss, I can’t get into work today, the wind didn’t blow last night ‘.
“we would only have electricity when it is available.” Just like Africa. Welcome to the 3rd world. Nothing a backup diesel genset won’t fix.
The Chinese didn’t worry too much in moving over a million people when they built the Three Gorges Dam on the Yangtze River.
And they arent worrying about building 500 coal plants around the world.
Meanwhile the UK aims to get 30% of electricity from offshore wind by 2030.
https://news.sky.com/story/uk-targets-a-third-of-power-from-offshore-wind-by-2030-11656866
Griff you need to get your head around marginal cost vs average total cost for an electricity grid as a whole-
https://www.thoughtco.com/relationship-between-average-and-marginal-cost-1147863
Clearly the marginal cost of your fickle whirylgigs is greater than the average cost of fossil fuel power which is why end consumer power bills are rising everywhere and are highest in States like South Australia with the greatest penetration of them.
Stuff the poor people as they have to be sacrificed for virtue signalling toffs like you eh? Howsabout a bit of a conscience and letting the poor eat Yellowcake if you don’t like plants so much?
It is worse than that. The amount of energy you produce from a wind turbine total lifetime is less than the amount of energy it takes to manufacture, operate and dispose of.
“Meanwhile the UK aims to get 30% of electricity from offshore wind by 2030”
Another example where it us inferred that we ALL want to get something or other. I have never been asked if I want this outcome, or any other of the ludicrous claims and assertions made by green proponents. What it should have said was “the UK government aims”, which is an entirely different matter…
Do you Kiwis have legislation like the Australian Large Scale Renewable Energy Target? See here: http://www.cleanenergyregulator.gov.au/RET/About-the-Renewable-Energy-Target/How-the-scheme-works/Large-scale-Renewable-Energy-Target
If so, you as electricity consumers are (perhaps unwittingly) subsidising ‘renewable’ generators at 100%! This iniquitous legislation has been spread from the EU to other wsetern nations since the mid-1990s. It is a cunning ‘not a tax, not a subsidy’ scheme that forces electricity retailers to buy almost all the ‘clean energy’ being generates, and also to buy a ‘clean energy certificate’ for every megawatt of this ‘clean energy’ that they buy. As the ‘market’ for these certificates is rigged by the legislation, in Australia these certificates cost more than a megawatt of base load electricity, pushing up the wholesale price of energy significantly, but in a way that it appears that base load generators are the cause, rather than the RET. As we Aussies say ‘that is as cunning as a rat with a gold tooth’. This iniquitous legislation will guarantee that base load generators progressively become bankrupt, and it will appear that they are the cause, rather than the RET and the hidden 100% (yes 100%!) hidden subsidy that ‘renewables’ get from the RET, paid for by mugs like me through this hidden burden on their domestic electricity bills.
Neat isn’t it? Fossil fuel generators subsidise fickle whirlygigs for their fixed investment costs in order to dump on them. Normally the ACCC would be all over one of the purest forms of dumping imaginable but instead we get Lord Nelson’s telescope.
What would be most interesting would be the times when the wind was at a minimum, rather than the total (or average) for the month.
“… results are as predicted – shocking.”
With so little electricity being generated, the results can hardly be “shocking”?
In Germany CO₂ output for 2009 was 905 million tons, after investing 100’000’000’000.- Euro in wind and solar
( Energiewende ) the CO₂ output in 2018 dropped dramatically to: (drumroll) 905 million tons!!! What a great success!! weiter so!!
Fuel cost for the diesel generator is the issue, not capitol cost. I don’t know how much fuel is needed, but add that cost.
NZ has the right Prime Minister to really get her teeth into this issue.
It is something she has in common with Occasional Cortex.
When you think about it they are way too similar. Wouldn’t want a BJ from either of them.
I encourage everyone interested in wind power to check out this link.
Also everybody with a sense of humour.
Especially a nerdy sense of humour.
By the way NZ hydro construction – very impressing :
https://www.google.com/search?client=ms-android-samsung&ei=zHCCXLvMNejPrgSc2IrgCg&q=tv+documentary+new+Zealand+hydro+construction+&oq=tv+documentary+new+Zealand+hydro+construction+&gs_l=mobile-gws-wiz-serp.
– and not powered by windmills.
I used to live with someone who worked for one of the power companies, I don’t recall now however, he used to calculate how far one of the dams, Clyde I think, would move in an earthquake. He said, paraphrasing a bit from memory…”…the dam was made to be able to move up to 6 metres on either axis (X, y or z)…”
Pretty impressive.
Anthony, data of individual NZ windfarms.
Hopefully appropriate:
https://www.google.com/search?q=data+on+individual+new+Zealand+windfarms&oq=data+on+individual+new+Zealand+windfarms&aqs=chrome.
Made a plot from within LibreOfficeCalc. It is very crabby and I will do a more serious one later. I just wanted to see the flucturations, because the average production is in reality not a very useful figure, it is the min production that is interesting, as you need to maintain on-demand capacity for consumption minus wind production.
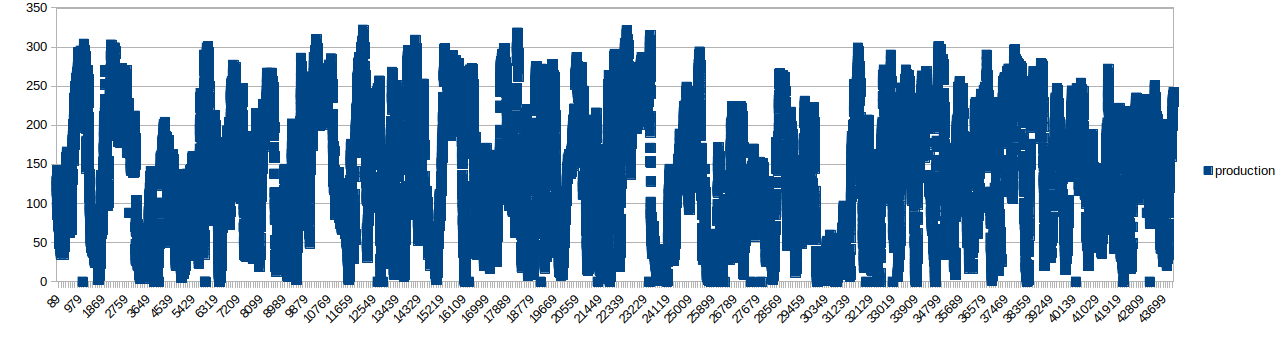
Wow, now there’s some consistency of output!
Thanks, Carl.
But on your next plot, could you please label both axes, and select either line or bar graph type?
Or explain why your selected graph style was chosen.
I’m embarrassed to ask you to do more work, but until you do, I can’t explain to others what you’ve achieved there.