Abstract
Jean‐Louis Le MouëlFernand LopesVincent Courtillot
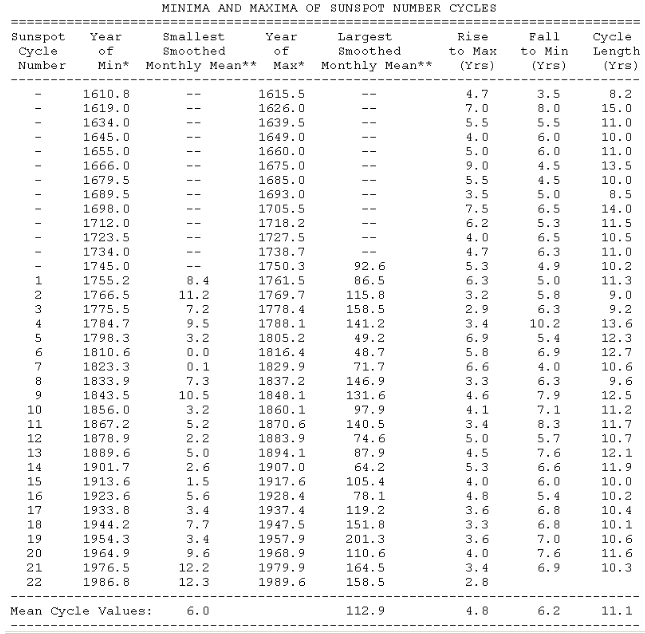
We first apply singular spectrum analysis (SSA) to the international sunspot number (ISSN; 1849‐2015) and the count of polar faculae (PF; 1906‐2006). The SSA method finds 22, 11 and 5.5‐year components as the first eigenvectors of these solar activity proxies. We next apply SSA to the ten Madden‐Julian oscillation (MJO; 1978‐2016) indices.
The first, most intense component SSA finds in all MJO indices has either a period of 5.5 or 11 years. The longer‐term modulation of amplitude is on the order of one third of the total variation. The 5.5‐year SSA component 1 of most MJO indices moreover follows the decreasing amplitude of solar cycles. We then apply SSA to climate indices PDO, ENSO, WPO, AAO, AMO, TSA, WHWP, and Brazil and Sahel rainfalls. We find that the first SSA eigenvectors are all combinations of rather pure 11, 5.5 and 3.6‐year pseudo‐cycles.
The 5.5‐year component is frequently observed and is particularly important and sharp in the series in which it appears. All these periods have long been attributed to solar activity, and this by itself argues for the existence of a strong link between solar activity and climate. The mechanisms of coupling must be complex and probably non‐linear but they remain to be fully understood (UV radiation, solar wind and galactic cosmic rays being the most promising candidates).
We propose as a first step a Kuramoto model of non‐linear coupling that generates phase variations compatible with the observed ones.
The paper is, unfortunately, paywalled.
https://agupubs.onlinelibrary.wiley.com/doi/pdf/10.1029/2018JD028939
Willis, 4 1st read:
https://www.google.com/search?client=ms-android-samsung&ei=T8xyXOa6ENyEk74Py5mm4Ak&q=continental+4+shift+system&oq=4+shifttsystem&gs_l=mobile-gws-wiz-serp.
Ever worked in your life, time,
Willis.
___________________________________________________
We speak at eye level.
Click on my name to read my name
to read my take on this
Summertime Blues
Eddie Cochran
I’m gonna raise a fuss, I’m gonna raise a holler
About a-workin’ all summer just to try to earn a dollar
Every time I call my baby, try to get a date
My boss says, “no dice son, you gotta work late”
Sometimes I wonder what I’m a-gonna do
But there ain’t no cure for the summertime blues
Well, my mom and pop told me, “son, you gotta make some money”
If you want to use the car to go ridin’ next Sunday
Well, I didn’t go to work, told the boss I was sick
“Well, you can’t use the car ’cause you didn’t work a lick”
Sometimes I wonder what I’m a gonna do
But there ain’t no cure for the summertime blues
I’m gonna take two weeks, gonna have a fine vacation
I’m gonna take my problem to the United Nations
Well, I called my congressman and he said “whoa!”
“I’d like to help you son but you’re too young to vote”
Sometimes I wonder what I’m a gonna do
But there ain’t no cure for the summertime blues
Songwriter: Eddie Cochran / Jerry Neal Capehart
Songtext von Summertime Blues © Warner/Chappell Music, Inc
https://youtu.be/YXcYZsqkZ-g
Fits well with the old Creedence climate song:
https://www.bing.com/search?pc=SUWI&form=AMZNS2&q=have+you+ever+seen+the+rain+song
We propose as a first step a Kuramoto model.
≠=========
This is interesting because it ootentially provides an exact mathematical solution to a nonlinear problem.
If correct it could be a big step forward as more traditional approaches are quickly overwhelmed by approximation errors.
Yes, the data used may be suspect. Data almost always is. What strikes me as important is the possibility of improving the underlying mathematics in climate forecasting.
To me it makes much more sense to see events in terms of linked cycles rather than cause and effect. The chicken and egg for example.
Now. Can anyone prey tell the difference between
Study: A Solar Signature in Many Climate Indices
AND
Study: NO Solar Signature in Many Climate Indices
WHEN the decision is not 0/1 but “Many”.
You’re a witch master, Willis. Annoying.
Ever been. Disgusting.
Willis and Leif Svalgaard are usually like two peas in a pod. What happened to Leif?
Good question. I speculate he is looking at Mike Wallace’s stuff from a week or two ago. Or playing with grandchildren.
============
He’s probably too busy to get into the same old arguments with the same old people. But I think he still reads these articles on the Sun that are here.
There is a very strong solar signal in the AMO, the puzzle is in explaining the phase shifts.

But the power spectrum shows some peaks with periods of 9.0 and 10.1 years, too short for solar activity.
https://www.researchgate.net/figure/Maximum-entropy-power-spectrum-and-Lomb-periodogram-estimates-of-A-the-Atlantic_fig5_258774394
Maybe lunar tidal bore cycle, about 9 years period.
https://www.severn-bore.co.uk/bore_cycle.html
So around each sunspot minimum AMO anomalies are systematically colder during the cold AMO phase, and warmer around each sunspot minimum during the warm AMO phase. With half a solar cycle transition period between the warm and cold phases. Spectrum analysis is an ideal way to totally obscure this intriguing alternating phase relationship, and to fail to understand how the Sun drives the AMO.
https://www.linkedin.com/pulse/association-between-sunspot-cycles-amo-ulric-lyons
A phase shift also involves a frequency shift, which will be accurately captured by spectral analysis using a Fourier transform. The absolute value of the complex transform will indicate the signal energy at each point in the frequency spectrum. The argument of the complex value returns the phase angle.
If there is a strong 11 year component in the SST record, as you claim, then it will certainly show up as a peak in spectrum with period of 11 years, because any real valued function is accurately decomposed into frequency components by the transform, and then reconstructed by the inverse transform without loss of information.
I did not claim a strong 11 year component in the SST record. The AMO anomalies appear to be constrained by solar cycles in each AMO phase, and with the phase shift occurring within half a cycle. That rules out any continuous ~11 year cycle through the series. I won’t take your word for what spectral analysis can reveal without knowing how it functions.
There were in fact several cycles around 10 to 10.3 years length between the centennial solar minima.
The AMO is just a detrended SST anomaly, so you did, in effect, make that claim. I suggest you read up on Fourier analysis before proceeding any further.
I never mentioned 11 years, you did. I already knew that many solar cycles are nearer to 10 years. A spectral analysis is a pointless recreational exercise as the cycle length is variable. What matters is that the AMO anomalies remain constrained by each cycle, according to its length, excepting where the phase shifts occur.
A warm AMO phase begins from 1924, and the next warm phase begins from 1995, 71 years ahead. Count the solar cycles, there are seven, covering 73 years.
Willis, there are under 7 billion people
2 Johann Wundersamer.
After me, my family branch will die out.
At least I want to end my life in dignity.
After 48 years of paid dues, I am now in “Corridor Pension” and need not be accused of anything.
Certainly not from you.
It’s degrading to have to say that.
Wriggle matching at its best. Take data on the wriggle cycle of a baby elephant’s trunk. Take data on the wriggle cycle of a baby giraffe’s tail. Use the same technique as the above paper and then announce that they are related in a cause and effect way. All of course without plausible mechanism. The authors of the paper engage in low hanging fruit. How the hell does this stuff get press!
May I remind the readers here that we are only concerned about weather pattern variation outside of the Malanchovotch Cycles, and that is sustained longer than a season. The only way that can be done is through long term changes in semi-permanent and temporary atmospheric pressure systems. Changing these intrinsic atmospheric systems that are teleconnected to oceanic cycles and meandering currents would take an extraordinary extrinsic system that has enough energy in its changed state to at least tip the intrinsic Earth systems to force them into a different state and keep them there.
To “feel” the energy needed, take a jet ride in the jet stream but in the opposite direction of the jet stream. The power needed to redirect that system is very obvious as your fuel gauge quickly races to 0. Turn the jet airplane around the other way and that same jet stream will turn your ride into a record breaking one.
So color me unimpressed with the idea that a tiny change in W/m^2 would have sufficient energy to even change the flight pattern of a butterfly.
“Malanchovotch”
? !
Sorry about the mashed spelling. Following my run in with a West Nile infected mosquito, my spelling has deteriorated immensely to the point that it takes too much time to check on these kinds of words. And at 62, the fact that I survived West Nile virus so far, makes me less concerned about the little things.
West Nile? Damn, girl, you really know how to party!
w.
It kicked my ass hard! Memory loss, tremors, speech and language issues, the list is long. So folks, cover up and use repellent! The damn thing bit me 4 times right on my left cheek directly into my trigeminal nerve, at night, in my bedroom, while I slept. I am lucky to have survived. It’s in all states, in all countries, and mutating. Even if your local health department says there is no evidence of infected bugs, DO NOT BELIEVE THEM! Trust me, chemicals on your skin is far better than living with brain damage.
Glad you made it through OK, Ms. Gray, and thanks for the warning.
w.
I’m sorry to hear what happened, with the hindsight I wouldn’t have made remark.
Tanks for the warning, hope you will fully recover soon.
all the best.
Vuk
The next 14 months should be the heart of the current solar minimum, imo. SpaceWeather is showing that 70% of 2019 has so far been spotless. During the last solar minimum in 2008/09 spotless days came in at 73% for 2008 and 71% in 2009. Is this year going to have a higher number of spotless days in it? …http://www.spaceweather.com/