Mike Wallace writes about his new paper, with some references to his previous posts here:
First, a post on streamflow forecasting using solar cycles for high altitude catchments.
Second, a post on the synoptic scale quasigeostrophic continuum. Third, a piece on atmospheric moisture waves.
The new paper covers other directions as well, but perhaps of greater interest is its identification of a different ENSO parameter which ties everything together, namely the trade wind velocities at 800 mb across the western equatorial pacific. Until this point, solar climate researchers have not been able to identify a ‘bottom up’ or ‘top down’ solar cycle signature. The intermittent evidence challenged a comprehensive picture. This paper identifies a lagged solar cycle
signature from the bottom through to the TOA across the footprint of note.
The paper is here:
https://www.tandfonline.com/doi/full/10.1080/02626667.2019.1567925
Michael G. Wallace, Department of Nanoscience and Microsystems Engineering (NSME), University of New Mexico, Albuquerque, NM, USA
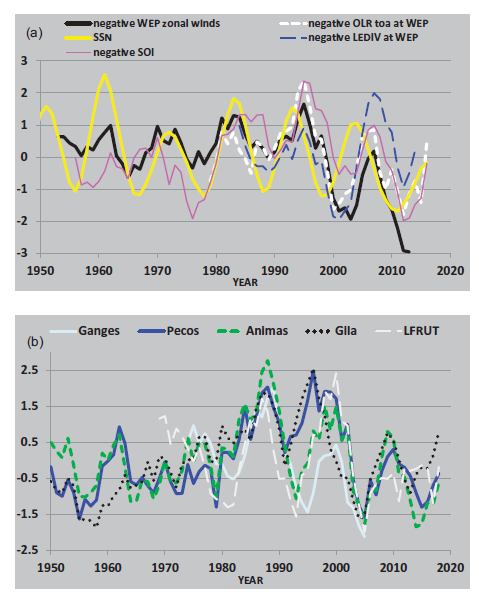
Trade winds localized within the Western Equatorial Pacific express lagged and statistically significant correlations to sunspot numbers as well as to streamflow in rivers of the Southern Rocky Mountains. Both correlation sets were integrated in a linear regression analysis to produce relatively accurate sub-decadal streamflow forecasts for an annual and a 5-year average. In comparison to the autocorrelation technique, the prototyped method yielded the highest correlations, the highest goodness-of-fit scores, and the lowest root mean squared errors, for both the 5-year average and the annual average assignments. Of all of the cases examined, the highest Kolmogorov-Smirnov test scores between observation and prediction were found for the single solar-based forecast 5 years in advance for the 60-month average streamflow of the Animas River in New Mexico.
From the paper:
Summary and conclusions
Considerations of past research regarding solar cycles, Hadley and Walker circulation patterns, and streamflow characteristics of several mid-latitude, high-altitude watersheds have pointed to the potential for improved multi-annual to sub-decadal forecasting of streamflows in targeted locations. Such conditions appear to apply to
Northern Hemisphere watersheds of the Himalayas as well as the Southern Rocky Mountains of the Western USA.
Conditions also appear favorable in some Southern Hemisphere watersheds of the Andes, with the caveat that forecast spans are expected to be shorter in potential. The initial examples studied do not yet define any limit throughout the American Cordillera.
In the development of these conclusions, a set of correlations and linear regressions were explored for key sequential features based on previous published research and currently available solar (SSN), trade wind (TWWP), outgoing longwave radiation (OLR), geopotential height (Z), divergence of latent heat (LEDIV), and other indexes. Equivalent exercises were applied towards potential connections of some of those parameters to streamflow datasets for candidate streams of the RockyMountains. A two-stage regression-based forecasting approach was then applied to exploit some of the highest lagged correlations that were identified. The forecasts were compared to forecasts for the same streamflow
datasets via a conventional autocorrelation technique.
The training forecasts based on the new CRMA applications were generally the most accurate of all featured methods, for the series considered under a 5-year trailing average. Through a sequence of solar and trade wind regression exercises, forecasts for this set were advanced as far as 6 years into the future. The forecasts under the new method were also found to be more accurate than the conventional method under an annual average with a 2-year lead forecast approach, although the fidelity of all results was diminished in comparison to the 5-year average set of forecasts. An additional but limited investigation demonstrated high-fidelity 5-year trailing average forecasts for the Animas River based directly on solar cycles taking place 5 years in advance.
The success of the proposed methodology is expected to apply to other regions meeting the target criteria, including the Ganges River in India and the Rio Biobío in Chile. Subsequent exploration of monthly correlations between the TWWP and sunspot cycles suggests that, for appropriate locations, advances of hydroclimate forecasting accuracy with monthly resolution yet multi-annual lead times may also be possible through the new technique.
An old paper (1972) about the relationship of sun activity and climate, a review paper by Walter Orr Roberts
In the meantime, the Pacific Ocean skin temperatures have cooled dramatically over the past 3 months, especially around all of Australia, western and central northern Pacific, central southern Pacific, equatorial Pacific and especially off Argentina and west.
The air temperature lag from ocean cooling is months, so let’s see how we go from here. If this continues, global temps are going down and even Stephen Mosher won’t be able to hide it (as much as he will try).
There are lot of papers around finding relationship between sun activity and riverflow, a short look offered me Japan, China, Germany, Italy, South America…
Why are some stream systems correlating, but not others? Do streams have some intrinsic mechanism allowing them to choose to be in step or out of step with a forcing?
Geoff
Javier February 14, 2019 at 1:51 am
Pass. No idea.
Thank you kindly. Having the full data info lets me see what you’ve done.
Well … no. Here is an overview of what you’ve done. Curiously, your analysis suffers from the same problems as in the head post, Bonferroni and smoothing.
The vertical blue lines show the 10% of the ONI data that you’ve selected for your analysis. Because you are analyzing subsets, you need to apply the Bonferroni correction. It will be on the order of 10 because you’ve selected a tenth of the data.
That means to find statistical significance, you need to find a p-value of less than 0.05 / 10 = 0.005 … and your correlation is far from that.
Curious fact: If you’d picked the period starting ~14 months earlier all the way through, with the effect of shifting the blue vertical lines in the graph above 14 months to the left, the ONI average would be +0.6 instead of -0.6 …
Second, autocorrelation. Your ONI and sunspot data both have high Hurst coefficients. This leaves them with an effective N of only about 3 data points … huge problem.
Finally, there is no correlation between your selected smoothed SSN and the selected ONI, viz:
Call:
lm(formula = oni ~ ssn)

Residuals:
     Min       1Q   Median       3Q      Max
-1.15421 -0.45153  0.09752  0.34907  2.05181

Coefficients:
              Estimate Std. Error t value Pr(>|t|)
(Intercept) -6.565e-01  2.127e-01  -3.087  0.00285 **
ssn          6.509e-05  1.673e-03   0.039  0.96907
---
Signif. codes:  0 ‘***’ 0.001 ‘**’ 0.01 ‘*’ 0.05 ‘.’ 0.1 ‘ ’ 1

Residual standard error: 0.6143 on 74 degrees of freedom
Multiple R-squared:  2.046e-05,	Adjusted R-squared:  -0.01349
F-statistic: 0.001514 on 1 and 74 DF,  p-value: 0.9691
p-value of 0.96 …
Regards,
w.
Until recently, all the predictions foretold with certainty El Niño. However, they did not take into account the minimum of the solar cycle.
Sorry.
Until recently, all forecasts predicted with great certainty El Niño. However, they did not take into account the minimum of the solar cycle.
“ren February 14, 2019 at 3:12 pm
Until recently, all forecasts predicted with great certainty El Niño. However, they did not take into account the minimum of the solar cycle.”
_______________________________________________
Right, ren.
But there’s 2 different “forcasts”:
– La Niñas ‘forecast’ the WEATHER for the next ~7 years.
– sunspot minima predict DROUGHT YEARS every ~ 11 years.
_______________________________________________
Regards. Hans
No, I need not. The Bonferroni correction is to correct in multiple testing for the probability that one of the tests gives a positive. In this case there is a single hypothesis that would not be proven correct for a Niña in one of the intervals. It requires a Niña in all intervals, and therefore the Bonferroni correction is not adequate.
Not curious at all. By doing that you move to the solar minimum when Niño conditions predominate. It is further proof that ENSO is under solar control.
Why there should be correlation between them? The solar effect detected on ENSO is that at certain times during the solar cycle the probability is strongly skewed towards a certain outcome. And the statistical analysis confirms it despite your arm waiving.
steven mosher February 14, 2019 at 2:38 am
Steve, always glad to hear from you.
Please correct me if I’m wrong. My understanding is that a reanalysis model is a computer model that is constantly “nudged” back on to the right path by inputting whatever data we might have. The data comes from a host of sources.
It takes all that various data as input, and from that, the computer makes its best guess as to what is happening where there is no data. However, the output is model output, NOT data.
And as Pat Frank said, with different parameters we can get different answers using the exact same data as input. That’s why NCEP and NCAR and various versions of reanalysis model output exist.
Next
I understand all that. But the area in question, 135E to 170W and 10°N/S, gets very few flights. It’s not on a main path to anywhere. And the few it has will be way overhead. You don’t fly down low over the ocean.
What you quoted from Pat is true, as I pointed out. Not sure what else you mean.
Both to me would have value. And you are right, if I did that I could see their input observations.
However, that still says little about their output …
Thanks,
w.
Until recently, all forecasts predicted with great certainty El Niño. However, they did not take into account the minimum of the solar cycle.

Steve, an interesting post here. Money quote:
Regards,
w.
Reanalysis is the best of both worlds. Real data keeps the models anchored on reality. The modelling gives a huge flexibility in the type of questions that can be asked. Unlike temperature datasets it is almost impossible to tamper with reanalysis as the data is almost real time, and as weather forecast is done through it, it is the type of data that lives depend on. Besides one of the main reanalysis tools is by ECMWF, a consortium of over 30 countries not susceptible to national politics.
Reanalysis is rapidly becoming the tool of choice in science. How could anyone do research based on GISS when they can change the temperature of the past and render your research invalid? GISS is useless, redundant and unreliable, and should be terminated.
With extreme prejudice.
And its perpetrators sent to polar regions to collect actual data instead of making them up in NYC.
I couldn’t agree more Javier, but I’ll try. I agree! The reanalysis work I explore already independently corroborates (at least to me) jet streams, polar vortexes, the Equatorial Trough, isotopic atmospheric hot spots, and of course the numerous solar connections to climate featured in my paper.
Mike W.
Lol. Researchers such as Ahluwalia 2012 in the Indian Journal of Radio & Space Physics. Was that the best citation you could find? Just by reading WUWT from time to time you might know about Valentina Zharkova who is a Media darling predicting an approaching Solar Grand Minimum in the style of Game of Thrones’ “Winter is coming.” Problem is she is wrong and a SGM is not coming, but anyway, Ahluwalia? Seriously?
And Dalton or Gleissberg minima are not Solar Grand Minima. I don’t doubt your great expertise in hydrology, but you should have researched the solar part a little bit more, or have somebody that knows that part read your manuscript. Anybody with a little knowledge will know you have no clue. If you want to know what a solar grand minimum is you have to read Usoskin.
Thanks Javier, I welcome this opportunity to clarify.
One reason I chose to cite Dr. Harjit Ahluwalia was because he was my Ph.D. advisor at the University of New Mexico. He remains the only scientist at the university that I know of, other than myself, who ever publicly opined that greenhouse gases may not hold the answers (at least I think he did, since he once sponsored Dr. Fred Singer to speak here). As a condition of my acceptance as his protege, he directed me to stop looking into interstellar dust and the heliosphere (and ice ages) and rather focus on terrestrial modern and contemporary hydroclimate signatures with an eye to any possible solar cycle correlations. That led directly and ultimately to my paper. Many many hours of mine over several years were spent learning about his views on solar cycles, and following up to read numerous solar related papers, ranging from the theories of the solar dynamo, planetary orbital – solar cycle theories, solar winds, and much more. So I have indeed read many scientific papers on solar cycles and their potential causes, and I plan to continue to read in that direction as possible.
From that experience, I do know that many solar researchers engage in predicting the next significant solar minimum, and he is among them. I think citing him is accordingly well justified.
I do regret that I didn’t define the terms as accurately as I could have and I thank you for bringing that to my attention. Perhaps my advisor would have caught that, but he declined to review the drafts, as a divide grew between us that I have never understood. Ultimately we parted ways while my paper crawled through a 2 year long, 4 cycle, anonymous peer review. In any case the jargon deficiency doesn’t undermine anything technical about the paper. To show how behind I may be on this minima topic, I have never heard of Valentina Zharkova either. I’ll check her out!
I do happen to enjoy entertaining a notion regarding the Maunder Minimum at http://www.abeqas.com/the-maunder-minimum-and-the-inquisition/
Thanks again for your time and comments. Are you a scientist? Either way is fine with me but I often find it is helpful in communicating my responses. Most scientists I know would be somewhat less agitated over a jargon correction, but in a feisty blog I understand that it has its benefits.
A similar pattern of the stratospheric polar vortex over North America occurs in years of very low solar activity.
https://earth.nullschool.net/#2019/02/16/1200Z/wind/isobaric/10hPa/orthographic=-80.52,68.51,340
And this is the result of such a stratospheric circulation.

beautiful graphic. But at this point I can’t tell what time frame the animation covers, or the solar activity connection. Perhaps that is within the overall URL? I recognize that the stratosphere in the northern hemisphere is known to correlate to solar activity, so I’m not challenging your statement at all.
During periods of very low solar activity, ENSO remains neutral.

https://www.longpaddock.qld.gov.au/soi/
Johann you are spot on at least for certain areas, and I also appreciate the reference.
My paper also recognizes some regions which are more sluggish and muted in their responses than the high altitude catchments and across the limited WEP.
From NoTricksZone:
http://notrickszone.com/2019/02/15/new-findings-from-german-scientists-show-changes-in-precipitation-over-europe-linked-to-solar-activity/
Laurenz, L., H.-J. Lüdecke, S. Lüning (2019): Influence of solar activity on European rainfall. J. Atmospheric and Solar-Terrestrial Physics, 185: 29-42
Free pdf until March:
https://authors.elsevier.com/a/1YXWZ4sIlkiVhv
Wow that is interesting and strange.
Leif has spent a lot of time and absorbed a lot of grief on blogs in his search for a solar/climate connection. For instance, see three mammoth threads on Climate Audit ~10-12 years ago. Perhaps his absence here on this thread is from a suspicion that a mechanism is finally being explicated. He’s certainly cautious enough not to jump in precipitately when he’s not sure.
Nonetheless, evidence accumulates, and that European study is nicely timely.
Good luck, Mike, and happy trails to you.
==============================
Thanks kim! I’m looking forward to learning more about Lief’s topics (what is his posting name?) and this European study. I’m now communicating with those authors as well.
The surface temperature of the equatorial Pacific indicates the absence of El Niño.

The cyclone, which is forming in the western South Pacific, will reduce the surface temperature at the equatorial Pacific.
