web version of column article published in Pacifica Tribune February 13, 2019
by Jim Steele

Local sea levels appear to rise when ocean volumes increase, but also when the land sinks. Scientists increasingly warn that coastal cities are sinking much faster than ocean volumes are rising. Pumping out groundwater not only causes lands to sink, it increases the oceans’ volume. China’s Huanghe Delta is sinking 10 inches a year. Southeast Asian cities battle sinking rates of 1.2 to 2.4 inches per year. Regions around Houston, Texas had sunk 10 feet by 1979; a disaster waiting to happen where hurricanes commonly generate 15-foot storm surges. Likewise, New Orleans was doomed by sinking 1.4 inches per year. Built on marshland, San Francisco’s airport sinks 0.4 inches per year.
In contrast, ocean warming plus added glacial meltwater are estimated to have only added 0.06 inches per year to sea level from 1850 to 1990, punctuated by decades that accelerated sea level rise to 0.14 inches a year. Still, that fastest rate of modern sea level rise remains only one-tenth of New Orleans’ sinking rate.
Better water management could minimize the primary causes of sinking coastlines. But even if climate policies could reduce our carbon footprint, natural sea level rise that began in the 1800s will likely continue. To what degree rising CO2 concentrations are accelerating sea level rise is still debated. Prominent climate scientist Dr. Michael Mann gives scant attention to the critical issue of sinking lands. He prefers scary models supporting his theory regards a rising CO2 effect on sea level, “We’re talking about literally giving up on our coastal cities of the world and moving inland.” Likewise, at California’s local coastal planning meetings, Mann’s followers similarly advocate moving inland, otherwise known as “managed retreat”.
Intriguingly, San Francisco and North America’s west coasts have not experienced a rising sea level trend since the 1980s. Equally curious, using the average estimates from all researchers the 2007 Intergovernmental Panel on Climate Change (IPCC) reported known contributing factors only explained 40% of 20th century sea level rise. So, there is still much to learn.

So, does Mann’s disaster scenarios represent an extreme climate doomsday cult? Or is he offering sage scientific advice we should heed?
Some researchers and politicians argue any accelerating rate of sea level rise must be the fingerprint of a human contribution as some models predict. But that is simply not true. In a 2007 peer-reviewed paper, On the Decadal Rates of Sea Level Change During the Twentieth Century, researchers reported rates of sea level rise accelerated up to 0.2 inches/year every 10 years, followed by a decade of deceleration. Sometimes sea levels fell. Some of Mann’s followers believe it’s impossible for sea levels to fall in an age of climate warming. But they are ill-informed.

Sea level remains un-changed when the same amount of water evaporating from the ocean returns to the ocean. However, when more rainfall remains on the land, sea levels fall. During the last Ice Age, rainfall stored in ever-growing glaciers caused global sea level to fall by 400 feet. Although those melting glaciers then raised sea level back to its current level, sea levels have yet to fully recover. Large amounts of meltwater that sank into the ground are still flowing slowly but surely back to the oceans.
Furthermore, water need not be stored as ice. When rains fall over land-locked landscapes with no outlets to the ocean, that precipitation similarly returns to the ocean via slow-moving sub-surface flows or evaporation. Rainfall over Nevada that sinks into the ground requires thousands of years to reach the Pacific. A similar fate befalls snowmelt and rainwater entering Lake Tahoe, and melt-water from Sierran glaciers draining into land-locked Nevada. Analyses of global sea level change have yet to fully incorporate the fact that over 13% of the earth’s land surface consists of landlocked basins slowly supplying ancient groundwater to today’s oceans.
Since the 1990s, satellites likewise detected a 10-year cycle of accelerating and decelerating sea level rise. A period of more El Niños followed by more La Niñas likely explains the 10-year accelerated rise followed by a 10-year deceleration. During the most recent deceleration, from 2010 to 2011 a La Niña amplified monsoons carrying above average rainfall into Australia’s landlocked basins. This caused global sea level to fall by nearly 0.3 inches. Amazingly, global sea level fell despite Greenland simultaneously experiencing its greatest ice melt. Conversely, during earlier El Niños, above average rains fell back onto the ocean, accelerating sea level rise.
There is still no consensus regards Greenland and Antarctic contributions to sea level. There is also significant debate regards what adjustments need to be applied to satellite data. However, that discussion must wait for part 2. Until then, I urge local planning commissions to wait at least 20 more years for more data before “giving up on our coastal cities of the world and moving inland”.
Jim Steele authored Landscapes and Cycles: An Environmentalist’s Journey to Climate Skepticism
In places which are “tectonically inert,” neither experiencing uplift nor subsidence, annual sea-level rise is a consistent 1 to 1.2 millimeters per year. Nyborg’s harbor, Slipshavn in Denmark is a good example, along with Newlin, Great Britain which is GPS validated for greater than a decade. On the Pacific coast in Canada, Prince Rupert is also GPS validated. All show a net sea-level rise of 1 to 1.2mm/yr. with an unchanging rate over 100 years in duration. All while CO2 has accelerated over 40% since 1880.
No CO2 induced acceleration can be found in any tide gauge, anywhere on the planet. CO2 induced sea-level rise acceleration is simply a myth. Please report it on WUWT if you can find it!!!
Over the period from 1950 through 2016, tide gauge data from eight of eleven California stations (La Jolla, Port San Luis, San Francisco, Alameda, Point Arena, Point Chicago, North Spit, and Crescent City) show a slight deceleration in the rate of relative sea level rise, while only San Diego, Los Angeles, and Santa Monica show a slight acceleration in the rate.
Wayne Raymond
February 13, 2019 at 10:35 pm
It is a tectonically active landmass so I guess that could explain much of the variability.
Like global warming it must be put into context otherwise reduction or increase is meaningless. Tectonics has a beginning and an end. You could be loiking at a tectonic origin. I do not know but thatmust first be considered otherwise it becomes a slippery slope towards the standards (or lack thereof) set by the climate industrial complex.
See, we should be asking these kinds of questions all the time. there is no answer for them. So tired of the same old arguments – I think we need to ask what gives *them* any more right to determine the following than someone else? If they don’t like the climate where they are, they need to move.
What is the “correct”, “right”, or “ideal” global mean for the planet?
Who gets to decide that and why?
What is the “correct”, “right”, or “ideal” sea level for the planet?
Who gets to decide that and why?
What is the “correct”, “right”, or “ideal” amount of ice (sea and glacial) for the planet?
Who gets to decide that and why?
What is the “correct”, “right”, or “ideal” amount of CO2 for the planet?
Who gets to decide that and why?
first question what do we need to mesure this value ?
second question , do we have that means ?
If they cannot be answered correctly , you just got ‘guess work ‘
You know, I see yet another question here: Why do we need to measure this value to begin with, except as a matter of scientific curiosity? The Earth has been regulating itself on a very regular schedule since long before we came down from the trees. We are demonstrably no more “in charge” of that process than we were when we were driving oxcarts and living in dirt-floored huts, attributing the changes in the weather to Angry Gods punishing our sins. Now that same idea is just being sold with a “scientific” veneer.
The same kind of idiocy is brandished daily on the “tech” pages of the WSJ and other papers. Certain people now think they “need” an “app” to tell them when their bladder is full, a function nature has taken care of forever–they call it an “autonomic” nervous system for a reason. They also need their addictive exo-brains to make sure they’re staying between the lines of everything “experts” deem they must do. Those of us over age 50 remember a world before “experts,” when listening to the wisdom of your parents and grandparents, and maybe your history teacher, made it obvious we’re in control of precious little and it’s futile to worry about much of what we used to consider, quaintly, “in the hands of God!”
Any politician running on claims they can change the weather is choosing to beclown themselves.
https://www.youtube.com/watch?v=xPkZXrFs5QY
Yesterday’s Mann
I love Jim’s articles. I hope he plans to consolidate them into book form in the near future.
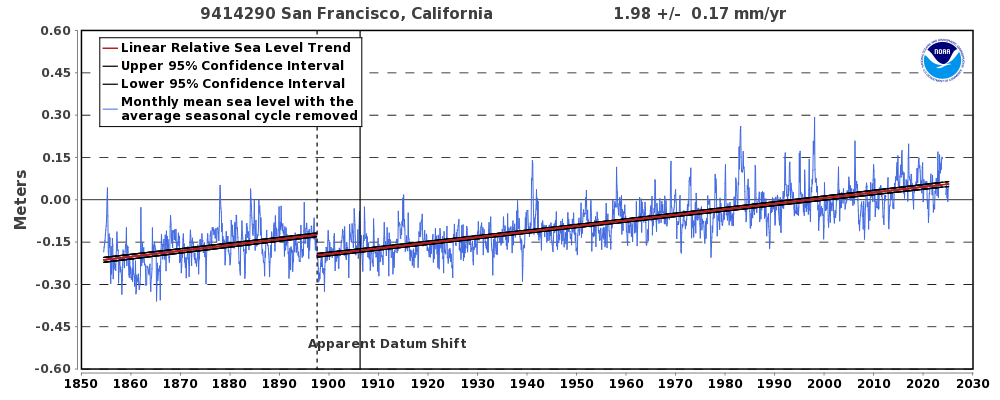
https://tidesandcurrents.noaa.gov/sltrends/sltrends_station.shtml?plot=50yr&id=9414290
Why not show this?
CO2 has another curve-sorry!
Why indeed?
A) It does not contradict Dr. Jim Steele’s article.
B) Why does the chart you show stop at 1990?
C) The chart you link to shows SLR declining since 1970 through 1990. Are you claiming that is CO₂ linked?
Fascinating. A big dip in early 1900s almost centered around the great SF earthquake. A second smaller dip was around 1952, or so, so I looked to see if there was an earthquake in that timeframe. This is what I found:
July 21, 1952
Earthquake near Bakersfield measured 7.7 on the Richter scale and did enormous damage in Kern County and vicinity. The tremor was second only in intensity to the Great Earthquake in San Francisco.
Looks like the rise a fall of sl matches tectonic activity very well; CO2, not at all.
There is certainly no correlation with human CO2 emissions:

Since Global Warming has basically remained statistically unchanged since mid-1996, (interrupted by two Super El Nino Events: 1997/98 and 2015/16) the next boogie man CAGW cultists have to propagandize is Catastrophic Sea Level Rise (CSLR)…
Many peer-reviewed papers show that since the end of the Little Ice Age in 1850, SLR has been stuck at around 7″~8″/century, and so far, the 21st century is close to this trend…
CAGW advocates blame Antarctic and Greenland Land Ice Melt for most SLR, however, alllllll the way back in the horse and buggy days of October 2015, NASA reported that Antarctic Land Ice Mass has been INCREASING by around 80 billion tons/year…. Greenland’s Land Ice Mass also INCREASED 40 billion tons in 2017 and may have also increased slightly in 2018…
True to form, NASA recently submitted a new report in 2017 proposing Antarctic Land Ice Mass has been decreasing dangerously fast since the 1980’s….. Oh, my… which of NASA’s Antarctic reports is correct??
Next year, a 50-year Grand Solar Minimum will start, which many scientists believe will lead to many decades of global cooling. In a couple of years, the Pacific, Atlantic and Arctic oceans will all be in there respective 30-year cool cycles, which have always lead to falling global temps.
If these two natural events do cause global cooling, then SLR will very likely start slowing down, and may even start to fall slightly.
The next 5 years or so should be very interesting and entertaining to watch.
Does Mann have ‘followers ‘? Should they be named and shamed?
Mannequins?
Does Mann have ‘followers ‘?
Army of flying monkeys.
Mann from the top of his Ivory Tower — “Fly, FLY, my pets!”
Over pumping of groundwater in central London leading to significant settlement of older un-piled structures, including the coping level of the Thames Embankment river wall, was a known problem 50 years or more ago. This was one of the reasons for building the Thames Barrier Flood Defence System.
Are there recorded checks on land levels on local datum level markers in papers “establishing” sea rise levels? I think not!
Surely an indicator of any significant change in sea level impacting the River Thames or perhaps other rivers would be whether the Victorian installed drain and sewage system would be failing? While there have been major works to enlarge the system for modern volumes of waste water, I have nowhere seen any claim that rising river or sea levels are stopping or backflowing the storm drain or sewage outfalls. This despite the stopping of the once regular dredging of the river. Nor when I am in London and it is raining heavily do I see all the storms drains flooding out the streets.
Of course, the engineers who built the Thames Barrier did so because they knew south east England was sinking relative to sea levels, not the other way round so much, because of isostatic recovery from the last ice age. Not a fact to trouble the green hysterics slim knowledge base.
Mann’s disaster scenarios represent an extreme climate doomsday cult? Or is he offering sage scientific advice we should heed?
Would Man even known what ‘scientific advice’ advice even is ?
Meanwhile like so much in area the data we is have ‘bettre than nothing ‘ compared tp data with need to justifty such values and the claims made on them. Its funny how a standard that would mean a ungraduated essay would be failed , is seen to be perfectly OK when it is seen in use by professionals scientists complete with PhD’s
Jim,
Many thanks for another interesting article. I hadn’t thought much about all that water being trapped in landlocked basins or the vast amounts of time needed for it to track back to the seas.
My local paper published my letter which is in line with Juim’s post-
“A recent article in the Times Record said that a study had shown Maine land values were decreasing becasue of tidal flooding. As a past Chair of the Bath Board of Assessment Review I questioned the findings since we had not seen any challenges to the assessed value of shoreline properties which would have been expected if the issue was real. The truth is probably that the study only picked properties that were in the flood zone that decreased in value. Any homeowner knows that there are more than one reason property values decrease. When you link things this way in a study, you are prone to look for correlation and dismiss everything else. Every scientist knows that correlation is not causation. Your alarm clock does not cause the sun to come up, even though both occur about the same time.
Also, the comment-“Sea levels are projected to rise across coastal New England by 1.7 inches in five years and 3.6 inches in 10 years, according to the U.S. Army Corps of Engineers” got my scientific antenna up because they seemed to be exceptionally high.
So I checked the official National Oceanic and Atmospheric Administration (NOAA) records for Portland and they said- “The relative sea level trend is 1.87 millimeters/year with a 95% confidence interval of +/- 0.15 mm/yr based on monthly mean sea level data from 1912 to 2017 which is equivalent to a change of 0.61 feet in 100 years.” That is 7.32 inches in 100 years! The articles numbers are very wrong compared to the reality published by NOAA.
You can check my figures at:
https://tidesandcurrents.noaa.gov/sltrends/sltrends_station.shtml?id=8418150
In a nutshell, we are expected to believe that over a ten year period Bath flood prone property values dropped over 4 million dollars, the most in Maine, because of a NOAA recorded 10 year actual rise in the tide of three quarters of an inch! Not the 3.6 inches in the article which is off by a factor of five!
So we have another 100 years before we see the tide go up by 7.32 more inches. By then you should be able to protect your property value by building a one foot seawall.”
Doggerland was an area of land, now submerged beneath the southern North Sea, that connected Great Britain to continental Europe. It was flooded by rising sea levels around 6,500–6,200 BC. Geological surveys have suggested that it stretched from Britain’s east coast to the Netherlands and the western coasts of Germany and the peninsula of Jutland.[1] It was probably a rich habitat with human habitation in the Mesolithic period,
https://en.wikipedia.org/wiki/Doggerland
How many coastal cities have disappeared just 8000 years ago because of hunter gatherer SUV use?
Does anybody know how Trump achieved that?
He borrowed the Jewish weather machine that also works as a time machine to affect past weather. (sarc)
An article from a few years ago discussing whether Fremantle, Western Australia was going to disappear beneath the waves.
Apparently it’s unlikely to happen soon but if it does it seems people might be to blame, but not for making carbon dioxides but for pumping out ground water.
http://www.waclimate.net/perth-sea-levels.html
I don’t see anyway Freo could ever go under you can run models at 1.8m and it affects a tiny area along the coast area which realistically would be easy to seawall.
https://www.fremantle.wa.gov.au/sites/default/files/sharepointdocs/Climate%20change%20adaptation%20plan-C-000485.pdf
At 1.8m sealevel all the foreshore of Perth, Burswood and most of the areas in South Perth are under water for comparison. The reality is ever it ever came to it you would simply put sea gates for the river in fremantle which would act to protect Perth. That is about the only thing you need to do in Western Australia to combat sea level rise. Beyond that a couple of areas in Busselton/Dunsborough, Bunbury, Albany and Broome are at risk and realistically it is a none issue for Western Australia.
That is why junk reporting like this from the West Australian was roundly criticized
https://thewest.com.au/news/wa/coastal-wa-faces-dire-threat-from-rising-seas-ng-b88482997z
It assumes the stupidity that you would not simply have installed sea gates.
Interestingly the coastline at Busselton, which should be going under the rising seas, is prograding and is about 200m north of where it was in the 1840s!
“…a La Niña amplified monsoons carrying above average rainfall into Australia’s landlocked basins. This caused global sea level to fall by nearly 0.3 inches.”
I’m too lazy to do the math, but it seems to be that we could get lower the ocean levels by another 0.3 inches more effectively with a pipeline from the ocean into Australia’s landlocked basins much less expensively than by building xx,000 wind turbines. What’s that now? Such a plan will only gain us a few years? Well, so would the total summation of all the efforts related to the Kyoto protocols.
I’m not saying such a plan would not be ridiculous. I’m saying that it’s LESS ridiculous than other mitigation plans. It’s just that the ridiculousness is more obvious.
“China’s Huanghe Delta is sinking 10 inches a year.”
But first of all:
China’s Huanghe Delta silts – from start of neolithic times :
https://www.google.com/search?q=China%E2%80%99s+Huanghe+Delta+silts&oq=China%E2%80%99s+Huanghe+Delta+silts&aqs=chrome.
Mr. Steele…Thanks. I enjoyed “Landscapes and Cycles” thoroughly. Your honesty and integrity and courage is commendable. Your clear, focused writing is a gift. Your studies showed me how much actual work it takes, in the face of serious personal criticism to deeply study an issue…and reach supported and clear conclusions. I also support Book 2…and updates to Book 1 would be welcome, too. Thanks again.
During the last Ice Age, rainfall stored in ever-growing glaciers
Snowfall, not rainfall.
In contrast, ocean warming plus added glacial meltwater are estimated to have only added 0.06 inches per year to sea level from 1850 to 1990
Only where the water has warmed. Warming water in the equatorial Pacific doesn’t raise sea level in Anchorage
“Warming water in the equatorial Pacific doesn’t raise sea level in Anchorage”
Because the density of warmer water is less, thus there is no pressure exerted to move the water to Anchorage. Still, the rise is seen on gauges in the Equatorial Pacific.
There are forces that will move surface water around the Earth, you being rather naive.
They would include
1.) Gravity (as the water tries to mound its own mass will force flow).
2.) Tides cause by all the celestial bodies.
3.) Centripetal force from the Earth spin (height changes radius f = mrw^2).
4.) Wind movement which cause waves which displaces water of surface
Well, Anchorage sea level is falling.
https://tidesandcurrents.noaa.gov/sltrends/sltrends_station.shtml?id=9455920
Most large coastal cities were built near river mouths. For obvious reasons: water and shipping. Rivers flow to low-lying areas, tectonically active and sinking. The water removal is only an issue where cities were not built near rivers.
Uh…was New Orleans built near a river? Oh yes. That would be the Mississippi River.
“..Local sea levels appear to rise when ocean volumes increase, but also when the land sinks. Scientists increasingly warn that coastal cities are sinking much faster than ocean volumes are rising. Pumping out groundwater not only causes lands to sink, it increases the oceans’ volume…”
Less ground water pumping and more salt water desalination plants. This seems fairly obvious to me. Video is about desalination plants in Florida:
https://www.youtube.com/watch?v=PtbM2qChfVw.
“..Regions around Houston, Texas had sunk 10 feet by 1979; a disaster waiting to happen where hurricanes commonly generate 15-foot storm surges. Likewise, New Orleans was doomed by sinking 1.4 inches per year…”
If cities like Houston and New Orleans don’t have saltwater desalination plants yet, I suggest they start planning on building them. Never mind throwing money at the climate alarmists.
https://agupubs.onlinelibrary.wiley.com/doi/full/10.1029/2006GL028492
It is a pleasure to read a paper dealing only with “nuts and bolts” and since there is only one author with only 19 references, it must not be group think. Since cited only 109 times, it must not rate very high in the impact factor world. I could believe this partly based on erosion, comes up on average half a foot a century. Such needs accommodation, however, a more rational approach.
This prediction seems to have been proven true. “It seems to me to be evident that the position of a shoreline at any time and place is determined by an exceedingly complicated equation….” from Shaler, N. S. 1895. Evidences as to change of sealevel. Bulletin Geological Society America. 6:141-166. Also from Van Andel and Curray, page 359, in Shepard, F. P., et al., 1960. Recent Sediments, Northwest Gulf of Mexico. American Association Petroleum Geologists. “…but it appears from the evidence of the Gulf Coast that either the rise continued very slowly at a decreasing rate or that the level was essentially constant during most of this period [5000yr].”
I’ve frankly always thought this ‘natural’ thing was a red-herring to start.
The Earth is always a reaction and counter-reaction to the environment and the creatures living and operating within it – the totality of the biosphere – humans are a natural part of it.
Here’s Australia’s CSIRO take on it-
https://www.cmar.csiro.au/sealevel/sl_hist_few_hundred.html
“One of the oldest tide gauge benchmarks in the world is at Port Arthur in south-east Tasmania. When combined with historical tide gauge data (found in the London and Australian archives) and recent sea level observations, it shows that relative sea level has risen by 13.5 cm from 1841 to 2000.”
That’s 0.85mm a year for over a century and a half but less than their best global estimate-
“We have used a combination of historical tide-gauge data and satellite-altimeter data to estimate global averaged sea level change from 1880 to 2014. During this period, global-averaged sea level rose about 23 cm, with an average rate of rise of about 1.6 mm/yr over the 20th Century. ”
Now Australia is a very ancient weathered continent so naturally taking tide gauge results from around the world on land that’s sinking and then consolidating and averaging them you’d expect that higher estimate. But it was when I was walking in Hallett Cove Conservation Park in metro Adelaide that I jumped off their CAGW doomsday meme once and for all after having all those alarm bells ringing with the Climategate emails, the MBH Hockey Stick fudge, the IPCC grey literature debacle, the pause, etc and I was alerted to past sea level rise. The one true proxy for global warming to rule them all and their flaky nature open to manipulation and fanciful interpretation-https://www.ncdc.noaa.gov/data-access/paleoclimatology-data/datasets
What did the proven geological science of the rocks and eroded sedimentary layers at Hallett Cove demonstrate?
“During the Recent ice age about 20 000 years ago,
sea level was about 130 metres lower than today
and South Australia’s coastline was about 150
kilometres south of where Victor Harbor now is.
The ice cap started to melt about 15 000 years ago.
Sea level began to rise and reached its present level
about 6000–7000 years ago.”
(Hallett Cove, Geological Trail brochure, 2010, Government of South Australia, Primary Industries and Resources SA)
Now that could be an average annual sea level rise of 16.25mm a year for eight thousand years and no Nick Stokes, Griff, Michael Mann, IPCC or the man in the moon is going to convince me that was down to aboriginal cooking fires and traditional burnoffs to flush out game. To believe that modern science can extract an anthropogenic CO2 signal out of fractions nowadays of sea level rise compared to that means you are technically illiterate, delusional or lying to me or some combination of the three I care not which. As for your prescriptions based on it doubly so.
Don’t believe Australia is a very ancient weathered continent that isn’t moving around much these past few millenia then try here-
https://cooberpedytimes.com/2008/09/22/ancient-giant-underwater-reef-in-north-flinders/
Australia has a lot of Precambrian rock.
The global Ediacaran biota, which preceded the so-called Cambrian Explosion of animal phyla, is named for the Ediacara Hills of South Australia.
Artist’s conception of an assemblage of Ediacaran biota.
Parts of Christchurch NZ near the sea dropped 3ft in the FEB 2011 earthquake flooding along the rivers is very common now.