WUWT regular David Burton writes:
One of the most pernicious examples of disinformation promoted by the Climate Industry is the claim that manmade climate change from CO2 emissions threatens agriculture and “food security.” That’s the exact opposite of the truth. CO2 is “plant fertilizer,” and hundreds of agricultural studies have shown that higher CO2 levels are dramatically beneficial for agriculture, to levels far above what we can ever hope for outdoors.
Most plants grow best with daytime atmospheric CO2 of at least about 1500 ppmv. That’s about what CO2 levels are thought to have averaged during the Cretaceous. It’s 1090 ppmv higher than the current average outdoor level of about 410 ppmv.
In other words, most plants would grow best if CO2 levels were increased by more than eight times the measly 130 ppmv by which mankind has managed to increase CO2 levels since the “pre-industrial” Little Ice Age. (Levels even higher than that wouldn’t hurt plants, but they wouldn’t help much, either.)
https://sealevel.info/co2.html?co2scale=2

(click to enlarge)
That’s why most commercial greenhouses use “CO2 generators” to raise daytime CO2 to about that level. It makes the plants healthier, faster-growing, and more productive.
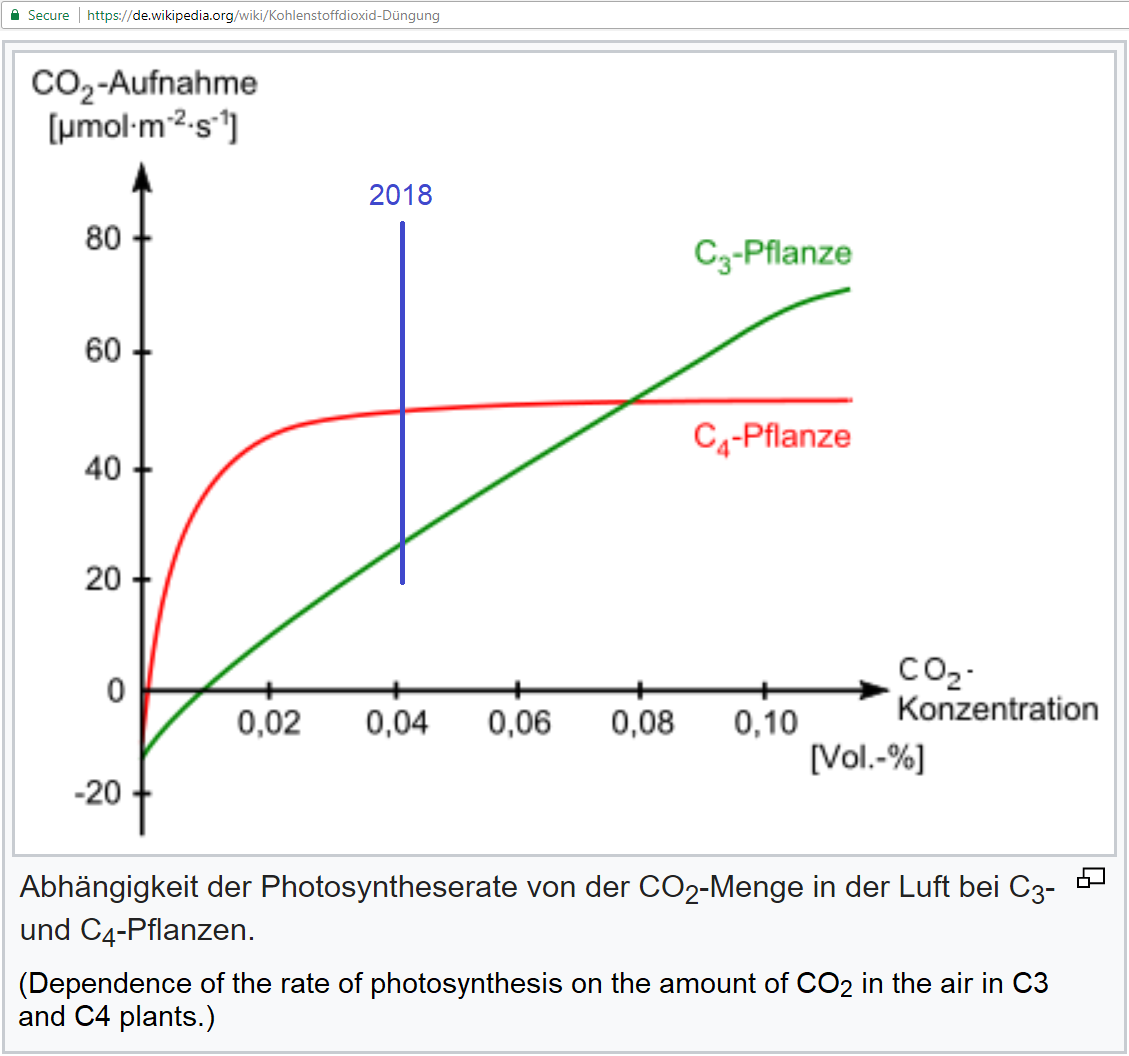
Note: There are several different kinds of photosynthesis. Plants that use “C3” or “CAM” photosynthesis benefit the most from higher CO2 levels. “C4” crops benefit the least, but even C4 crops benefit when under drought stress. Most crops use C3 photosynthesis. There are only four important C4 crops, all of them grasses: corn [maize], sugarcane, sorghum, and millet.)
https://www.sealevel.info/C3_and_C4_Pflanze_vs_CO2_Konzentration_2018.png

(dependence of the rate of photosynthesis on the amount of CO2 in the air in C3 and C4 plants, from https://de.wikipedia.org/wiki/Photosynthese; click to enlarge)
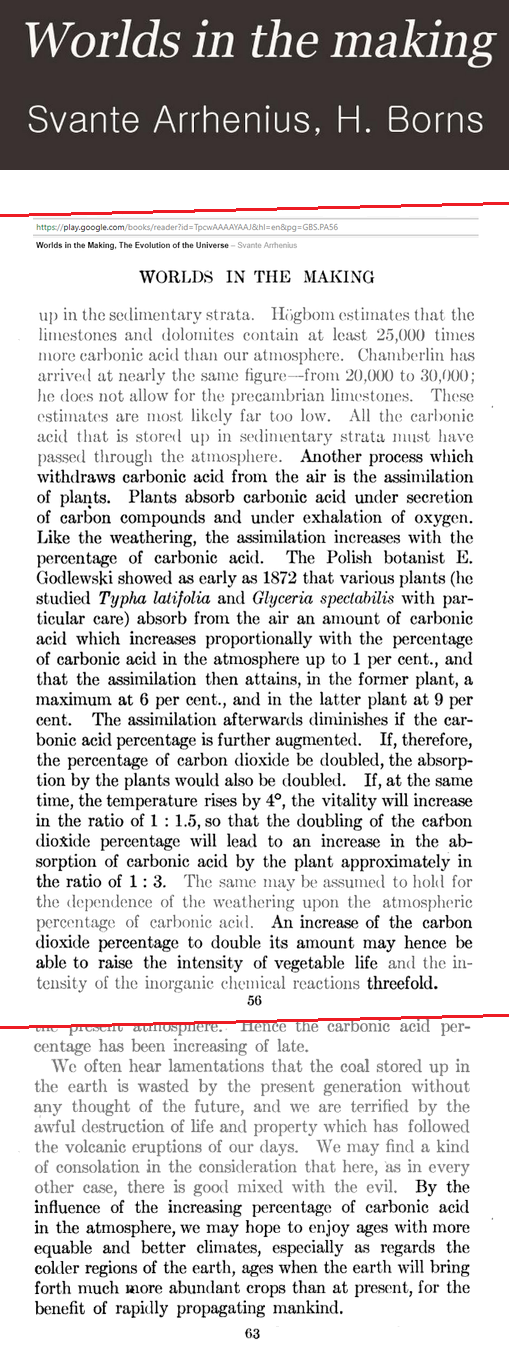
The value of higher CO2 levels for agriculture is not a new discovery. Svante Arrhenius wrote about it in 1908, and cited a source from as early as 1872. Arrhenius predicted that:
“By the influence of the increasing percentage of carbonic acid [CO2] in the atmosphere, we may hope to enjoy ages with more equable and better climates, especially as regards the colder regions of the earth, ages when the earth will bring forth much more abundant crops than at present, for the benefit of rapidly propagating mankind.”
In 1920, Scientific American reported the results of German greenhouse and F.A.C.E. experiments with CO2 supplementation. The experiments were so spectacularly successful that SciAm called anthropogenic CO2 “the precious air fertilizer.” From this photo, which accompanied the article, you can certainly see why:
SciAm 1920: Carbonic Acid Gas to Fertilize the Air

(click to view article)
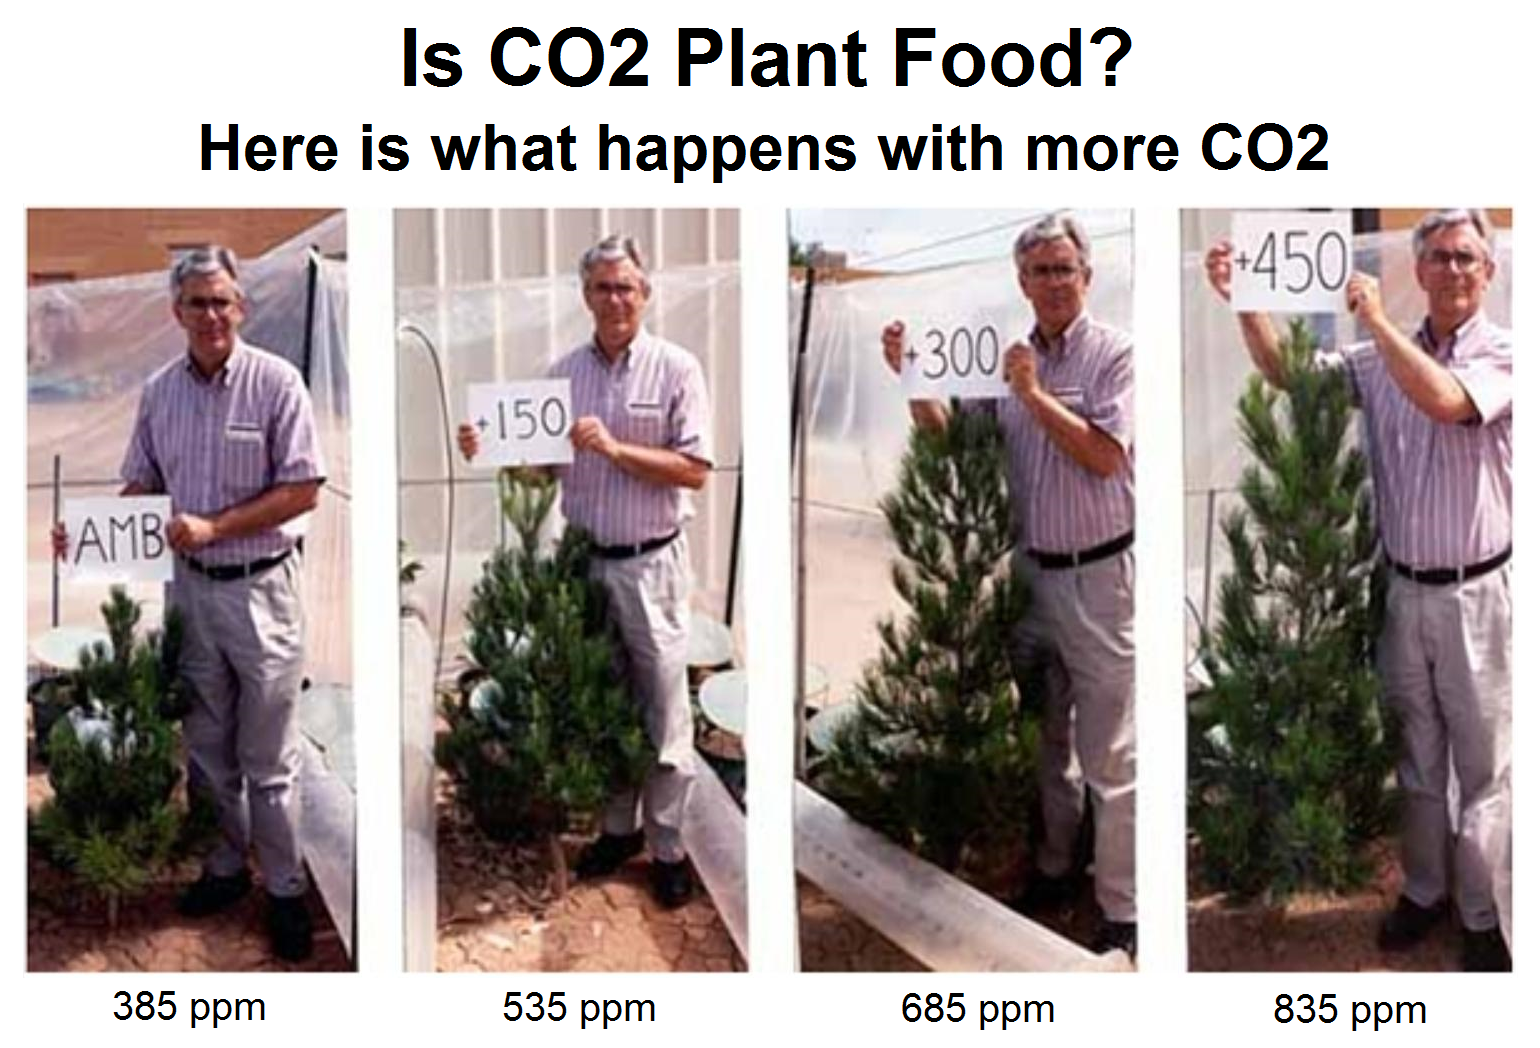
Over the last century, many hundreds of studies have measured the large benefits of higher CO2 levels for most crops:
https://sealevel.info/CO2-pineGrowth100120_white_bg.png

(Dr. Sherwood Idso showing the effect of CO2 level on pine trees; click to enlarge)
But the National Academy of Sciences would have you believe that global warming threatens agricultural productivity. So let’s examine that claim.
Here’s a recent article from the Farm Bureau, reporting preliminary U.S. state-by-state corn and soybean yield numbers for 2018:
Farm Bureau 2018: Corn and Soybean Yields are YUUUGE

(click to view article)
Of course the headline obviously suggests that climate change hasn’t hurt corn and soybean production, so far. But that’s not the most interesting part of it.
Look at the wide distribution of states, which grow corn. In this map, from the article, you can see that Minnesota’s 2018 corn yields averaged 191 Bushels Per Acre (BPA), and Mississippi’s corn yields averaged 185 BPA. The “breadbasket” states of Illinois and Iowa both had even bigger bumper crops, with yields above 200 BPA:
https://www.fb.org/images/uploads/_900w/Yuge_fig_1.jpg

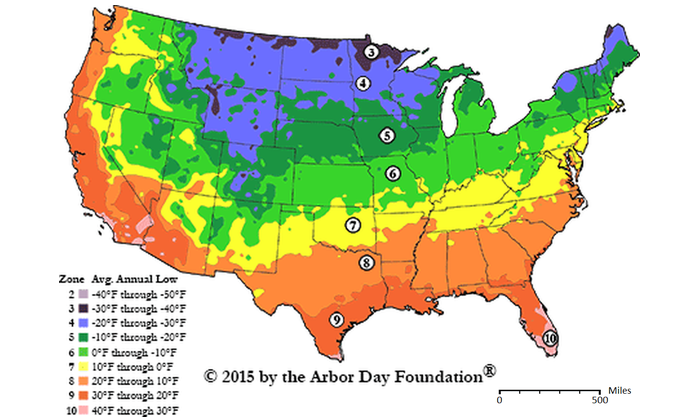
Now, compare that map with this growing-zone map (courtesy of arborday.org). In it you can see that Minnesota and Mississippi are about four climate/growing zones apart. Minnesota is mostly zone 4, and Mississippi is almost entirely zone 8. Illinois and Iowa are a mix of zones 5 & 6:
https://sealevel.info/zones-2015_700x420.png

U.S. climate zones span 10°F, so the center-to-center difference between four zone numbers is 40°F = 22.2 °C.
However, in this map you can see that Minnesota’s corn is mostly from the southern half of the state, which is a mix of zone 4 and zone 5, and Mississippi’s corn is mostly from the northwest half of the state, which is upper zone 8.
http://ctgpublishing.com/united-states-corn-production/

So the average temperature difference between the middle of the prime corn-growing regions of the two states is a bit less than 40°F, I’d call it about 33 ±2°F.
In Celsius, that’s a temperature difference of 17.2 to 19.4 °C (midpoint 18.3°C), between Mississippi (185 BPA) and Minnesota (191 BPA).
In other words, it is plain that an average temperature difference of about 18°C has little effect on corn yields.
Many other major crops are even less climate-sensitive:
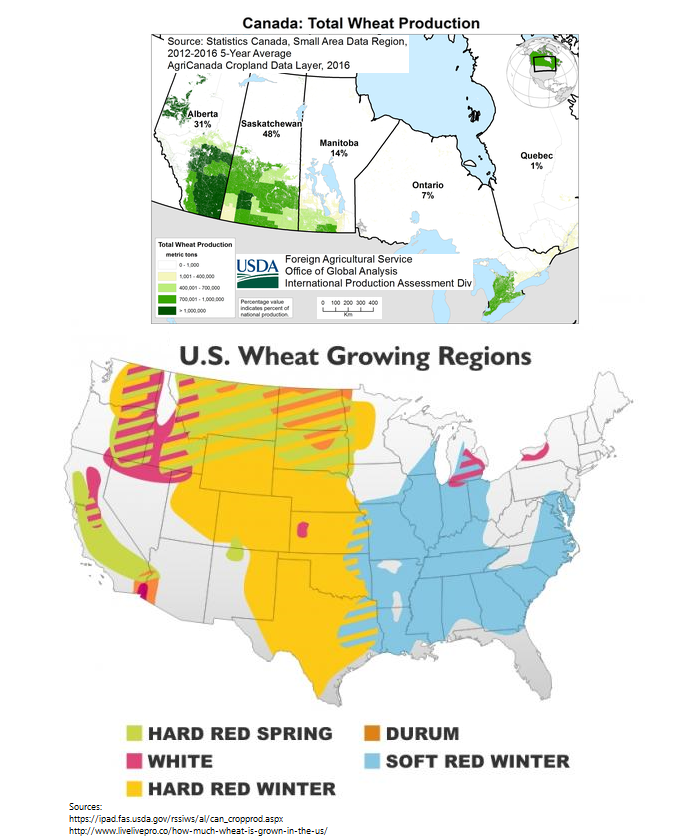
● Wheat is profitably grown in zones 3 through 9, from Saskatchewan to south Texas, a temperature range of over 35°C:
https://sealevel.info/wheat_growing_regions_usa_and_canada_700x840.png

● Maine & Florida are both major producers of Potatoes:
http://potatoesusa.com/us-potato-industry/us-growing-regions

● Soybeans are grown from Louisiana & Mississippi to Minnesota & Canada:
https://www.fb.org/images/uploads/_900w/Yuge_fig_4.jpg

What, then, are we to make of this PNAS paper?
Zhao C, et al. (2017) Temperature increase reduces global yields of major crops in four independent estimates. Proc Natl Acad Sci USA 114:9326–9331. doi:10.1073/pnas.1701762114
From the title you would probably assume that they found anthropogenic climate change causes crop yields to decline, because negative impacts of temperature increases exceed the positive impacts of CO2 fertilization and improved drought resistance from higher CO2 levels. That’s what you’re supposed to think, and that’s how the press release reported it:
“Climate change will cut crop yields,” said the caption on Phys.org, and called the little five-page paper “a major scientific report.”
“Global Warming Will Sear Three of Four Major Grain Crops,” said the caption on Haaratz.
But if you read the paper, or if you read Eric Worrall’s excellent 2017 analysis of it on WUWT, you’ll discover that the authors did not actually say that. Instead, they wrote that they were discussing what they think would happen to yields in an imaginary world “without CO2 fertilization, effective adaptation, and genetic improvement.”
Of course “without CO2 fertilization” means they’re ignoring the beneficial effects of higher CO2 levels, which obviously divorces the paper from any pretense of presenting predictions of future reality.
But it’s even worse than that. Can you guess what their assumption of no “effective adaptation” to a warming climate actually means?
For annual crops, “effective adaptation” means adjusting spring planting dates, and perhaps adjusting cultivar selection. That’s all.
It’s not rocket science. In America’s heartland, moving the planting date up by about six days compensates for 1°C of warming:
https://www.currentresults.com/Weather/Kansas/Places/wichita-temperatures-by-month-average.php

So +4°C of warming is equivalent to planting about 24 days late.
The assumption of no “effective adaptation” to warming means these 29(!) authors assumed farmers are all idiots, who can’t figure out when they should plant their crops. (Projection, maybe?)
It’s utterly preposterous. The reality is that most farmers are not idiots, anthropogenic CO2 is highly beneficial “air fertilizer,” and the further that CO2 levels rise, the more productive farms will become.
That fact is true for the great majority of crops, nearly everywhere in the world. Yet the NAS has been promoting the anti-scientific claim that rising CO2 levels are bad for agriculture, for years. This 2011 NAS / NRC propaganda graph is a particularly outrageous example:

Notice the red “US Maize” and purple “India Wheat” traces, and where they intersect the 4°C line. You can see that they’re predicting that in the event of a 4°C temperature increase, U.S. maize (corn) yields would decline by a devastating 60%, and wheat yields in India would fall 68%.
(Of course such a large temperature increase is thoroughly implausible, but never mind that. That’s a different rant, for a different day.)
Today’s rant is this: That NAS / NRC graph is a lie.
If a mere 4°C of warming were actually that destructive to corn yields, it would obviously be impossible to profitably grow corn even in Tennessee & Kentucky (zone 7, 174-175 BPA in 2018), let alone Mississippi (zone 8, 185 BPA).
Likewise, if a mere 4°C temperature increase were actually that destructive to wheat yields, then it would obviously be impossible for North Americans to cultivate wheat across seven climate zones, from Saskatchewan to south Texas, spanning an average temperature range of about 35°C.
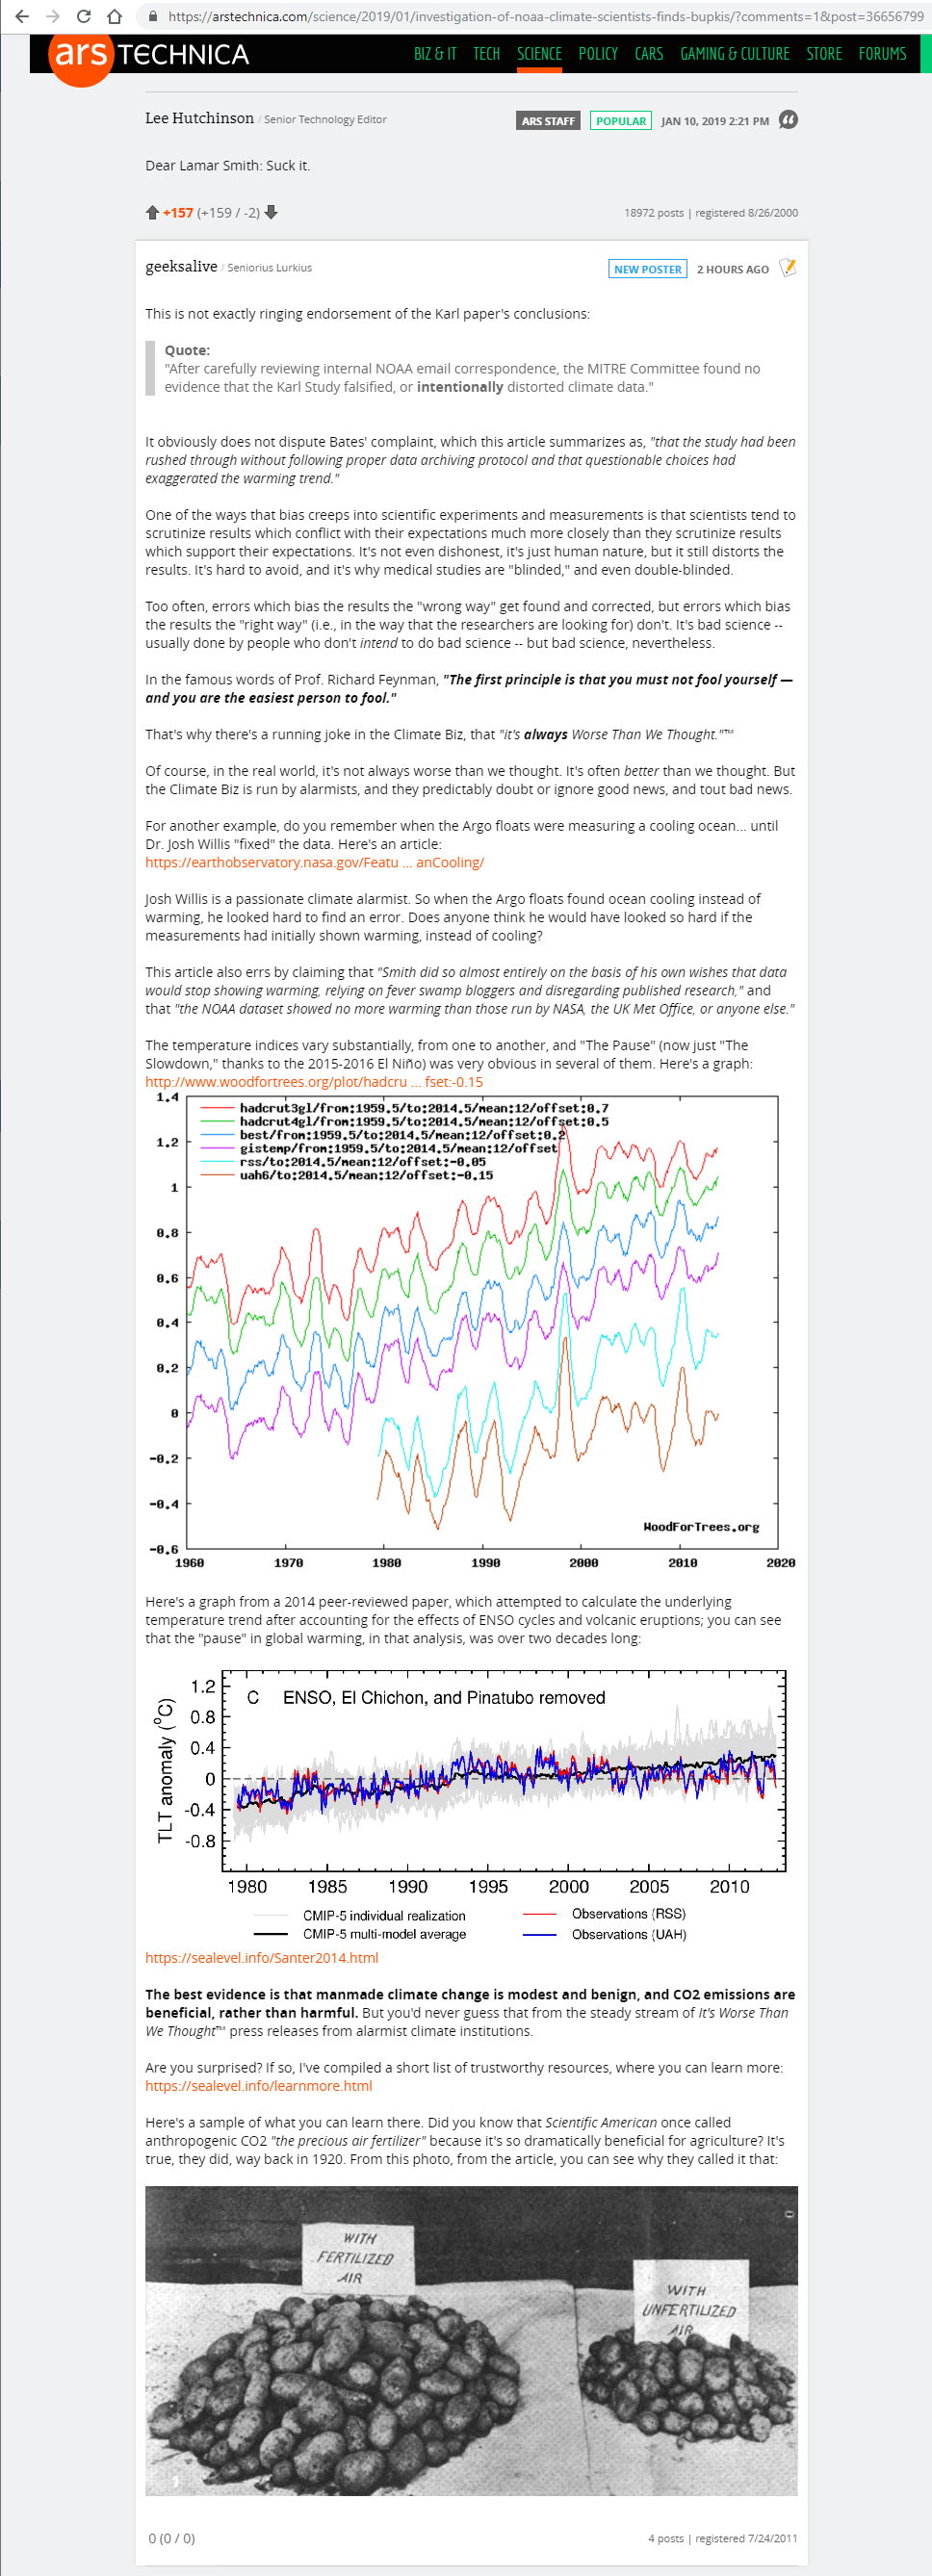
That NAS / NRC graph is utter nonsense. But even though it is old, it’s still being used by climate change zealots to mislead people. I stumbled across it because someone posted it in the comments on an article at ArsTechnica. (I’m currently banned for a week there, for “ignoring moderation,” because I disagreed with their leftist moderator. My first comment there [screenshot] has been deleted, too, but some of the others are still there. They look “faded” because the ArsTechnica comment system fades-out comments with lots of downvotes.)
On March 22, 2012, Rud Istvan did a wonderful, in-depth demolition of that graph, on WUWT & ClimateEtc:
● https://judithcurry.com/2012/03/22/nrcs-artless-untruths-on-climate-change-and-food-security/
● https://wattsupwiththat.wordpress.com/2012/03/22/nrcs-2011-climategate/
Yet, despite their propaganda graph having been completely debunked, the NAS is still disseminating it, to promote the climate scare.
Here it is on their web site, on p.28 of a little 40 page propaganda booklet, which appears to be designed to be used as a resource by schoolteachers:
Here it is, in convenient PowerPoint format, for incorporation into your talk at the local garden club (slide 21):
http://dels.nas.edu/resources/static-assets/exec-office-other/climate-change-figures.ppt
(The file metadata indicates that the slides were created by “Rebecca” in June, 2013 — more than a year after Rud had discredited the graph.)
It’s also on p.161 of this free 299-page ebook:
If Zhao and his 28 co-authors really believe, as they claimed in their PNAS paper, that correctly assessing the impact of climate change on agriculture is “critical to maintaining global food supply,” then it is incredibly cynical of them and the NAS to publish misleading papers and graphs which encourage policymakers to take steps that will actually reduce that the global food supply.
I’m beginning to wonder: Does the “A” in “NAS” is still stand for “Academy of,” or does it now stand for “Anti-,”?
How can they measure 0.4 of a CO2 molecule?
Wanna see something funny?
Make a graph showing temps since 1980, and on the same graph plot crop yields for the major grains.
Do this for the US, the globe, anywhere.
Laugh, share, rinse, repeat.
Dave: It is worth keeping in mind that plants can’t open their stomata and feed on CO2 from the air without losing water out those same stomata. Water is as essential as CO2, a source of nitrogen, phosphorus, potassium, and some micronutrients. So, if you specify adequate natural rainfall or irrigation, I reasonably content accepting that more CO2 will mean more plant growth despite more warmth.
However, in the Western half of the US, the supply of water is limited. More than 90% of the water flowing in the Colorado is piped somewhere. The water that filled Owens lake is shipped to LA. San Diego is building a huge desalination plant. The water level in aquifers is falling, especially the big aquifer under the High Plains and in CA during the drought. Precipitation is supposed to rise about 2%/K globally, mostly at higher latitudes. The rate of evaporation varies with saturation vapor pressure (which rises 7%/K), undersaturation (1-RH), and wind speed. So global warming is expected to make land drier. CO2 fertilization is only part of the story. Water is another important part of the story, plants can’t breath in CO2 without it. Stomata stay closed under water stress.
I won’t venture to try to balance these opposing factors. However, it seems to me that we SHOULD be able to use our water more effectively, but water-rights in the West are like guns to NRA members. It also seems to me the better crops especially through genetic engineering could be a big help.
Plants produce fewer and smaller stomata as a result of higher concentrations of carbon dioxide. This reduces their water use. Arid regions are greening as a result of this happening.
Robert: Thanks for the reply. If you look at Figure 1 and 3 in the linked paper, you will see that greening is concentrated in regions with plenty of rainfall. The Western US and Australia not showing much, if any, greening. Standard measures of drought include the effects of both reduced precipitation and increased temperature, because of increased transpiration. There is nothing special about CO2 and stomata: When CO2 is entering, water is exiting. Higher CO2 means fewer water molecules lost per CO2 taken up (higher efficiency). But that efficiency will be needed because drought stress will be more prevalent. Stressed plants shut their stomata and postpone growth until conditions are more favorable.
http://www.creaf.uab.es/Global-Ecology/Pdfs_UEG/2016_Zhu_et%20al_Nat%20Climate%20Change_2016.pdf
https://m.phys.org/news/2013-07-greening-co2.html
The deserts are greening as a result of increasing levels of carbon dioxide. Since there is no evidence of increasing droughts this means that plants will be able to increase their cover of arid regions. The map on this link shows that this is happening. As a result of increased plant growth the soil will be better able to retain moisture improving even more their ability to encroach into arid regions.
Robert: Thanks for the reply. The link you sent to greening of the deserts is a press release associated with the same journal article I provided you. However, the map in your press release looks nothing like the maps in the original paper. I finally found the map in your article as Figure S12 in the supplemental material and it explains the confusion. The authors used climate models and other information to ATTRIBUTE greening to different factors: CO2 fertilization, change in precipitation, nitrogen fertilization, (climate change) warmer temperature etc. The map in your article is the greening ATTRIBUTED to CO2 fertilization. It is the output of a model. On Figure 11, you can see the “browning” ATTRIBUTED CO2-induced warming and increased water stress in Australia and the Western US. The OBSERVATIONS show much less greening in Australia and the Western US than elsewhere.
Frank, I do not believe that I ever argued that arid regions were greening more than other areas. Just that some of the greening taking place in these areas could be attributed to increased levels of carbon dioxide. While models were used they were used to help determine the extent to which these other factors were contributing to the greening. I believe that our understanding of these factors is sufficient for a reasonable estimation of their effects to be modeled. These increases in carbon dioxide would allow plants to take in more carbon dioxide without losing more water. They do not have to open as much nor to open longer for additional carbon dioxide to be taken in. Since less water is lost more water would be left in the ground. In addition to that the added plant growth whether as the result of more leaves per plant or more plants would further improve water retention as a result of less evaporation from the ground through less exposure of the ground to sunlight.
Robert: Again, thank you for your reply. However, I don’t disagree with anything you have written, especially:
“They do not have to open as much nor to open longer for additional carbon dioxide to be taken in. Since less water is lost more water would be left in the ground.”
However, you fail to acknowledge that warmth caused by more CO2 (if any) will also cause more water stress by increasing transpiration and evaporation. Which effect is more important? We don’t know.
If you look at the OBSERVATIONS in Figure 1, you’ll see the first data set shows far more browning than greening in the Western US and Argentina, and the third shows the same for Australia. Few or no stars showing statistical significance.
http://www.creaf.uab.es/Global-Ecology/Pdfs_UEG/2016_Zhu_et%20al_Nat%20Climate%20Change_2016.pdf
http://archive.news.iupui.edu/releases/2016/02/drylands-global-greening.shtml
“The researchers examined the sensitivity of soil water change to varying levels of carbon dioxide, finding a significant positive change in soil water along the carbon dioxide enrichment gradient.
“The stability of the rate of change justifies using higher carbon dioxide enrichment levels to interpret soil water responses to currently observed carbon dioxide enrichment,” Wang said.
The analysis also showed that elevated carbon dioxide significantly enhanced soil water levels in drylands more so than it did in non-drylands, with soil water content increasing by 9 percent in non-drylands compared to 17 percent in drylands, Wang said. Determining the mechanisms of stronger soil water responses in drylands will require further investigation.”
This is further supported by GRACE data showing higher water retention over land than hydrological models calculate.
https://wattsupwiththat.com/2018/01/26/what-to-believe-models-or-grace-data/
Evaporation happens more readily over water than land, so we’ll see a net transfer from oceans to land. Less demand from plants means more water available for other plants. Many plants also supply more carbon to soil and symbiotic bacteria and fungi which make nitrogen and phosphorus bio available as CO2 increase, this further increases the ability of soil to retain water. This creates a positive feedback cycle that will only accelerate as CO2 rises.
The notion that drought and water stress will increase due to climate change, quite frankly, is ridiculous.
I agree
Aaron: The article you cite is an analysis of the a total of 45 separate papers involving increased growth from CO2 supplementation. Since stomata need to be open less often with higher CO2, the plants use less water. However, the second effect of CO2 all of these researchers believe in is that CO2 will produce higher temperature. Higher temperature means more evaporation. In these CO2 supplementation experiments, one gets the undeniable benefit of CO2 fertilization without the increase evaporation from higher temperature.
Heat causes drought even when rainfall remains the same!. See the widely used Palmer Drought Index.
https://en.wikipedia.org/wiki/Palmer_drought_index
Aaron wrote: “This is further supported by GRACE data showing higher water retention over land than hydrological models calculate.”
https://wattsupwiththat.com/2018/01/26/what-to-believe-models-or-grace-data/
This is false. The article claims GRACE disagrees in both directions with models of water storage on land.
The effect of climate change on the hydrologic cycle is complex, but models predict dying over land. In the real world, there is less greening in arid areas (see above).
More vegetation should be expected to increase water loss through transpiration. But this study found that the increase in transpiration due to “greening” has been closely balanced by the decrease in transpiration due to higher CO2 levels.
https://www.nature.com/articles/s41467-017-00114-5
An article about it summarized it:
Ref: https://wattsupwiththat.com/2017/07/30/rising-carbon-dioxide-is-making-the-worlds-plants-more-water-wise/
I’d like to add this data to the evidence here:
https://www.agprofessional.com/article/comparison-world-corn-yields
and focusing on Argentina (as an analog for the USA and Canada)
http://www.city-data.com/forum/attachments/weather/83943d1314056047-does-usa-have-most-climate-zones-mapaclimatico.gif
I suspect that when rainfall, soil quality, and techniques are accounted for, that yields will continue to rise disproportionately to the USA is most countries and their climate zones.
The IPCC has to predict food production will decline because if they say it won’t they eliminate a major calamity they claim is the result of warming. Starvation and loss of life from it. Of course, the idea that food production in 2080 would be less because of 2 C warming is absurd in so many ways as to defy intelligence. We have tripled output of food in the world in the last 60 years and we are on track to triple it again. By the time 2080 comes around we will have such an abundance of food that even if Global Warming somehow impacted our productivity it would make no difference. Also, as the author above points out their predictions are based on stupidity of farmers that is ridiculous. Higher temperatures will increase growing seasons and some places may have multiple growing seasons. Some foods may change locations but this is obvious. In total there will be more arable land and more water too. Higher temperatures mean more evaporation and more rain. Even they predict that.
If they didn’t say that people will starve but that productivity will be enhanced then they would find the scare tactics they use become laughed at. This is why they NEVER talk about the benefits of global warming. If anybody thinks there is any benefit at all they know many people will shrug their shoulders. To keep the money flowing they need to have only negatives. No positives.
So, they talk about how storms will increase when in fact the reduction in polar/equator temperature difference will lessen the energy available to storms. This is the most common sense result that is obvious but they ignore the common sense reasoning and tell us their models project higher storms. We haven’t seen it and won’t. They only look at reasons to become alarmed and discount any reason that might be positive.
They don’t mention studies that show 23 times fewer people die from all causes for a N degree rise in temperature than from an N degree drop. The result is probably millions of lives saved from pneumonia, heart disease, lung diseases and other. They never mention this instead talking about some insect causing this or that death toll. They probably haven’t heard the news that we just created a much more effective vaccine. Oh well another global warming killer mitigated!!!
Also, 20 companies are now started in 2 years to produce nuclear fusion reactors commercially. Many people say that by 2030 we will have commercially feasible fusion reactors. Crisis cancelled again.
There’s something major that’s being missed here, and that’s the effect of science and breeding on crop yields. Companies have been concentrating on specific hybrids for specific climates since the 1940’s. If you take a typical hybrid or variety from 15 years ago, and compare it to a hybrid or variety that’s “current” you are going to see most of your yield difference. You would then need to tease THAT out of the CO2 data. Good luck with that.