Guest Post by Willis Eschenbach [See Update At The End]
I keep reading that one of the things that we are already seeing (or that is predicted) is that the wet areas of the planet are getting wetter and the dry areas are getting drier, viz:
Expect the Wet to Get Wetter, and the Dry, Drier – Center for Climate …
May 31, 2017 – As the world warms due to human-induced climate change, many scientists have been … summer, wet areas will get wetter and dry areas will get drier. … United States, inner Asia and the Middle East will become even dryer.
Will the Wet Get Wetter and the Dry Drier – Geophysical Fluid …
NOAA GFDL Climate Research Highlights Image Gallery Will the Wet Get Wetter … in precipitation near 20°S and 20°N – latitudes in the subtropical dry zones.
Wet regions getting wetter, dry regions drier as planet warms …
Wet regions getting wetter, dry regions drier as planet warms … simulations of the climate show reductions in rainfall over the drier tropical land regions … that drying of the drier regions continues (right) while wet regions will experience more …
The world’s wet regions are getting wetter and the dry regions are …
Dec 12, 2016 – The world’s wet regions are getting wetter and the dry regions are … warming climate; as the world gets warmer wet regions will continue to get …
Dry lands getting drier, wet getting wetter: Earth’s water cycle …
May 21, 2012 – … get richer’ mechanism, where wet regions get wetter and dry regions drier. … “Salinity shifts in the ocean confirm climate and the global water …
I thought about that while reading a recent study called Rapid Drying of Northeast India in the Last Three Decades: Climate Change or Natural Variability?. (Their conclusion, by the way, was that it was NOT from human actions, but instead that “the recent decreasing trend of NEI summer monsoon rainfall is, rather associated with the strong interdecadal variability of the subtropical Pacific Ocean“.)
So I went to the marvelous KNMI Climate Explorer and got the CRU TS 4.01 gridded precipitation dataset, which covers from 1901 through 2016. I started by looking at the trend of the data since 1901.

Figure 1. Global rainfall, land-only, 1901 – 2016.
Now, there is a trend … but the increase in monthly rainfall is only 2 millimeters per century. This represents an increase of about an inch (25 mm) in the yearly average rainfall. Small.
Next, since the Indian study concerned the recent decades, I looked more closely at the average rainfall over that period. Figure 2 shows the average rainfall around the globe for the period 1980 through 2016.

Figure 2. Average rainfall, 1980 – 2016. Rainfall is shown on a 1° latitude by 1° longitude gridcell basis. All areas with over 2.2 metres/year are shown in darkest blue.
Here you can see the great deserts of the Sahara, the Gobi, the Atacama, and central Australia. You can also see the wet zones of the Amazon, the African rainforests, and Indonesia and Papua New Guinea.
Next, I looked at the individual trends for each 1°x1° gridcell over that same period, from 1980 through 2016.

Figure 3. Precipitation trends, monthly precipitation, millimeters/month per decade. Areas with trends greater than 7 or less than -7 mm/decade are shown in bright blue or bright red. Click to embiggen.
Here we can see the problem indicated in the Indian study, the drying of Northeast India.
Finally, using the combination of precipitation and precipitation trend data, we can see if it is true that the dry areas are getting drier and the wet areas are getting wetter. Figure 4 shows a scatterplot of the two datasets.

Figure 4. Scatterplot, average land-only annual precipitation versus precipitation trend, 1980 – 2017. The black dots with whisker lines show the median and the error range for that precipitation interval.
What this shows is that while the wetter areas are getting wetter, it is not true that the drier areas are getting drier. On average, all areas are getting more rain. Not a lot more rain, of course, but more rain. Once again, the climate models are wrong.
And so one more beautiful climate myth runs aground on a reef of hard facts … the wet is getting wetter, but the dry isn’t getting drier—instead, the dry is getting wetter as well
[UPDATE] I realized that I had another dataset showing rainfall. This is the Tropical Rainfall Measuring Mission satellite rainfall dataset. Here is what that looks like.

Figure 5. Movie loop of the monthly averages of the tropical rainfall, Dec 1997 – Mar 2015. The coverage of the mission only extends from 40°N to 40°S. Note that this covers about two-thirds of the surface of the planet. Units are mm/month.
I ran the same type of scatterplot analysis on this data as in Figure 4, and I got the same results.

Figure 6. Scatterplot, TRMM data, average 40°N to 40°S annual precipitation versus precipitation trend, 1997 – 2015. The black dots with whisker lines show the median and the error range for that precipitation interval.
On average, wet areas are getting wetter, and dry areas are getting wetter as well. Go figure …
Finally, note the wide spread of the data. There are many dry areas getting wetter, and many wet areas getting drier. However, on average they are all either staying the same or getting wetter.
Here, we’re in the “wetter” part of the equation, a rainy Christmas Eve. Well, since it’s 2:03 AM, I guess it’s actually a rainy Christmas morning … so the very best of wet Christmas morning wishes to everyone.
w.
Willis,
Re fig. 1 you say:
Yes, but that’s for ‘global’ land data (fig. 1), so it doesn’t answer the question you’re asking. If you’re testing the hypothesis that ‘wet areas of the planet are getting wetter and dry areas are getting drier’ then surely ‘wet’ and ‘dry’ land areas need to be sub-divided and separate calculations made for each?
If dry areas really are getting dryer and wet areas really are getting wetter, using global data without differentiating between the two types of area will obscure this.
Tim-flim-flam-Flannery could not be reached.
“Now, there is a trend … but the increase in monthly rainfall is only 2 millimeters per century. This represents an increase of about an inch (25 mm) in the yearly average rainfall. Small“
How does 2 millimeters per century equal 25 mm
Is a yearly average?
Don’t you divide 25 mm by 100 or so?
Sorry for my ignorance. I am 66 and every year out or high school I loose a bit more arithmetic 😂
Thanks for all your hard work. I send it to my friends to try to steer them to the truth.
The chart legends for Figs 2-3 show these as deltas per month. So 2 * 12 = roughly 25mm
Sorry, now that I scroll up, its Fig 3 only. I blame cold medication.
Once again, the climate consensus is shown to be wrong. Their predictions of existential crisis are false.
Once again the climate skeptics are right: nothing dangerous is changing in the climate.
Thank you, Willis.
Willis.
Also ref Bob at 3.54am,
The first para after fig 1 does not make sense. I think you mean trend is 2mm per decade to make an inch over the span of the graph.
Many thanks for all your posts – I appreciate the science and the sea- tales.
Very unsurprising to me that as the world has warmed overall since the end of the LIA, precipitation is increasing overall. More evaporation from oceans mean more water in the air and hence more precip.
And also not a bit surprising that warmistas making crap up have been proven wrong again.
I live in Jordan.
The past 18 years but, more so, during the past 6 years, the weather has become gradually wetter and cloudier.
This year (2018) we even had clouds in August. In fact, on 30% of the days of August we had 60% cloud cover.
I’m at meridian 90 west and parallel 39 north, observing an increase in high clouds since 2016. We very seldom have clear sky for more than an hour or two before more stratospheric haze dims the sunshine. Really irks my neighbors with solar panels. Consequently, our daytime highs are lower and our nighttime low temps are higher than years like 2012 when we saw weeks without clouds at all.
I wonder if it’s all about where the clouds tend to be on the globe, rather than the total amount of global cloud cover.
Can rainfall serve as a proxy measure of cloud cover? If you have a tiny bit more rain, you probably also have had a tiny bit more cloud cover. How much additional cloud cover would it take to account for the additional warming seen over the last century, and does that correlate at all with the amount of additional cloud cover estimated from the higher amounts of rainfall?
This is the dawn of the age of Aquarius. Warmer, wetter, lusher and greener.
Man is in symbiosis with nature, but most fail to recognise it.
With WV trend having gone flat, sun gone quiet and ocean cycle temperature trend in down slope, I am afraid it is more like the dusk of Aquarius.
Wetter poles mean thicker ice core rings. Drier poles mean thinner ice core rings. I am thinking out loud and speculating here. Long periods of thin layers, and long periods of thick layers would be spread apart between more variable layers where thick and thin layers are next to each other with very little trend. Since we are at the top of a warm period, these precipitation ups and downs are not much to bark at (just a pin hole of a window of time) when seen from the 800,000 year wide screen picture window.
Anyone who screams into the night that the climate is weirding out by some places getting wetter while others are getting drier, or some other mix of these signals, appears to be advocating for the jagged downhill slide into killing cold with little water vapor sourced precipitation to support life.
https://m.youtube.com/watch?v=ElJFYwRtrH4
Not to be a “wet” blanket, but between the normal measurement error and error due to homogenized data, an annual change of 1 inch per century would seem to me to be well within the error bars that should be included in all statistical studies. It does contradict the “It’s an unprecedented disaster and getting worse” mime.
Willis wrote about the scatterplot Figure 4: “What this shows is that while the wetter areas are getting wetter, it is not true that the drier areas are getting drier. All areas are getting more rain. Not a lot more rain, of course, but more rain. Once again, the climate models are wrong.”
This conclusion depends on how you define the terms “wetter and drier”. There is very little precipitation in Antarctica, but most of the continent is covered with thousands of kilometers of frozen water. The scientists who say that wetter regions are going to get wetter and drier regions are going to get drier are using different definitions that you are for wet and dry AND their poorly expressed concepts are being distorted by alarmists to scare us. Their concept of wet and dry sensibly includes both precipitation and evaporation, not just precipitation.
If I understand correctly, in this case, climate scientists are defining wet regions as those that receive more water as precipitation than they lose via evaporation. On land, the excess water runs off. Dry areas are those where evaporation is greater than precipitation, a concept that works for oceans but makes no sense to me for land. Where P-E is negative, it is expected to become more negative. Where P-E is positive, it is expected to become more positive. Sometimes this conclusion is limited to the tropics, where the Hadley circulation determines where rain forests and deserts are located.
There are plenty of points on your scatter plot where precipitation is falling and they could be in regions that are “dry” in terms of P-E. So your plot doesn’t prove they are wrong using their definitions. The data pasted below (if successfully pasted) is consistent with expectations, but our records aren’t good enough to pick out changes that are less than 1% per decade against a background of natural variability and possible systematic error. The magnitude of the change predicted for 2100 is a fall of less that 5% from today for dry areas.
http://iopscience.iop.org/article/10.1088/1748-9326/8/3/034002/meta
Since there are two orders of magnitude in precipitation between the wettest and driest locations, climate scientists sensibly report the change in precipitation rate as a percentage, not an amount. And since 1 m of rainfall is average, the slope of the yellow line on your graph is being determined mostly by areas with average rainfall.
Willis: There are some powerful constraint on how precipitation (and the convection that produces it) can change on a warming planet, so you are exploring a very interesting topic. If surface evaporation were to rise 7%/K (as saturation vapor pressure does), then an addition 5.6 W/m2/K of latent heat would enter the atmosphere from the bottom. Modtran shows that the net upward radiative flux (OLR-DLR) changes less than 1 W/m2/K with warming. That heat must leave the top of the atmosphere. However, the increase in the amount of heat leaving the top of the atmosphere with warming depends on climate sensitivity: ECS 3.6 K/doubling, 1 W/m2/K; ECS = 1.8 K/doubling, 2 W/m2/K; ECS = 1.2 K/doubling (no feedbacks), 3 W/m2/K; ECS = 0.65 K/doubling, 5.5 W/m2/K. Therefore, a 7%/K increase in evaporation with warming is grossly inconsistent with today’s expectations for ECS. That means the upward convection of moist air (such as the Hadley circulation) must slow. The wet getting wetter and dry getting drier alarmism is associated with the expectation that atmospheric overturning must slow enough to limit the increase in precipitation to about 2%/K.
Hello Willis,
Very nice post.
One interesting presentation of the data would be like figure 4, but with the trends normalized by the individual cells’ precipitation rate. It looks like the rate of increase is not far from a constant fraction of the total precipitation, independent of how much precipitation is received.
Atmospheric water vapor has been increasing, long term, (graph using NASA/RSS satellite acquired numerical data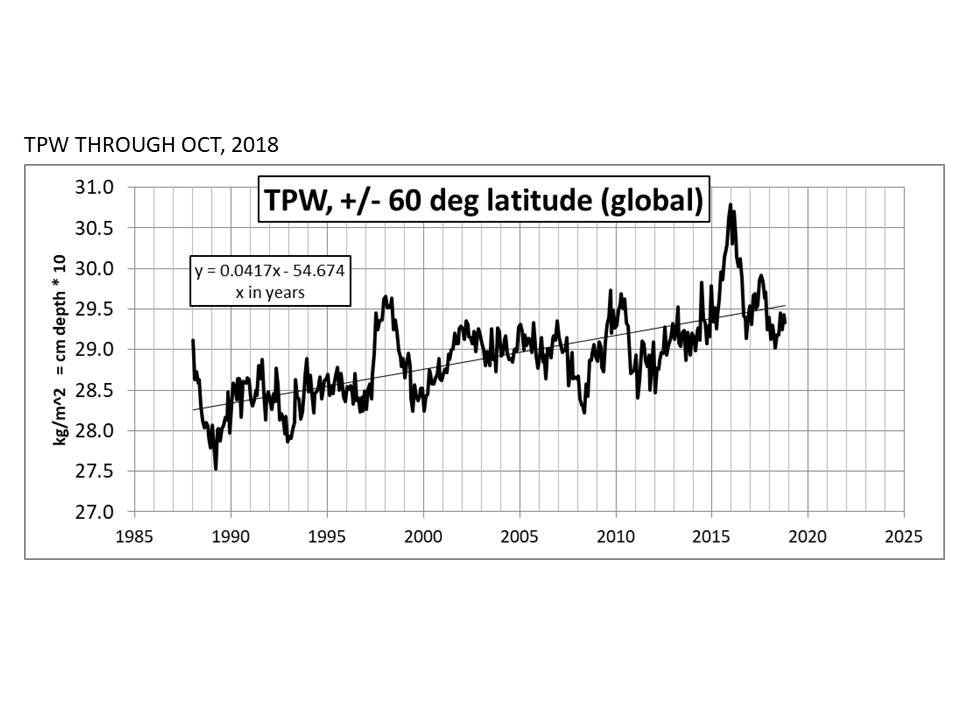 ) at 1.5% per decade, 8% since 1960. The WV increase (about twice that calculated from increase in vapor pressure due to average global temperature increase of liquid water at planet surface) correlates with irrigation increase.
The WV increase posed the question of whether precipitation increase would be world wide or the hydrologic cycle would become more intense with dry areas becoming dryer. This study supports that precipitation increase is world wide.
If the 2015-2016 el Nino is ignored, WV content looks flat since about 2002 (as does UAH v6.0 TLT (lower troposphere) temperature). It looks like this warming cycle has ended.
How much of recent high precipitation (with incidences reported world wide) has been simply bad luck in the randomness of weather and how much has been because of the ‘thumb on the scale’ of added water vapor?
%&#! Make that link
I developed a better way to show what is happening in the scatterplots, so in the head post I’ve added a scatterplot to the TRMM data and updated the scatterplot for the CRU TS 4.02 data. Both of them show basically the same pattern.
w.
Do you still want “Dryer” (the machine) in the title, or “Drier” (the description) for the areas?
Both, iconically, are valid.
Thanks, RA. I considered that, but I liked “Dryer” (the machine) better.
w.
Great! Thanks.
There is a problem with this statement.
Whether it is dry or not does not only depend on how much it rains, it is also very dependent on the temperature. When it is warmer, more water evaporates so we need more rain to stay on the same “dryness” level.
That means that if the temperature increases it can actually be drier even if the area are getting more rain.
/Jan
No !
Actually if there is more rain this will CAUSE the temperatures to be lower.
Why ? More rain means more moisture available for evaporation from plants and the soil. And that evaporation will lower the temperature in that area.
Now that is physics mate !
This is very very obvious if you examine the temperatures along the line of latitude here in Australia. The 25 degree South line of latitude runs from Maryborough in the East to Shark’s Bay in the West. And this all these areas get roughly the same level of sunlight. However Maryborough has a monsoonal climate with lots of rain from December to March/April. And the temperature pattern reflects this.
Due West is the town of Longreach which is far drier and thus has a much hotter temperature regime.
Further West again is open empty desert… until Shark’s bay which is on the edge of desert.
This is also correct; however, it does not negate my statement above. Both are true. It is a question of which effect have the largest impact.
We are after all not talking about going from arid to mist areas here. We see in these after all very interesting graphs that the arid areas with annual precipitation less than 1 meter have an increase of less than one mm/ month per decade. It is not trivial to calculate the effect temperature from that, but my intuition says me that 1 mm/month will have negligible effect on temperature.
I think a scatterplot showing annual precipitation against the relative change in monthly precipitation would be useful. Could we see if the arid areas got more or less percentage increase as the wet ones?
/Jan
I agree percent increase would be more informative. IMO it also makes more sense. It would make the assessment even more convincing by raising the dots toward the lower precipitation side of the graph.
It would make sense the regional trends in Figure 3 through 1980 to 2016 are greatly influenced by the AMO shifting phase.
It seems to me it would be very hard to detect a downward trend, on average, in areas that are very dry to begin with. There’s not much more downward to go. You can see this at the far-left hand of the scatterplots. The first one actually does appear to have lowest-precipitation bar very slightly below the 0 line, unless this is just a function of the graphics. And, as others have pointed out, precipitation doesn’t equal how dry or wet a place is. This is not only because of the effect of temperature, but also the timing of the precipitation. Precipitation events are predicted (and observed, in the U.S.) to get more intense, which can lead to greater runoff, leaving proportionally less available for plant growth and aquifer replenishment. One big storm in the Sahara in 2015 could affect the “trend” for that region – likewise, any anomalously rainy year hitting a lot of dry areas toward the end of the period could affect the data. And this is only for land, omitting Antartica. I’m always a little wary of linear trends, though, especially with this kind of data.
It’s interesting data, in any case. Always nice to have more things to think about and explore. Thanks, Willis. (That’s genuine.)
I wasn’t able to find the same page that shows the data Willis has, but I monkeyed around with another page, comparing the difference between averages of various time periods. The period selected has quite an impact. When I compared 1950-1960 with 2008-2018 there were notable differences from the data in the post. For instance, much of Africa north of a line from the horn east has gotten “significantly” drier (on the maps I found, there were hatch marks that denoted a signal less than 1 sd from “natural variability” based on climate models – and a lot of the land was covered in the hatch).
Where do these mental giants come from who can tell us where we get one additional milli-watt of additional power to evaporate 1 thimble full of water. (Hint: It ain’t from CO2 greenhouse, a blanket adds NO additional power to an isolated system.
arationofreason