Guest Post by Willis Eschenbach
Inspired by the work done by Robert Rohde attempting to link May to October temperatures and rainfall to fires, I thought I’d take a look at the acres burned over the years. Rohde compared the rainfall and temperature records and highlighted the largest fires. However, this gives only a few data points. I wanted a larger view of the situation.
So instead of major fires, I looked at the areas burned every year, which are available here. There is complete data from 1959 to 2016, and the last two years are available here and here.
The first thing I did was run a multiple regression on the data, using both May to October temperature and May to October rainfall to see how well they would predict the area burned. To my great surprise, I found out that rainfall is not significantly correlated with the area burned. Here is that result:
               Estimate Std. Error t value Pr(>|t|)
(Intercept)   -13393785    2502402  -5.352 1.61e-06
Temperature      203834      35791   5.695 4.52e-07
Rainfall         -46812      35591  -1.315    0.194
Temperature is significant (right-hand column, p-value 4.52e-7), but rainfall is far from significant (p-value = .19). So I ignored rainfall for the rest of the analysis.
Next, I graphed the acres burned, and ran a linear regression on the data. Figure 1 shows that result:
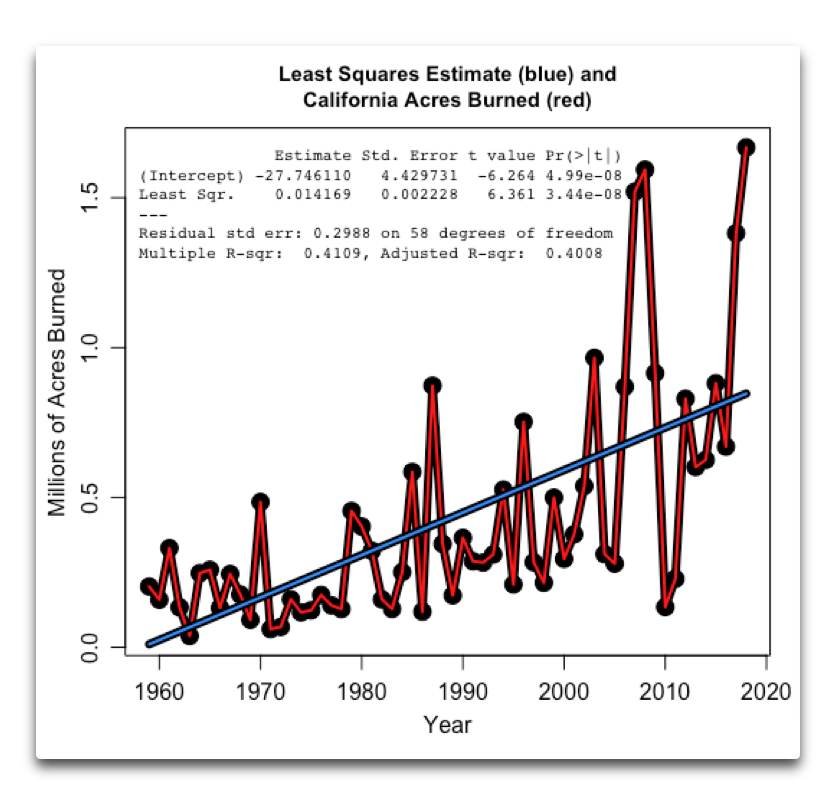
Figure 1. Total areas burned by year, 1959-2018 (red line) and linear least squares trend line (blue line).
Note that the p-value of the line is quite good (right column, p-value = .00000004). The R^2 value (bottom line) shows that the straight line explains 41% of the variance in the acres burned.
Then I looked at the connection between temperature and acres burned. Figure 2 shows that result:
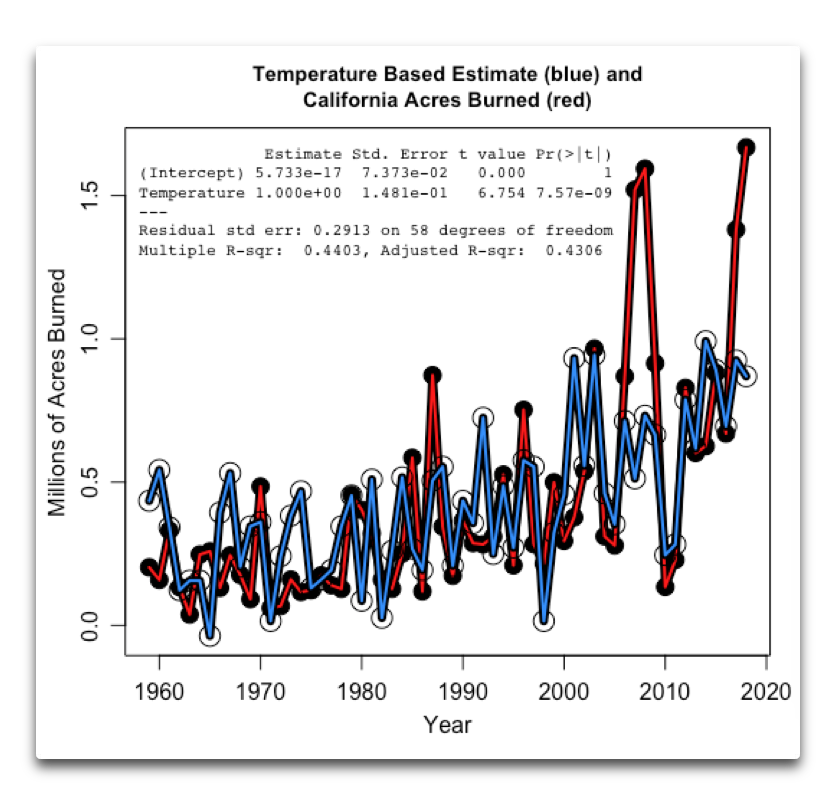
Figure 2. Total areas burned by year, 1959-2018 (red line) and acreage estimated from the variation in May – Oct temperatures (blue line).
Curiously, that looks a lot better than the straight line … but note that there is only a slight increase in the amount of variance explained (44% variance explained by temperature versus 41% for the straight line). This proves once again that our eyes are tuned to see patterns even when none are there … consider the constellations of the night sky as a prime example.
Finally, I looked at the errors in the temperature based estimate of the acres burned. Figure 3 shows the difference between the temperature-based estimate of the area burned and the actual acreage burned.
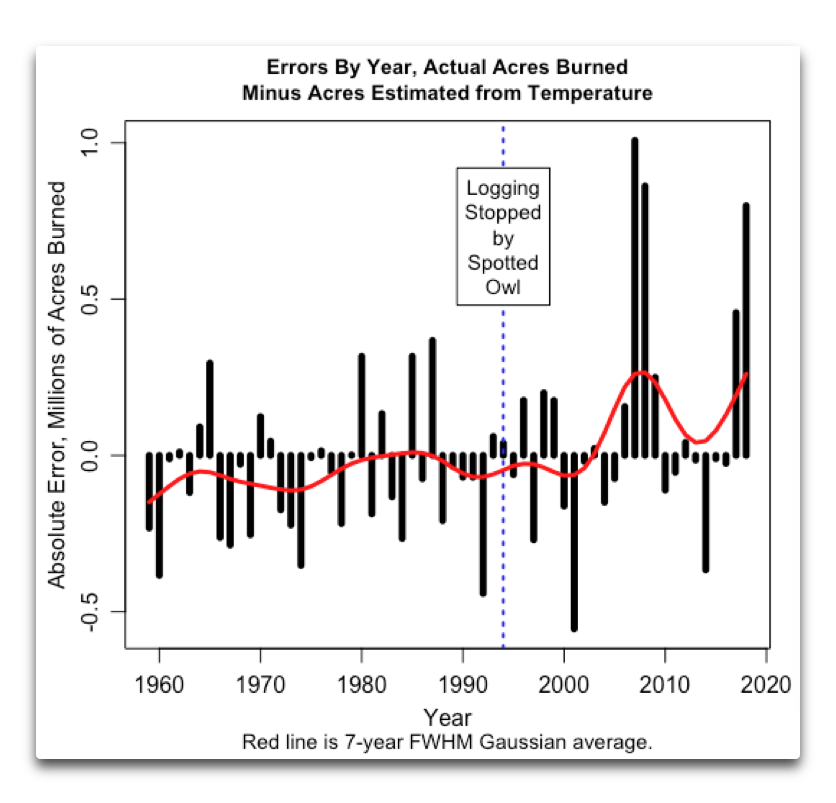
Figure 3. Errors of the estimate.Total areas burned by year, 1959-2018, minus the acreage estimated from the variation in May-Oct temperatures. The red line is a seven years Full-Width Half Maximum (FWHM) Gaussian average of the data. The vertical dotted blue line shows that in 1994, logging was stopped in much of the state in a vain attempt to protect the Spotted Owl.
Here is the oddity of the Figure 3 graph. In the first part of the record, up to the early part of the 21st Century, the temperature generally overestimates the acres burned.
But since then, the temperature has greatly underestimated the number of acres burned.
This is clear evidence that the recent large wildfires are not due to the variations in temperature as is widely claimed.
Conclusions
• Using variations in May to October rainfall do not improve the estimate of the acreage burned. In other words, May to October rainfall doesn’t add anything to an estimate done using May to October temperature alone.
• The variations in May to October temperature are only slightly better than a straight line in estimating the variations in area burned.
• The recent very large areas burned are not the result of variations in May to October temperature. As I pointed out in my last post, the decade over decade changes in temperature are nowhere near large enough to explain the recent increase in the area burned. We must look elsewhere for the causes of these large fires.
h/t to Steven Mosher for pointing out the Rohde analysis.
[UPDATE] Some folks didn’t like the data I used, so here’s some more:
I’m home now, and the smoke is not too bad. Not as bad as it was in the Central Valley or in San Francisco on the way back here. We’re in the yellow area on the California coast north of San Francisco. Smoke map available here, click on “Vertically Integrated Smoke” or “Near Surface Smoke”.
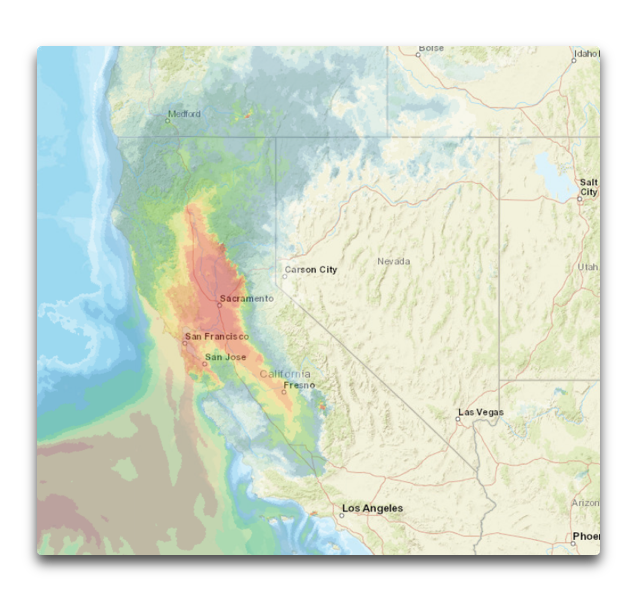
Figure 4. Smoke map. Red is the thickest smoke. The Camp Fire is burning north-east of Sacramento.
My best wishes and hopes for the future for all of those affected by the fires, and my condolences for those who have lost friends, family, or homes.
Regards,
w.
PS—My usual request. When you comment, please quote the exact words you are referring to, so we can all be clear on what you are discussing.
The wise old (spotted) owl knows the reason.
Willis, your final conclusion was “The recent very large areas burned are not the result of variations in May to October temperature. As I pointed out in my last post, the decade over decade changes in temperature are nowhere near large enough to explain the recent increase in the area burned. We must look elsewhere for the causes of these large fires.”
The wild card in any analysis of wildfires is the cause, and if memory serves somewhere about 85% of all wildfires are caused by humans. Maybe population would be better used for comparison.
Regards,
Bob
Bob –
85% of fires may be initiated by humans one way or another, okay.
But in a climate like California has, that accumulated fuel is gonna burn anyway. Just a matter of when.
A careless cigarette, a power transmission arc, a lightning strike. That’s why forest management is so important for the preservation of human life.
Willis’ analysis is masterful. Can’t admire the guy too much. I, too, saw Robert Rohde’s brilliant graphic, and I would have complimented him upon it if I had any inclination at all to indulge in Twitter, but Willis has asked the right question and come up with a most ingenious illustration of what’s going on. Just wish the Governor and his people would actually engage with some of this, but they won’t.
Further observation – You might recall that, 15 or so years ago, a big wildfire ripped through a town in Victoria, Australia, killing ?200+ of the inhabitants. The pictures of that place are eerily simlar to the pictures of Paradise, both before and after. The layout of the town amongst the trees especially. Lessons should have been taken
Rainfall would also contribute to fuel buildup. Does season winter rains increase fuel for burning in the same way CO2 may flow temperature?
In a nutshell, yes. Almost everyone in the PNW knows a wet winter/spring season brings more brush growth. That more growth of adds to fuel load when it dries out over the summer (and it almost always a dry summer). Unfortunately our overlords don’t allow the common people protect their property so we have to stand back and watch it burn. Insanity it encouraged and sanity is derided in this part of the country.
Montana ranks number 1 in acres burnt – about 10% more than California in 2017 – with about a quarter the number of fires.
https://www.iii.org/fact-statistic/facts-statistics-wildfires
Obviously a lot more than temperature affects the size of fires. Spring growth and drying out over summer along with strong winds and large swathes of land with no natural fire breaks.
Hi mothcatcher,
the fire you are referring to was horrific even by Australian standards. We are well aware of the dangers involved and those of use who aren’t in the current crop of SJW’s know full-well what is required during fire season (we know we have a fire season). Unfortunately it would seem that we do not learn from past endeavor.
I was personally involved in the 1983 ‘Ash Wednesday’ bushfires that raged across the southern states, seconded from my Navy duties, in a hellish whirlwind that had the hundred in our group (squads of ten) on the ground armed with rakes and shovels, day and night.
As is the want to politicise the weather, these types of events are common across Australian history, noting (with some sarcasm) that the levels of CO2 were lower in 1983 and for the many fires prior to that. What has increased, I note with some disdain, the numbers for socialist control-freaks has increased over the same period (I know, correlation is not necessarily linked to causation).
The land-owners in the 1983 fires were prohibited from clearing their land. This takes my back to my comment above about learning from our mistakes.
http://joannenova.com.au/2013/01/in-australia-if-you-try-to-clear-a-firebreak-on-your-land-you-could-go-to-gaol/
Have a great day,
Andy
Bob – yup
Not only are humans the proximate cause of the initial ignition of most wildfires, but human management practices have been well known for many decades now to be the cause of conditions that make wildfires much worse than typical in unmanaged wildlands. Primarily because we have allowed way too much fuel to collect by fighting small fires, and by failing to properly clear understory fuel sources.
Yes, the professional forest managers in USFS and BLM have more or less learned this lesson, and for decades have been engaged in prescriptive burns to reduce fuels. But that only applies in well managed forests, which excludes many privately owned forest lands, of which many owners are negligent in their forest management practices, and of course it excludes such active forest management practices most designated wilderness areas. So perversely, while we allow “natural” fires in the wilderness areas to burn, we don’t allow active forest management practices that would tend to limit the magnitude of natural burns.
Hence we got the humongous wildfire in Yellowstone Park back in 1988, which resulted in nearly 800,000 acres (more than 1/3 of the entire park) of ancient lodgepole pine forest to burn in our oldest and most beloved National Park.
When you factor in the other human causes of LARGE WILDFIRE BURNS, the percentage likely approaches 100%.
Privately owned forests are still regulated by the state. That makes management almost impossible, and definitely ruinously expensive to attempt to obtain permits.
The fault is not primarily the owners of forests. (I no longer own property in California. I don’t have a dog in this fight – except that California smoke is nasty in the Reno area.)
Add humans, more houses, electricity to the mix and see what happens.
Maybe oktober-may rainfall is more relevant to determine how susceptible the forests are for fires in the following summer.
I’m baffled by the rain thing. Forest fire fighters pray for rain.
I have heard comments like that since forever. Surely rainfall during the fire season is really relevant.
CommieBob, it is May to October rain, and it rarely rains in California during those months normally. Most of the rain is October to May.
You have it right, Tom!
It is the heavy winter and spring rains that drive significant growth of under story brush, grass, and fuel load over the summer, not the minimal summer and fall rains.
Rainfall patterns are regionalized and vary a lot by geography. In CA, summers and falls are very dry, but in the four corners area to the east, the summer is the wet season, at least part of the summer, typically in July and August that is called the “monsoon season”… with late spring and early summer being very dry with high winds so very high risk for wildfire. In the Pacific Northwest and northern Rockies, the late summer and early fall is the dry season, more like CA. In the southeast US, the late winter and spring is the dry “fire season”.
I should have noted “except in the Mojave”.
Nope, at least in my corner of the Southeast USA, where we get 4.5 feet of rain each year on average (+/- 0.5 feet standard deviation, approximately). November through May is the wet season, averaging a bit more than an inch per week (1.5 inches per week in March, our wettest month). Summer and early autumn are the relative dry times, though active tropical seasons may belay that somewhat. The driest months are September, slightly less than 1 inch of rain per week, on average, and October, about 0.75 inches of rain per week, on average. October and November are the most common times for controlled burns to reduce fuel load. Thunderstorms may happen on any given day all year, too. We are also in our secondary tornado season now.
I think firefighters pray for rain because that is the only thing that makes it possible to put out fires in today’s overly thick forests.
SR
Thanks, Ben. Hadn’t thought of looking at Oct – May rainfall vs. the following year. I’ll take a look when I get a chance.
Regards,
w.
Thanks, Ben, hadn’t thought of Oct – May rain. I’ll look at that when I get a chance.
w.
“Maybe oktober-may rainfall is more relevant to determine how susceptible the forests are for fires in the following summer.”
Agreed. I lived in Southern California for 28 years. The rains, when they come, always do so in the October-May time frame. Summer rains are rare. And the fire seasons were always predictable. A series of wet winters would build up the brush, and then one or two dry years would end with lots of fires.
When I arrived in San Bernardino in late 1980, the entire face of the mountain to the north was on fire. That was the Panorama Fire, and several friends lost their homes to it.
I experienced quite a number since then, and the pattern was evident to everyone.
“The vertical dotted blue line shows that in 1994, logging was stopped in much of the state in a vain attempt to protect the Spotted Owl.“
Technically that’s true. But like the Delta smelt and the San Joaquin River, both were just a ploy to stop something the Environmental lobby wanted stopped. If it hadn’t been spotted owls or Delta Smelt, the environmental movement would have found something else (another critter) to use because predator prey ratios naturally swing up and down in any ecosystem.
The problem with logging of course is that it artificially compensates for an anthropogenic wild fire suppression management strategy. Wild fires (unrestrained forest fires or fires on chapparal-grass lands) once century or so has always been part of the natural ecosystem, until fire suppression altered that equation because fires put human property and lives at risk. So now the wild fires become explosive bombs ripping through over-burdened forest paradises and overgrown chapparal-filled canyon vistas due to heavy ground fuel loads with dead trees and brush/ground detrius.
Now the winter rains of December-March will come to create more misery with mudslides.
And those too will predictably be blamed on CC.
BTW, nice work Willis.
too, not to. (I miss edit)
Joel O’Bryan November 14, 2018 at 3:49 am
Fixed. I hate typos.
w.
There may be a difference between naturalists and environmentalists. Here’s Freeman Dyson’s take on naturalists:
Dyson contrasts untrammeled naturalism with conditions in England:
Human habitation and land use can be very good for biodiversity. That’s the bottom line isn’t it?
Dyson has a rather romantic view of the British countryside with respect to rabbits. At about the time he left for the US rabbits were a plague in the UK (insufficient predation). I recall walking in the countryside and when you looked over the hedge into a field hundreds of rabbits would run away. Everyone ate rabbits, much cheaper than chickens! However their effects on the crops were disastrous, you literally couldn’t shoot enough of them. As a result a fatal disease, myxomatosis, was introduced in the early 50s which almost wiped them out, I didn’t see another wild rabbit for over 10 years. Apparently the numbers are increased but not where they were before the 50s.
Here’s a thought for Joel, Bob, Willis: I grew up in Douglas County, Oregon, the heart of timber industry for the USA. My brother and I had a summer job for a logging company where we were on rapid-fire-response duty in the forest near the logging operation. We did small jobs like road repair, brush removal, etc waiting for a fire to start. Two fires started that summer in our area, one due to lightening and one at a worksite (cause unknown). However, we jumped on both no matter what the cause and held it in check until Forest Service crews arrived. Then comes the Spotted Owl and logging activities and the attendant rapid-response crews, are cut way back. Maybe the correlation Willis detected has a real explanation? Spotted Owl anyone?
Sure, I hear it tastes like chicken. I was in Douglas County last week. I have relatives in Yoncalla.
More humid air from the Pacific flows into California.
https://www.tropicaltidbits.com/sat/satlooper.php?region=atlpac-wide&product=wv-mid
Mr Eschenbach, this graph for Oregon tends to back you up, note the major difference in Acres Burnt.
The dry Arctic air reaches Mexico.

There has been an insignificant increase in temperatures and an insignificant decrease in rainfall in California. However, there has been an 80% reduction in wood harvested from California. It doesn’t take a genius to figure out which variable matters when it comes to wildfires.
http://www.coyoteblog.com/coyote_blog/2018/11/looking-at-causes-of-recent-wildfires-and-resultant-property-damage-its-hard-to-point-the-finger-solely-or-even-mostly-at-co2.html?utm_source=feedburner&utm_medium=feed&utm_campaign=Feed%3A+CoyoteBlog+%28Coyote+Blog%29
The linked report on the condition of forests in California is revealing. The inventory of dead trees is staggering:
https://lhc.ca.gov/sites/lhc.ca.gov/files/Reports/242/Report242.pdf
The state has spent billions on intermittent power generators in a vain attempt to reduce CO2 output. The money would have been better spent managing forests. That would actually reduce the real threat of wild fire disaster.
News reports on the wild fires often implicate Climate Change but at least there is an abundance of information on the condition of the forests and the high fuel load waiting for a spark; which are readily available and provided free.
I’m glad I searched for “coyote” before I made a quick reply with the same link. I can understand the folks for whom climate change is the go to explanation for this kind of stuff, but almost all of them refuse to take even a second glance at what could be much larger influences.
To be explicit about what is implied, the chart on Errors By Year seems to indicate that a new variable was introduced. The final step is to add “log factor” and calculate how many acres burn every year in order to protect owls habitat.
Hi Willis,
The question that comes to my mind is if the increase in area burned happened in places where there would have been logging if it had not been blocked by legal action. I could be mistaken, but I suspect the area near Los Angeles which burned recently was unlikely to have been logged. Do you know if logging would have been taking place in the Camp region? I also wonder about the influence of rainfall in the previous winter; does more rain in the preceeding winter generate more underbrush fuel?
Steve,
Yes and no. The area around Pulga, the supposed ignition point for the Camp Fire, is extremely rugged and probably wouldn’t have been logged because of accessibility. Also, the serpentinite in the immediate area doesn’t support dense pine growth. However, if you go out to Google Earth, you can see evidence of clear cut logging north of Paradise. The real problem seems to be that the human infrastructure in Paradise is actually more flammable than the surrounding wild land, despite a significant fire having ‘thinned’ things considerably in Paradise 10 years ago.
No, the recent fires in Southern California didn’t have harvestable timber. However, 100 years ago, nobody would have been foolish enough to build an expensive, flammable home in the dry scrub-lands.
This is an image from the area around Pulga near where the fire is believed to have started. As you can see it’s not a logging area, what I read was that there was an alarm from here about burning grass in the cleared area below the power line.
 ?w=810
interaction term between temp and rainfall might be what you want
or some of the wildfire potential indices.
or some of the wildfire-potential indices that are used around the world.
Thanks, Steven, I’ll look at that.
Only problem? T-I-M-E, always short. However, I can tell you now that it won’t explain the recent increases in areas burned.
w.
Steve, I added an interaction term. No joy.
w.
Coefficients: Estimate Std. Error t value Pr(>|t|) (Intercept) -20745722 6158685 -3.369 0.00137 Temperature 311127 89589 3.473 0.00100 Rainfall 2434694 1902029 1.280 0.20580 Temperature:Rainfall -36300 27818 -1.305 0.19727It is an old landscape
It is doing what ‘old’ things do – degenerate and die.
One may venture that ‘Fires are cancer’
And how many times does the ‘medical treatment’ of cutting out the tumour simply cause it to spread?
So much for logging or ‘removing the fire load’
Possibly very advanced diabetes. A much better analogy.
Bits fall off, but especially, the body loses its ability to manufacture fat.
Hence the expression ‘Fat of the Land’ A ‘fat’ land is a healthy and productive one. Ask your local farmer for confirmation.
The fat in this case is soil organic matter. A nutrient deficiency or severe nutrient imbalance means the land cannot manufacture ‘fat’ anymore. Soil organics are what makes a landscape= ’rounded’ or ‘rolling’
It becomes thin. Gaunt. Wasted. Wrinkled. Craggy. (Old man) Masculine. Angular. Corroded or Eroded
Residents of Ca, step outside and look around. (others use Google maybe)
What do you see? In one word. First Impression.
First answer *only* accepted and *no* thinking time
Here’s your choice of words:
Masculine
Feminine
Is there any fat out there?
If not, you iz in da big Big Trouble.
Better find that cure for diabetes and pretty quickly…
The obese are much, much more likely to suffer from both diabetes and cancer, so your analogy fails.
Fire is a natural process. It cannot be otherwise in an ecosystem that includes both dry fuels and sources of ignition. Native peoples new this, and fuel-reduction burning was a wise response.
Only moderns have assumed that because we can mostly control fires, that we should. To use a more accurate analogy, it is like trying to stop wolves from killing deer, then wondering why the deer over-graze and destroy their ecosystem.
HOT fires burn all organic matter and leave the soil loose and subject to erosion. COOL fires leave the soil humus intact, but open the understory to permit light entry and release bound up nutrients, resulting in growth.
Native peoples knew this, too.
Rainfall during the May – October period may not be correlated. The issue is rain prior to or early in the fire season followed by lack of rain later. Rain provides for more vegetative growth which then dries and becomes fuel later. Joe Bastardi predicted a rough fire season in California based on the abundant early rain. It always gets dry at some point. Other point is high temperature follows drought; high temperatures due not cause drought they are the result.
Re: Bastardi’s reflexive counter to GW=fire theory is his own idea that seasonal rains grow fuel for western fires the next season strike me as, how to say it?
I watch his daily updates regularly and it always annoys me he never comments about things west of the Ohio River. But then he finally does and I have to pause and remember how I really appreciate his zealous dedication to Atlantic hurricanes and how all the global indicators of snow events line up for a particular zipcode in central PA.
Acreage burned depends on several variables difficult to quantify: strength and duration of winds, remoteness of the burn area, cause of the fire, time to fire-fighting response, magnitude of fire-fighting effort, etc. It’s not surprising the ones easiest to measure, rainfall and temperature, have little correlation.
Oh noes. https://www.nbcnews.com/mach/amp/ncna935261
See also: http://www.coyoteblog.com/coyote_blog/2018/11/looking-at-causes-of-recent-wildfires-and-resultant-property-damage-its-hard-to-point-the-finger-solely-or-even-mostly-at-co2.html
No matter how a fire ignites, a forest fire becomes dangerous because of the weather conditions allowing it to start and to grow. The potential for forest fires is often indicated by the Haines Index (HI) that has been widely used for operational fire-weather forecasts in regions of the United States, Canada, and Australia. Several studies have shown a positive correlation between HI and observed fire activity. And yes there is correlation between HI and oscillations like ENSO.
“The Haines index (HI) is a fire-weather index that is widely used as an indicator of the potential for dry, lowstatic-stability air in the lower atmosphere to contribute to erratic fire behavior or large fire growth. This study examines the interannual variability of HI over North America and its relationship to indicators of large-scale circulation anomalies. The results show that the first three HI empirical orthogonal function modes are related respectively to El Nino–Southern Oscillation (ENSO), the Arctic Oscillation (AO), and the interdecadal sea ~ surface temperature variation over the tropical Pacific Ocean. During the negative ENSO phase, an anomalous ridge (trough) is evident over the western (eastern) United States, with warm/dry weather and more days with high HI values in the western and southeastern United States. During the negative phase of the AO, an anomalous trough is found over the western United States, with wet/cool weather and fewer days with high HI, while an anomalous ridge occurs over the southern United States–northern Mexico, with an increase in the number of days with high HI. After the early 1990s, the subtropical high over the eastern Pacific Ocean and the Bermuda high were strengthened by a wave train that was excited over the tropical western Pacific Ocean and resulted in warm/dry conditions over the southwestern United States and western Mexico and wet weather in the southeastern United States. The above conditions are reversed during the positive phase of ENSO and AO and before the early 1990s.”
My synopsis is https://rclutz.wordpress.com/2016/10/11/fearmongers-fan-forest-fire-flames/
Lookup these topics. Fuel load. Ladder fuels. Probability of ignition. Area burned will be a combination of these factors. This is well understood science.
There is good software out there that does this.
Historically, most of the US burned on periods of 10 to 30 to 100 years. Suppressing fires each year just pushes the problem into the future, catastrophically.
The long term solution is to burn like the native indians did and to manage the forests next to the urban areas more closely. Ie thinning and regular backfiring to keep fuel load on the ground near zero. We also need fire codes that require inflammable roofs and vegetation management.
Stay safe Willis and Anthony! I note that you did the analysis for the ‘wildfire’ season May – Oct, the events of this week appear to be related to the non-arrival of the rainy season this November. Historically as I understand it the fires in October that cause the most damage in part due to the Santa Ana winds that occur then. Any extension of the season into November seems likely to increase the likelihood of major fires? Looking at the Oroville catchment area data they’ve had 0.24″ of rain since Oct 1st, before that the last rain was May 26th. Last year rain started on Oct 19th with about 5″ by this time.
Watching my house catch fire in Malibu Park last Friday afternoon, I can offer the following observations;
1. The hill sides have very few trees, the bottoms of the valleys have a few.
2. The plant matter on these area burns like a Christmas tree after it’s set in your house for three weeks, imagine tens on thousands of those trees per acre.
3. Now add a 50-60 mph wind coming in from one direction, ocean breaze from another.
4. Humidity is 20 percent.
5. The intense heat causes anything that normally would to be too green to catch fire under normal circumstances to burst into flames.
The effect is like a blowtorch, impossible to stop, and very efficient at burning thousands of acres in a single day. I used to wonder how people and firefighters get killed in something as obvious as a brush fire, I now know. These fires can easily project themselves hundreds of yards beyond what appears to be the fire line. Small fire tornado appears to pickup material as I had gravel bouncing off the hood of my car a half mile or more from the fire line.
Unfortunately, this tinderbox scenario is the status quo in much of southern California. The only solution to the undergrowth problem that has any practically would be millions of very hungry goats and thousands of miles of fences, and then trying to seed the areas with a nonflammable plant that provides some form of watershed.
My thoughts are with you all.
In Ontario we’ve just been provided with this information: ‘Woman Claims She Was Contacted about Faulty Power Line Prior to Fire’:https://www.theweathernetwork.com/news/articles/p-g-and-e-sparking-power-lines-prior-to-california-camp-fire-wildfire-butte-county-calabasas-november-2018/116862/
My apologies if this is old news but it triggered for me a memory of a story, that seems to have disappeared now, of the loss of a massive number of acres here in northern Ontario, which was first reported to have been started by equipment used by an industrial wind turbine company in the midst of ruining one of our wilderness treasures.
This is the original story. referred to above, where CBC reported the cause:
https://www.cbc.ca/news/canada/ontario-forest-fire-wind-farm-construction-1.4758864
Have you done the regressions on the subset of the data that extends only to 1994?
An interesting first analysis. But to get a good correlation the auto-correlation should be removed from both series first.
It is suggested forest management is the problem. This could be true for forests. But Paradise is not a forest. So why was it destroyed?
Perhaps house construction needs investigation. If a house fire happens and the wind blows then the current situation suggests the fire will spread to other houses (see great fire of London).
The American Meterological Society has just released a report into last year’s fires in N Cali. I didn’t realise that the power companies had put anti trip devices into their equipment. Instead of tripping off and staying off until a human intervenes, they now trip off and on and off and on etc. Which causes sparks…
https://www.google.com/url?q=https://journals.ametsoc.org/doi/abs/10.1175/BAMS-D-18-0037.1&sa=U&ved=0ahUKEwjzysi4ldTeAhXMpIsKHRsKAGUQFggEMAA&client=internal-uds-cse&cx=006604013691433161533:cni8ugxqzym&usg=AOvVaw0I-qCBNUz1FU-Q-RX05JnV
True, for most Utilities now, an Auto Recloser (AR) is used to deactivate the line temporally for 8-10 seconds, and then if no fault is detected, then the AR closes to line and reenergizes the circuit voltage. When it is hot out, there is more line sag, and when faced with a larger wind, then more line slap happens. If this keeps happening over and over, then the chance of a spark becomes more likely with every slap and auto reclosing event to spark up a fire. It may be better to revert back to the manual thermal fuse, where when it blows, a new $7 fuse has to be manually reinstalled. (e.g. a 6 amp cutout fuse on a single phase 25 KV line)
This way, someone actually has to drive out to the general area where the fault happened and install a new fuse at the top of the pole. A general inspection is then carried out of the entire line to observe any hanging branches etc, whatever is causing the fault. Line slap is more difficult to assess as there is no real evidence of anything happening if you don’t see it happen, except maybe a sagging primary line up top between spans.
The Auto Reclosers are real handy in that they function automatically, and generally keep the power on which is a real blessing for home owners in a windy rainstorm. (and cost less for the Utility over time) However, if something like line slap is happening in a raging Santa Ana wind event when it is Extreme High burning conditions, then a thermal cut out fuse shuts the power off until a human investigates and installs a new fuse might be a better option. Maybe something obvious like a sagged line or a branch/tree limb arcing is then spotted that can be remedied for that problem. It does look like power line companies have some responsibility here.
As you can see in the photo I linked to of the area believed to have been near the source of the fire the landscape is very rugged and manual inspection would take a long time. You’ve got high voltage power supply lines from hydroelectric dams up in the mountains being buffeted by high speed Santa Ana winds. The areas being supplied would possibly suffer multiple loss of service?
I haven’t looked up exact details, but the Orville Dam generating plant is producing 800+ Mw High Voltage 3 Phase out of their sub station. Probably 500 KV on huge steel towers. Those aren’t the issue with starting fires that I am aware of. The problems are local Distribution 3 Phase 25 Kv or especially Single Phase 14.4 Kv distribution lines that are slapping between the neutral and the primary, serving the local community on multiple feeders which are locally protected by cut out fuses or voltage regulators/reclosers at different points.
Most local transformers are served by their own cut out fuse, (or should be) just to protect that transformer from things like local lightening strikes. If that fuse blows, especially if there is a fault on the 240V Triplex side, it only affects that service past that transformer and not even the entire feeder line. It all depends on the code for that area and utility how everything is protected. Not all feeder distribution lines would lose power, only the affected one. That still might mean 300-400 local customers though, but not the entire region.
Usually, the local distribution feeders at single phase 14.4 Kv follow existing roads and local R/W’s as they feed the neighbourhood through the trees and urban forest. This is also usually the weakest link in proper brushing and clearing of dead danger trees in the R/W. They are easy to inspect by just driving the route. This is where a lot of these Auto Voltage Regulators/Reclosers are located.
The question is, do we want the inconvenience of a local power outage every line slap with a manual reset/human inspection/installation of a local fuse that affects a smaller subset of the population, or take the chance with the automatic voltage reclosers that continued sparks from a line slap that keeps getting worse as that sag increases from arcing/heating the aluminum/steel #2 ACSR (Aluminium conductor steel-reinforced cable) with every line slap fault. At some point, it just melts and the line is physically separated, although it is has probably caused a fire by then if it is conducive to burn. Perhaps most of the year on the reclosers, but able to set to manual fusing might be a partial solution. The first line slap event could also cause the first spark/fire. No easy solution, although I read that the local utility can cut the power completely in severe Santa Ana wind events when things are extremely dry and conducive to burn.
You may be correct Phil…I am seeing reports of PG&E experienced an outage on the Caribou-Palermo 115 kV transmission line in Butte County and also nearby to where the fire started. But PG&E is also denying that it was this 115 kV transmission line, and said this line had already be de-energized and work had been pre-planed and had sent an email to Betsy Ann Cowley where the transmission tower was located on her private land.
There seems to be confusion about which transmission line caused a fire, and which was the report to the Regulator of an incident. I also see a report of what looks like a downed lower voltage distribution feeder line in the same vicinity, which I was discussing above. Obviously both can cause sparks, although usually a high voltage transmission line is built to a much higher standard, with no vegetation issues at the elevation of the high tension wires. But there appears to be equipment malfunction, so not sure what that means. A spark could definitely fall from the wires and start the grass on fire and then it is gone. I think we will have to wait for the investigation, and police have sealed off access to this area as a crime scene.
But I also see PG&E is quickly getting on the bandwagon with the climate change CAGW being the principal cause behind all these wild fires. I guess this will be their insurance of ‘last resort’ and appeal to the State and the Governor for relief.
Sounds like reclosers. After tripping from a short they automatically try to reconnect 3x before remaining open and requiring manual intervention. They save a lot of work because sometimes dummies like me miscalculate when they drop a tree and unintentionally slap the line (large tree on slope detached from stump when it fell, which changed the arc of fall). All I had to do was reset my house circuit breaker, and the neighbors caught a break.