This year’s Arctic sea ice minimum is just a few days away, but it isn’t going to be a new record low, in fact, it’s likely to come in within 2 standard deviations

By Harry Wilkinson
Arctic sea ice is proving remarkably reluctant to enter its appointed ‘death throes’, despite the usual suspects having already planned the funeral. Climate Change Anxiety Disorder, it turns out, is yet to impose its angst on the actual climate, no matter how hard the BBC tries to make it.
The latest observations show that Arctic sea ice is on course to have a greater minimum extent than in 2015 and 2016, and is running higher than levels seen a decade ago. Back then, the BBC reported that Arctic summers may be ice-free by 2013, although this estimate was described as being ‘too conservative’.
That prediction was spectacularly wrong, and contrary to warnings of an ‘Arctic death spiral’, sea ice extent has been remarkably stable in the last decade. No one can say what exactly will happen next; if this humbling affair teaches anything it should be precisely that.
The climate has misbehaved in other ways too. The Greenland Ice Sheet has been gaining mass at a record rate for the second year running, and Antarctic sea ice extent is perfectly normal relative to the 1981-2010 average. These facts get little coverage because they don’t sound alarming at all, and for most reporters that means they’re not news. These ‘inconvenient truths’ are nonetheless a helpful reminder that climate change coverage should be taken with a healthy dose of scepticism. There is a long way to go before we can make accurate predictions about how the climate will behave, if indeed we ever can.
Climate science has to be more deeply grounded in real-world observations rather than models that are inevitably riddled with flawed human assumptions.
It looks like the “baby sea ice” has survived!!!
I remember that. It must be about 10 years ago on Climate Audit?
I think the baby ice was the creation of Charles the Moderator right here on WUWT… pure brilliance!
Greenpeace needs to go out there with clubs and bust up the baby sea ice so the data fits the narrative.
I showed two years back that the reversal started in 2007. So much for simplistic claims that less ice means more warming; leading to run-away melting.

https://judithcurry.com/2016/09/18/is-the-arctic-sea-ice-spiral-of-death-dead/
The death spiral is dead.
[The mods get a 404 error on the second link to Dr Curry’s website. .mod]
Greg,
Will be instructive to see this year’s date of minimum. Could be this week. Not a prediction.
That is a bad news, every year adding a bit more, in no time NH will slide into another ice age.
Waiter, more global warming please.
Ooooh – ‘baby sea ice’! The ‘baby sea ice’ is essential as a nursery for cuddly baby fur seals, which are ruthlessly hunted, torn apart, and ravenously gulped by the apex predator polar bears.
Emotional appeals just makes one feel warm and fuzzy all over, don’t they?
Until, that is, they are placed in context with the harsh realities of Darwinian survival.
We have to do it for the ‘chillins’.
+32!
Comparing the current level with the base one : 1981/2010, ?
It’s hard to make predictions, especially about the future
Sometime in mid-2020 the comparison will be switched to 1991-2020.
http://w1.weather.gov/glossary/index.php?word=normal
Mother Nature continues to be the biggest global warming denier of all. Humans have settled the science. Who does she think she is to not follow it? In a just world, she would have been tried, convicted, and punished years ago. How long will we allow her to continue before we hold her accountable for the misery she inflicts?
Paging Al Gore, paging Al Gore….;
I think you just wrote my next t-shirt:
‘Mother Nature is a Climate Skeptic’.
Please don’t encourage them. Many way over the top alarmists are calling for widespread geoengineering.
It is interesting to watch the ways the “Death Spiral Believers” keep their beliefs. Here is a study stating “uncertainty” in the models means we may have to wait 100 years before the arctic is ice free…..but it will, it will, it will be ice free….any century now.
https://agupubs.onlinelibrary.wiley.com/doi/abs/10.1002/2016GL070067
And here is an article by someone who was on the Akademik Ioffe when it grounded in the Arctic a couple of weeks ago. It is interesting because at no point do they mention there is more ice this year than last year. Instead they produce wonders such as, “Sea ice is still a problem, perhaps even more so as it continues to recede” because “the increasingly chaotic nature of the climate system in the Arctic is making it difficult to predict how sea ice is going to behave.”
https://e360.yale.edu/features/in-the-melting-arctic-harrowing-account-from-a-stranded-ship
I’m curious why they use +/- 2 SDs. I would like to see the graph show +/- 3 SDs.
One SD is 68.3%, 2 SD is 95.5%, 3 SD is 99.7%. Much additional information going from 2 to 3 SD?
That assume a normal distribution which may be a decent assumption, but I see some people think those values apply always.
littlepeaks
+/- Two std deviations are a common definition of “what is the normal random difference (deviation) from the average value of this measurement? How big should a measurement be from the average before I consider it “unusual” or “excessive”?
However, that is a statistical tool. For +/1 2 std dev’s to be meaningful in real life, several other things MUST OCCUR in the problem:
The “average” of the measurements must be constant, must be accurate, and must be meaningful.
The distribution of errors or differences or changes must be randomly distributed around that average: The erros are assumed to be a Bell Curve around the average. If they are not (if there are more high differences than low differences, there are still ways to calculate the std deviation, but those calc’s are rarely done. Note that I used “differences” from the average – just because some measurement is different does not make it wrong, does not make it an error in science. (In manufacturing – Yes, a difference from the intended design is almost always an error. In farming, a super-sized pumpkin may be a prize-winner! A super-fast runner may be the next champion, a super-steady gymnast or rock-stiff ballet dancer may be the next star.)
In sea ice extents, the 1980-2010 “daily average” is clearly NOT steady with time: Only once since 2006 has ANY daily sea ice extents been above the average! Clearly, the differences (deviations) have ALL been negative for more than 1/2 a “climate length” of 30 years, so the old idea of an “average sea ice extents” for any given day is incorrect.
When you look at 3 year and 5 year averages, you see a very a near steady maximum from 1978-1985-86, then a steeper decrease from 1982-1983 high through 2004-2005, then a steadying from 2006-2012. We are now beginning the increase back towards some future cyclical maximum.
This is true for any cyclical event:
The increase in daily temperatures from January through April CANNOT be used to extrapolate the temperature in August, Sept, or November.
The average of July, August, and Sept CANNOT be used to calculate the temperatures in April or May.
The number of hurricanes in Jan-Feb_March CANNOT be used to predict the hurricanes in Sept and Oct off of the US coastline.
But, one can use the September (or similarly for other months) multi-year average to predict the probable extent of next year’s September ice coverage. Or more correctly, the improbability of exceeding the 2 SD of the series.
It is a cyclical range of values – not only from its month-by-month, but it varies over a 55-60 year cycle as well. The climastrologists are using the simple 1980-2010 averages for each day. Which is fine – but they ONLY use the first half of the long cycle: They are using the higher half of the cycle (as if the average of every day’s maximum temperatures from May through August for 1980-2010) to compare with the Dec-Jan-Feb temperatures of 2018. And then proclaiming there will a catastrophic low temperature in 2030!
Yes, you could use it.
No it would not be accurate.
2007 and 2012 should give pause for thought.
No one saw those coming, or the most recent improvements.
Angech,
I respectfully beg to differ. All those who have studied the history of Arctic ice expected the upturn about 30 years after the downturn.
“I’m curious why they use +/- 2 SDs.”
Because if they used their best estimates of measurement uncertainty the entire data series, and all discussions based on it, wold be meaningless. All years would fall inside the uncertainty bars.
Do we have enough examples of well recorded ice minima to calculate what a standard deviation is?
Yes, we do have enough information to know how to calculate a std deviation.
We do NOT have enough measurements to calculate what the yearly AVERAGE should be to determine WHERE that +/- 2 std dev band should be!
What if alarmists were to say, since they hypothesize a current ice level is significantly below the mean, that a one-sided test is appropriate and makes it easier to reach the rejection level at any selected value of alpha? What’s the rejoinder?
The only real answer is: “We do not know the Arctic ice cycle: We have observed it for now about 5/8 of one probable cycle period. Not even one: We know absolutely the maximum possible Arctic sea ice extent (14-15 Mkm^2 over the Arctic Ocean when it freezes over in late March + 2-4 Mkm^2 further south at 60 north latitude (Sea of Okhotsk, Hudson Bay, Bering Sea, Gulf of St Lawrence.) We know the fall minimum (0.0 Mkm^2) in mid-Sept. That is all we know. Calculations show there is no “Arctic Death Spiral” because too little sunlight falls over the summer to make up for a year-long extra loss of energy. Beyond that, we do not know. “
RACook, we know two things. 1) The earth is getting warmer and 2) Arctic sea ice is in decline.
.
.
Please explain to us why these two things are happening.
Thanks in advance.
Climatereason,
We also know that Earth has been getting cyclically warmer for about 300 years during its 3000 to 5000 year-long secular decline.
We know that during that time, Arctic sea ice has waxed an waned in about a 60-year complete cycle. The latest waning cycle apparently ended in 2012, and now it’s waxing again. No CO2 need apply, especially since Antarctic sea ice strongly waxed while the Arctic waned after 1979.
We know that the Earth was getting warmer long before CO2 took off, and that it has enjoyed warming cycles much longer in duration and stronger in amplitude before the “industrial age” than before, as when coming out of the Maunder Minimum in the early 18th century.
We also now know that Arctic sea ice is no longer in decline. It’s yet again cyclically waxing.
Thanks, all.
Ice. A slippery subject.
That’s cold.
…And that’s just the tip of the iceberg.
Cool it lads
You’re cracking me up.
‘Tis indeed slippery subject.
I’m going with the floe.
You risk a frosty reception. Or a reception of frost. Or something. Maybe.
Watch it, you’ll cause pun-haters to meltdown.
No, it is actually worse than that.
Today’s 10 Sept NSIDC Arctic Sea Ice Extent chart is out for the last three weeks :
2018 Arctic Sea Ice Extents are higher than 7 of the previous 11 years’ going back to 2007.
2018 recently passed 2008, has been larger than 2007, 2008, 2011, 2012, 2015, 2016, 2017. In a few days, 2018 will most likely exceed 2010 as well – making 2018 larger than 8 of the past 11 years!
In fact, 2018 is simply right above the middle of the most recent years’ sea ice extents, staying at -2 std deviations from the (too high) publicized daily average all year.
True, 2018 is less than the “accepted” 1980-2010 average Arctic Sea Ice Extents, but the “accepted” linear trend line for Arctic Sea Ice also begins above any recorded Sea Ice extents, and continues down well below any recent measured sea ice extents.
The much-publicized trend simply linearly extrapolates what appears to be a 60-70 year cycle down towards 0. Because it has to go to zero: CO2 is increasing near-linearly, therefore Arctic Sea Ice must decrease in a matching straight line if sea ice is to be used as a symptom and a publicity number.
A simple 55-60 year cycle, maximum at 1982-1983, minimum 2006-2012? Can’t have that.
Sigh… and the ship of fools didn’t get stuck in ice, it ran aground.
Perhaps due to sea ice occupying the navigable waters, having run aground itself because of its submerged mass.
Right on Pop. Observers said it wasn’t where it was supposed to be because of the ice. Hanseatic cruise ship was smarter and returned to Greenland.
https://rclutz.wordpress.com/2018/09/08/cold-summer-in-nunavut/
Sigh…and the ship of fools ran aground trying to evade the above-expected quantity and thickness of ice.
Who here is surprised that the amount of ice in the NW Passage was high this year? Anyone? No hands at the back? Right then.
It was an interesting adventure and probably taught the participants something they would never have otherwise believed even if they were told 100 times: the NW Passage is not open, is not going to open anytime soon, and they will just have to wait until it is, either until the world gets a heck of a lot warmer, or until the next interglacial.
The interesting issue about this sea ice is that LWIR between 13 and 18 microns won’t melt ice. In fact, ice emits a shorter wavelength than CO2 does.
Why CO2 is Irrelevant to the Earth’s Lower Atmosphere; You Can’t Absorb More than 100%
https://co2islife.wordpress.com/2018/09/08/why-co2-is-irrelevant-to-the-earths-lower-atmosphere-you-cant-absorb-more-than-100/
Hello sir, I just visited your site and read through your work. another commenter on here made the claim, I interpret as, “we aren’t weighing 15um adequately and it is more important because of the peak Earth’s 255K maximum emission”
https://wattsupwiththat.com/2018/09/09/empirical-evidence-shows-temperature-increases-before-co2-increase-in-all-records/#comment-2452737
Would you please engage with him so I can watch it unfold and attempt to digest your opinions on the matter? Many thanks.
Excellent. I’ve always been interested in the infrared details of the matter. The part of the spectral window painted black by CO2 can’t be painted any blacker with more CO2. All I’ve seen is one unconvincing comment about the edges of the absorption band letting IR rays go higher.
Wait a minute, isn’t your denial of any greenhouse sensitivity at all contraband thought even for this site?
You guys keep up this talk and you will convince the Ship of Fools to not set sail. Then who will feed the starving polar bears?
The three Frenchmen aboard a iceboat-catamaran made it safely to Sachs Harbor way up on Banks Island. They very nearly were food for one big bear. I greatly enjoyed the pictures they sent all summer. They gave a clear picture of both the melt and the start of the refreeze, no matter what their politics may be.
https://sunriseswansong.wordpress.com/2018/09/10/arctic-sea-ice-peppered-polar-bear/
If only they had a big hurricane hitting the East coast they could latch onto…
It is the possible track of Helene towards the Bay of Biscay by Tuesday 18th Sept that has got my attention.
Maybe it’s just plastic being misidentified? /sarc
I was wondering, if there actually is as much plastic in the oceans as the activists have been claiming, wouldn’t that be enough to raise water levels?
Arctic sea ice is not kowtowing to a forecast. Well, now what are the Warmians gonna do?
If it is, in fact, growing then isn’t that an indicator that we may have a normal to possibly excessively snowy winter in various places? (I don’t mind snow. Just do not want really, really bitter cold.)
This report makes me very happy. It is nice to see another “alarm” message refuted by hard evidence.
It is commonly assumed that changes in Arctic sea ice can be interpreted in terms of AGW and moderated by cutting emissions but the data do not support such a relationship.
https://tambonthongchai.com/2018/08/04/does-global-warming-drive-changes-in-arctic-sea-ice/
Thank you for this link! I have come to believe that our present warming period is most likely caused by the opening of the Arctic making Northern regions into a marine climate. This is most likely a cyclical event caused by heat trapped in Arctic ocean water under the ice until it overwhelms the cooling effect of Northern winters. Once the ice opens, wind and summer sun contributes to the opening even as the waters cool in winter. Eventually they cool to the point that the ice grows more in winter than it melts in summer. As the ice covers the Arctic ocean the heat begins to build again.
The ice extent is a balance between the air temperature and the ocean temperature, wit complicating factors of winter heat loss, summer heat gain and wind.
that right there is the position i have john. the observations support the case. could the wax and wane of arctic sea ice be the driver of the amo ?
I’m confused. Save the ICE! Abolish ICE! What the heck do they want?
It is counter-intuitive, but the classic Arctic Death Spiral so often spouted appears to be backwards.
Calculations using Arctic sea ice albedo measurements, the Russian North Pole2-32 Drifting Ice Stations radiation measurements, the SHEBA experiments on ice, and at-sea ocean albedo measurements show the opposite: Less sea ice all year-round means “More heat is lost from the newly-exposed (darker) Arctic Ocean over 12 months than is gained by the Arctic Ocean in the short 5 months of summer.”
Less sea ice = Cooler Arctic ocean.
The opposite is true for the sea ice further south at 60 north latitude, and for the Antarctic sea ice. Closer you get to the equator, the more correct the classic calculation becomes: Less Sea Ice = A warmer ocean surface.
Yes! Our present slightly higher Northern Hemisphere temperatures area symptom of a period of higher global heat loss. This swing is governed by the Arctic ice extent.
Well… I was making a little joke, but thanks for the technical info.
Never let a good oppuntunity go to waist. 8<)
A waist is a terrible thing to mind.
i tried to make this point with jim hunt.it appears many arctic alarmists will partake in mental gymnastics to deny basic physics. funny as they appear to like the term “basic physics” when uttered by those of an alarmist persuasion.
Another reason AGW messaging always targets the young – they haven’t been through several decades of failed Doomsday predictions. Yet.
Article: Climate science has to be more deeply grounded in real-world observations rather than models that are inevitably riddled with flawed human assumptions.
There is an old saying: If the map says there is a bridge and there is no bridge believe the terrain.
“. . . and there is no bridge . . .”
Been there-done that. Cost me an hour of back track.
I don’t get it….the AMO has been increasing since 1975….the Atlantic flows directly into the Arctic…sea ice is 90% under water
Isn’t this exactly what you would expect?
The AMO has plateaued now….so ice should too
https://en.wikipedia.org/wiki/Atlantic_multidecadal_oscillation#/media/File:Amo_timeseries_1856-present.svg
Yep. If the AMO acts like it has the last 100 years or so, we should see growing arctic ice and cooling temps around the north Atlantic. I think we are in the midst of a very interesting natural experiment.
As is well known, sea ice is said to be critical to polar bear survival. So I thought I’d look to see what the experts have to say about polar bear population estimates now and in the past. I found this link:
Are polar bear populations increasing: in fact, booming? Dr. Steven C. Amstrup
If you follow the link, Dr. Amstrup absolutely does not tell you if polar bear populations over the last several years have increased or not. Dr. Amstrup is the chief scientist for Polar Bears International.
steve case
It is not in Dr Amstrup’s financial nor political nor public-relations interest to admit that polar bear populations have been increasing dramatically in 23 of the 24 polar bear groups arctic-wide. To do so would undermine his position, his funding, his power in the world news media.
Check out Susan Crockford on this. Polar bear populations survived much warmer climes than this and have increased over the last 20-30 years.
Amstrup was the lead author on the USGS report (2007) used to support the 2008 listing of polar bears under the ESA. It was his opinion alone that was used in the models to determine how polar bears would respond to declining sea ice.
By his own admission (in an interview he gave, don’t have the link at the moment), he joined PBI (as a paid employee) so that he could be a more effective advocate. To say he has a vested interest in polar bears being ‘threatened’ is an understatement: his professional reputation, his legacy, is dependent on that outcome.
Sea ice unpredictability and polar bear resilience has made Amstrup look a fool and he is not happy about it. His buddy Ian Stirling is in the same boat.
Thanks Susan,
I wondered if you would appear.
Folks should realize that your name (above) is a link to your site.
Several hours of reading there should help those interested in the topic.
As is well known, sea ice is said to be critical to polar bear survival
Of course. They can’t drink salt-water…..
/sarc if necessary
Is there only one cooperating doomsday climate prediction ?
Can’t remember !
WUWT posted up similar at this time last year …
“https://wattsupwiththat.com/2017/09/19/arctic-sea-ice-extent-ends-up-not-even-close-to-setting-a-new-low-record/”
Then we got this …..

The 2nd lowest max extent in the sat record (previous year being lowest).

AGW is impacting winter arctic sea-ice growth to a greater extent than summer melt, as can be seen from from the series of warm winters….
Looks exactly like the AMO…and exactly what you would expect
Except that winter sea-ice growth was declining during the cold phase (up until the mid 90’s). I would expect sea temp to be maximised in the winter as a means of inhibiting ice growth.
Be listen to the same garbage for years now Anthony. kept hearing the north pole will be ice free next year for sure, so I started betting them that if they are right I would leave WUWT and never post again and if they weren’t they would leave. I am still here, they are not, so how about it bud you want to take the bet? You let us know when the north pole will be ice free and I’ll bet you it won’t, you pick the time the year whatever.
i have a 1k bet with jim hunt out to 2022. the data set we were using appears to have come to an end .amazing how this is supposed to be the greatest threat to mankind yet when the data doesn’t support the narrative these important research programs suddenly lose funding and come to an end.fortunately climate science supported techniques will make it an easy comparison to other data sets.
“kept hearing the north pole will be ice free next year for sure,”
No you didn’t Bob … except in the sense that it was the statement of one potty professor (Wadhams).

Arctic sea-ice decline is actually ahead of IPCC projections.
Less ice in the winter just means more heat escapes from the planet.
Only because there is more heat.
You have no concept what a negative feedback is, or why they are good things?
Do you?
Why is there less ice? More heat.
Why is there more heat escaping? More heat.
On your planet more heat means less heat right?
[?? .mod]
Just as I thought, Ryan has no idea what a negative feedback is and why the existence of them proves that CO2 can’t be a problem.
You’re the only one talking about heat, so your attempt to put words in my mouth fails.
But then again, thinking logically has never been something you are good at.
No: It’s because the emissivity of open water is high, while that of ice is low, and provided that cloud cover doesn’t interfere, that leaves a fairly direct path to space during the long winter night.
You’ve used too many big words, Ryan won’t be able to figure out what you are talking about.
It doesn’t add up…
No, I will disagree with you there.
The LW emissivity of open ocean water (between -2 deg C and 4 deg C) and sea ice (the ice surface varies between -36 deg C and 2 deg C) are very nearly identical: 0.96 and 0.965 (Sources vary a little bit, emissivity varies slightly with temperature.)
However, the SURFACE TEMPERATURE that is emitting at T^4 power is VERY different. The very much warmer open ocean water emits many. many times the LW radiation that the very cold ice surface does. Then you must add in extra evaporation losses (none for an ice-covered surface), increased convection losses from the open water, and the insulating effect of 2-3 meters of solid ice between the ocean top and the cold winter air. No ice no insulation = Greater losses to the air.
Those increased losses (that difference in surface type and surface temperature), over a 365 day year, more than makes up for the short summer days when more solar energy is absorbed.
Agree with everything until: “…more than makes up for…”.
but that is where you go wrong.
Because if it were true, the Arctic Ocean would be getting progressively colder. It is not, it is not “more than”. For the last several decades it has been less than. The only way it can emit more is by being warmer. Of course it is a negative feedback, but higher emissivity is just a consequence of a higher temperature.
Not true. More heat is lost from an exposed ocean surface year-long than can be gained over those short 5 months of summer (mid-April-mid-August).
Now, you CLAIM that the Arctic Ocean is heating up, but you do not show measurements of the arctic ocean surface, middle or deep temperatures.
You CLAIM that the Arctic is warmer – and mid-winter air temperatures are indeed warmer than earlier mid-winter air measurements.
Guess where that “heat energy” from those newly-exposed millions of sq kilometers of open Arctic Ocean is going?
First from the ocean deeps, to the ocean upper surface, to the air above the exposed ocean, then to the infinite black cold of space.
Mid-summer air temperatures today are exactly the same as those first recorded/predicted by DMI in the mid-50’s.
Same with the Russian NP-2 to NP 36 surface measurements. Mid-summer air temperatures are the same as they always have been.
If I remove insulation (convective, conductive, evaporative, and LW radiation) resistance between a hot object and an infinitely cold object, the source becomes colder, the middle warmer, the sink does not change. The warm object does not become “warmer” by removing the insulation – by increasing the losses from the warm object.
Now, if indeed the Arctic sea ice extents are now increasing (as they appear to be for 1/3 of our actual measurement period) then this is the feedback needed: Less Arctic sea ice = increased losses to space = a cooler arctic ocean = greater sea ice extents during an extended growth period of sea ice => Greater insulation effect (less open ocean heat loss to space) (1970’s) => Warmer Arctic oceans under the larger areas of sea ice (1980’s) => trend back towards the faster melting of what sea ice is excessive (1990’s and early 2000’s)=> and a slide back towards today’s “too low” period during which the open ocean is losing “too much” to remain static.
See, you only think the Arctic Ocean was ever stable at one constant temperature and one constant sea ice area from year-to-year. (it always cycles from maximum to minimum every year.) But it is never “stable” in thermal equilibrium from decade to decade except in a simplified physics classroom.
You completely miss my point. Despite what you write the Arctic is warming, the source for some of the warmth is advection. The overall net is a warming.
the reason winter temps are warmer is due to the increased area of open water. the water itself ,especially at the surface isn’t warmer in winter than it would be if insulated by ice. all that fiery red and orange in sea surface temp charts is just the difference between an open water surface and ice.
if you are convinced you are correct let’s have a bet on when all the ice will disappear.
If the arctic is warming, why has ice been increasing for the last 6 years?
Well, it has been steady (or increasing) for 11 years now, not 6 years. You’re focusing too narrowly on the single “extreme minimum point” of 2012, Not the broader, far longer low point of the cycle.
I’m getting the impression that you actually believe that any warming, no matter how small, is bad.
AB,
We can know that CO2 has nothing to do with the waxing or waning of sea ice, since Antarctic sea ice minimum summer extent grew from 1979-2014, while Arctic minimum fell from 1979-2012.
Drawing straight lines through a cyclical trend are we?
Starting the straight line above the data, ending it below the data?
Then extrapolating them past the end of the data – just like I said above.
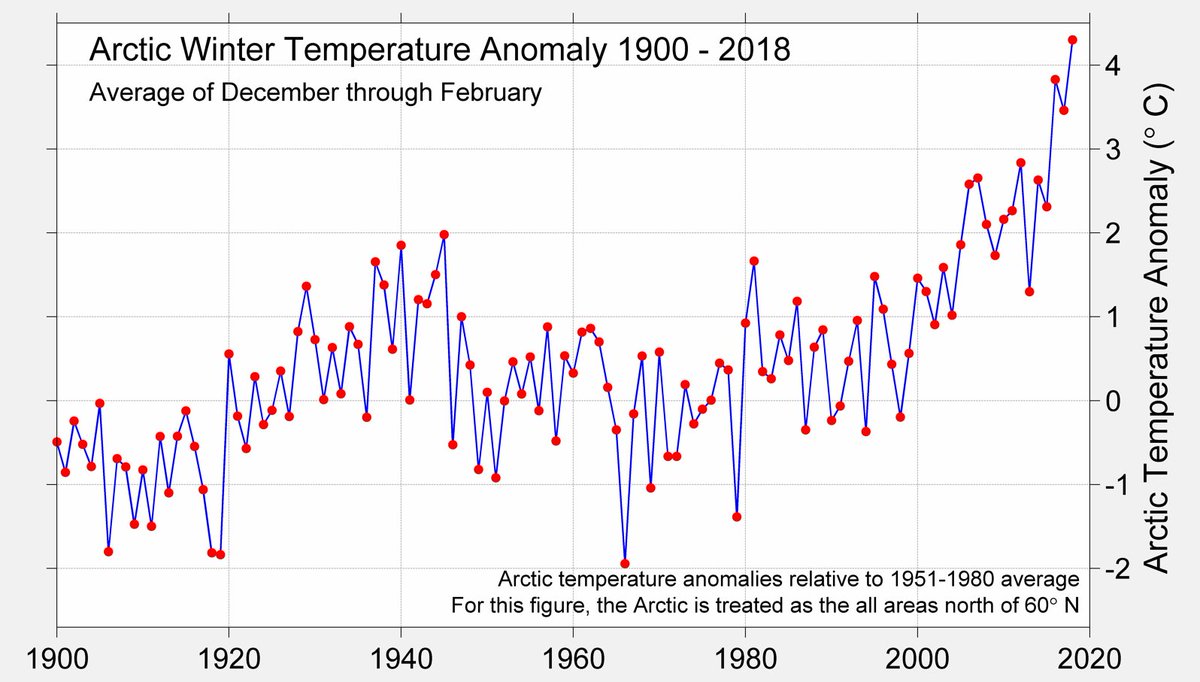
I think the first 2 graphs are explained by the warm phase of the AMO. I would like to see a chart of the unadjusted data in for chart 3
Chart 3 is also the Winter Anomaly which means that the temperature anomaly would reflect a temperature change from -32C to -28C no from Mind numbingly cold to snot freezing cold
No. -31 deg C is s’not freezing weather. Snot freezing weather begins at only -5 deg F. 8<)
So while the world always wants make it about low minimum extents, now you want to make it about low maximum extents because the minimum extent is inconveniently high, lol.
Pretty amazing how we get a minimum that is within 2 SD of average while starting from the 2nd lowest maximum on record, eh? Is global warming/climate change starting to hibernate during winter?
I personally like how you show Dec-Feb temperature data but March sea ice data and act as if the time periods equate. I also like how you present “average monthly extent” as “maximum extent.”
Maybe you should present data which says what you claim it says.
AB,
Winter maximum means nothing. Whether it’s 14.5 million or 15.5 million sq km doesn’t signify. In polar night, there is no sunlight to be reflected. Extent has no impact on albedo at all.
Even after the sun comes up in spring, it’s so low that there is still practically no reflection, and the albedo of ice scarcely differs from that of water.
Only male polar bears hunt during the winter. The sows are denned up with their cubs. When they emerge in the spring, they are some hungry bears. What they rely upon are ringed seal pups in their snow lairs atop landfast ice, which is there even when summer minimum is much lower than now, as during the Holocene Optimum and subsequent warm periods.
“Winter maximum means nothing.”
For one it means that there is less ice around to be melted during the summer.
Also it is where AGW is expected to have greatest effect …..
….
https://www.nature.com/articles/srep01556
“Observed current and simulated future trends of Arctic climate exhibit a strong decline in sea ice (cover and volume), as well as a very pronounced seasonally varying temperature response, with winter warming being at least four times as large as summer warming (independent of the magnitude of climate forcing). Near-surface winter atmospheric warming is conclusively linked to diminishing winter sea ice…… ”
“This weak summer warming can be attributed mainly to the absence of amplifying summer feedbacks. With amplified winter warming in the Arctic being one of the most outstanding features of ongoing and projected greenhouse warming …”
Ice has decreased from when it reached a maximum for the last century.
Regardless, your belief that only the month of March matters is so darn cute!
Ah yes. “Sea-ice” is a trigger word/phrase, along w/Trump, polar bears, baby seals, and the children.
A couple of weeks ago it was in the news that the oldest arctic ice was breaking up and that this was serious. Does anyone know anything about this?
That was some alarmists pointing to some fast sea ice breaking down at the northern tip of Greenland. It also happened in 2011.
 ?w=1000
Susan: Is this the article you are looking for?
https://polarbearscience.com/2018/08/22/sea-ice-silly-season-wadhams-spouts-fake-facts-about-polar-bears-of-northern-greenland/
It didn’t involve polar bears when I saw it but I think ‘multi-year ice’ was the subject. Is it breaking up abnormally?
I believe they picked one small region north of Greenland and focused on that because
in general, the melt this summer has not been that large so if they looked at Arctic ice extent for this summer there would have been no story.
It is not serious unless winds and currents flush the ice out into more southern waters, as has been seen before. The storm of interest is one that breaks up ice arches and un-blocks the passages.
About 2007 Artic ice loss
“in fact, it’s likely to come in within 2 standard deviations”
Something that should happen 95% of the time.
It seems to me that the 2012 trend like gave some valid reason for concern. And I don’t know if I’d say that this year’s ice trend is “perfectly normal” when it’s dancing on the 95th percentile line.
However, it is absolutely the case that trends have reversed, and the death spiral did not happen. Do the “consensus scientists” have any theories for an increasing sea ice extent in the face of gradually increasing CO2 concentrations? Do they say this is a “head fake” and the decreasing trend will return?
Or will they say that this is a natural fluctuation? (And why does that last argument sound familiar…)
I think Al Gore et al. were mistakenly reading WUWT’s Great Lakes Ice Page, not the Sea Ice Page.
Considering there isn’t suppose to be any ice, I wonder why it’s not melting? It will long be forgotten along with the Great American drought of a few years ago… as proof of global warming. AGW, like grasshoppers, jump from one climate anomaly to another. Then when nothing happens, they’ll find another.
I don’t know, but it seems that in desperation, AGW is/was pinning their hopes on a melting Arctic.
Maybe this desperation to find Arctic melting is due to the fact that for years they proclaimed the Arctic was the proverbial “canary in a coal mine”.
Maybe all that sea ice was hiding under all those new trees?
Maybe the sea ice is hiding in the deep oceans, along with all the missing heat?
That would fit modern warmist climate science – who says ice floats?