Right now, the sun is a cueball, as seen below in this image today from the Solar Dynamics Observatory (SDO) and has been without sunspots for 10 days. So far in 2018, 61% of days have been without sunspots.

Via Robert Zimmerman, Behind The Black
On Sunday NOAA posted its monthly update of the solar cycle, covering sunspot activity for March 2018. Below is my annotated version of that graph.

March 2018 was the least active month for sunspots since the middle of 2009, almost nine years ago. In fact, activity in the past few months has been so low it matches the low activity seen in late 2007 and early 2008, ten years ago when the last solar minimum began and indicated by the yellow line that I have added to the graph below. If the solar minimum has actually arrived now, this would make this cycle only ten years long, one of the shortest solar cycles on record. More important, it is a weak cycle. In the past, all short cycles were active cycles. This is the first time we have seen a short and weak cycle since scientists began tracking the solar cycle in the 1700s, following the last grand minimum in the 1600s when there were almost no sunspots.
The graph above has been modified to show the predictions of the solar science community. The green curves show the community’s two original predictions from April 2007, with half the scientists predicting a very strong maximum and half predicting a weak one. The red curve is their revised May 2009 prediction.

The graph [above], courtesy of the Sunspot Index and Long-term Solar Observations webpage (SILSO), will give you an idea how little activity occurred in March. There were only five days during the entire month where sunspots could be seen on the visible hemisphere of the Sun. We have not seen so little activity since 2009, when the Sun was in the middle of its sunspot minimum.
We could still see a recovery in sunspot cycle. Past cycles tended to ramp down slowly to solar minimum, not quickly as we have so far seen with this cycle. For example, look at sunspot activity during 2007 on the NOAA graph above. Though activity was dropping, throughout the year there were new bursts of activity, thus holding off the arrival of the minimum. It would not be surprising or unusual to see this happen now. […]
The big question remains: Are we about to head into a grand minimum, as happened during the Maunder Minimum in the 1600s? During that century there were practically no sunspots. Since it occurred immediately after the invention of the telescope, astronomers had no idea that the lack of sunspots were unusual and did not give it much attention. It wasn’t until the solar cycle resumed in the 1700s that they discovered its existence, and thus realized the extraordinary nature of the century-long minimum that had just ended. Unfortunately, it was over, and the chance to study it was gone.
Thus, if a new grand minimum is about to start, it will be a once-in-a-lifetime opportunity for today’s solar scientists. Not only will they will get to study the Sun as it behaves in a manner they have not seen before, they will be able to do it with today’s phalanx of space-based observatories. The chance to gain a better understanding of the Sun will be unprecedented.
Furthermore, the occurrence of a grand minimum now would help the climate field. We really do not know the full influence of the Sun’s solar cycles on the Earth’s climate. There is ample circumstantial evidence that it has a significant impact, such as the Little Ice Age that occurred during the last grand minimum, as well as the unusually cold climates that also matched past weak cycles, now, and also in the early 19th and 20th centuries. Studying a grand minimum with today’s sophisticated instruments could help measure precisely how much the Sun’s sunspot activity, or lack thereof, changes the climate here on Earth.
So now my prediction from 2013/14 comes full circle. My only toe hold in knowing anything that was related to climate, when I first started following this story in Aug 2008, was that there was a possible cyclical flood pattern on the West Coast of the US. In early 2014 at a time of inspiration, the picture became clear enough to me where I made the prediction that 2016/17 was the most likely year for the West Coast to be impacted by a very wet winter. Accompanying that prediction was the further prediction that the ssn numbers would be close to minimum, the solar minimum would follow within 2 years, and that the ENSO regions would be negative as all of that is required for this type of winter to take place. The next similar winter should take place in 2025/26. Although, I now see that I may have to slightly change my outlook on the spacing intervals between these cyclical flood winters. That is that there is an increased probability that 2026/27 will be the next flood winter, a ten year spacing as compared to the 9 year flood pattern of 1946/47, 1955/56, and 1964/65. I am still learning.
Also, that prediction ended by further stating that both before and after such a heavy cyclical winter there would be average to slightly above average winters. This has now taken place with this current winter as well as the two average to slightly above average winters of 2014/15 and 2015/16. Keep in mind that when I made this prediction in early 2014 that the alarmists were expecting the drought to continue. No one was talking about a return to typical rainfall patterns for the West Coast back then.
All of that was successful prediction based mainly by looking over your shoulders at the best of your science, and by paying close attention to the historical data. I may not be a scientist, but I have a keen and unusual method of analysis.
Lastly, I also correctly predicted around 2013 that the winter of 2017/18 would bring a cold downturn which would be easy for all to see, and that should become the point on the curve where the downturn would become self evident. That prediction is still in process, but I feel fairly confident now that this is exactly what we will se in the years ahead. The close at hand solar minimum means that the next 2 years will further cool, imo.
Ok lastly, lastly, my prediction for the next PNW flood winter to hit in 2025/26 also gives a clue as to when the next solar minimum will set in, and that also means that the ENSO regions will be negative at the same time. They are inextricably linked, imo.
Bastardi pointed out that 13 of the past 18 Jan-Apr periods have been cooler than the average. Can anybody pick a cherry that outsizes that?
Sounds like a job for our anti-skeptics here.
He is also expecting an El Niño in the fall, to be followed by another winter like this one. This is just weather prediction base on a combination of analog data and models. But he is right often enough to make a good living at it. Also, winter snow is not over for the Northern Tier States this month. This has agricultural significance. The discussion here has consequences dependent on the outcome.
So I guess April 11, 2019 we can have the results published on whether Isvalgaard is in fact an arrogant, know-it-all or we all owe him a debt of gratitude for educating us and steering us all in the right direction!
I don’t have a dog in the fight but I certainly have an interest on how this solar cycle plays out and how the next one develops.
I’ve put in on my calendar with a book mark to this article and will see if Anthony will put it up come next year.
“Solar Dynamics Observatory (SDO) and has been without sunspots for 10 days.”
What happened to the massive hole in the sun’s atmosphere reported on by Wattsupwiththat just 5 days ago? https://wattsupwiththat.com/2018/04/06/nasa-reports-massive-hole-in-suns-atmosphere/
The one that was suppose to be so big, that the Earth would be in the path of the enhanced solar wind coming out of it for 11 days.
It is still there from what this shows, …http://www.spaceweather.com/images2018/11apr18/coronalhole_sdo_blank.jpg?PHPSESSID=v7mdesm3458t5tgmtcoqq576q5
Here ya go. 193 Angstroms shows it clearset, though it’s rounding the western limb now.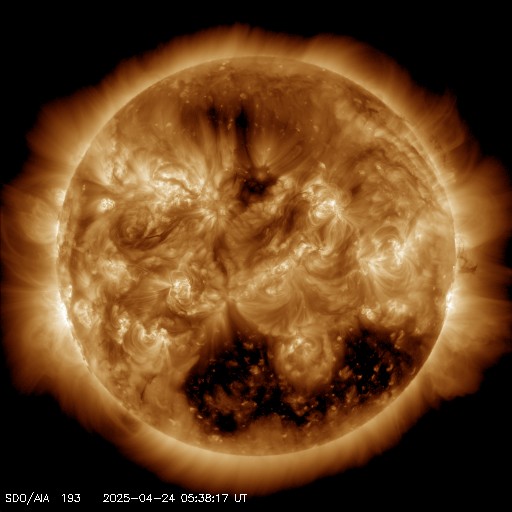
@ur momisugly Pop …I really need to learn how to post pics as it would add dimension to my descriptive comments, being that descriptive comments is the only means by which I can discuss any of this.
To post a picture, just put a link to the URL of wherever it is on the web, with the url on a separate line all by itself, and WordPress will show the image.
w.
Thanks Willis. I will try that.
https://wattsupwiththat.com/test/
Goldminor, also keep in mind that wordpress won’t recognize anything more than a 3 character file extension. before posting remove all extraneous characters after the .jpg (or what have ‘ya) and to be safe, try it on the test page. The best way I’ve found is to choose “copy file location” in the dialogue list and then check it for extra characters.
Great, thanks for that. Sometimes, for me, taking that first step is the hardest thing in the world to do. I was a late comer to computers around 2004. The only reason why I put one together was that my son told me that the best games were PC games. Sort of ironic isn’t it.
Goldy- now we play a game of global consequence.
My son was correct, the greatest games.
But the Sun “has been without sunspots for 10 days.”
So why doesn’t that massive rift count as a sun spot?
Just for you, Matt S.
A movie from Helioviewer.org.
@MattS – I don’t know why anybody will tell you, but coronal holes and sun spots are not the same phenomena. Google each. They are exactly opposite phenomena magnetically.
Javier I think we will be vindicated. We even do not agree on everything but we are on the same page for the most part.
This year and the next few will be telling.
Salvatore, with respect, I’m afraid no-one is on the same page with you. Many of us are on a different book, mind you.
This past quarter brought one of the cloudiest winter droughts I can remember here at 39° N latitude. Very high cloud cover that’s had a negative temperature affectation. Budding of trees is just beginning as nights were consistently cold this year and soil temperatures are still too low for planting.
Is this Svensmark’s theory observed, or water vapor left over from the last ENSO belch of heat. In any case it seems to act oppositely at the poles, where the clouds are insulation from massive planetary heat loss. When SSTs drop and ocean oscillations go negative, are we going to be facing an actual “climate crisis”?
F10.7 at 66 may be the lowest so far, but it’s still well above the floor of about 63 (I believe) so I am confident we are not at minimum yet.
2018 04 05 66 0 0 0 -999 A0.0 0 0 0 0 0 0 0
But perhaps it’s time we opened a sweepstake on when minimum will turn out to be?
Rich.
Rich, Tony Phillips at spaceweather.com defines the floor of SFU at 66 from my memory. When was it observed ta 63? Just curious.
Pop,
Apologies, I hate to be the perpetrator of fake news (I used to be better at remembering numbers accurately). The lowest I could find from the last minimum is 65, which is neither my 63 nor your 66, as follows:
ftp://ftp.swpc.noaa.gov/pub/indices/old_indices/2008_DSD.txt
2008 06 08 65 0 0 0 -999 A0.0 0 0 0 0 0 0 0
Rich.
lsvalgaard April 11, 2018 at 1:52 pm
Lief for the first time you are losing me, your ‘unambiguous’ does not equate to your
but that is, of course, a bit subjective. BTW, none of those spots were numbered by NOAA, including the latest one.
Pls Lief, there are enough exponents of the nonsense
your ‘unambiguous’ does not equate to your…
‘unambiguous’ means that nobody is contesting it, as was the case with the previous ones [personal communications]
Doc, Sam Freeland shows us at AR 2703 at present. Do you concur?
He did that on April 9th, which is not ‘at present’.
OK, Most Recent. I think you exhibit syntax OCD sometimes. Is 2703 the latest AR?
The latest numbered AR was 12703 back on April 9th, 2018. The number may still hang around at the limb for a couple of days after the AR has rotated out of view.
L-E-I-F
Thank you Jean.
We will be in Belgium in November. We can meet then.
The mini ice age is happening now, thanks to low solar activity. Piers says so:
.
He should have a talk with his brother
https://youtu.be/D9nOmVQcZVg
Since it is warmer now than it was twenty years ago, and warmer now than it was either thirty or forty years ago, and warmer now than it was fifty years ago, and warmer now than it was sixty years ago, and seventy years, and eighty years, and warmer than it was ninety years ago … what “mini ice age” is Piers babbling about now?
And who takes Piers Corbyn seriously?
He offered to bet anyone about rain at the Olympics opening, whining that the bookies wouldn’t bet with him. But when I agreed to bet, he backed out and wouldn’t bet me. Pathetic.
He said that there was a 50% chance of a typhoon during a certain period … and when none formed, he claimed credit.
He also forecast forest fires in one US state, and claimed success when there was a forest fire in another state.
See here and here for the gory details …
w.
I doubt that it is warmer now than 80 years ago. Phil Jones admitted as much about ten years ago, when the hot, hot, hot 1930s were only 70 years ago.
It is however much warmer now than it was 320 years ago, in the depths of the LIA during the Maunder Minimum. But it is cooler now than it was at the height of the Medieval Warm Period, even cooler than the peak Roman WP balminess and yet cooler than the toastiness of the Minoan WP.
I don’t expect a return to LIA conditions as soon as some prognosticators, and pray to all that is or might be holy that I’m right.
Chimp April 11, 2018 at 5:05 pm
So take “80 years” out of what I said … where is the mini-ice age? Solar activity has been decreasing for thirty years or so, temperatures have been increasing for thirty years or so, and solar activity is gonna cause an ice age?
Not seeing it …
Now, there is something we can agree wholeheartedly about.
w.
Willis,
Solar activity has decreased since the 1990s, and in the real world, GASTA has been flat, or declining, except for the recent, late, great super El Nino and its lead-up. Just as one would expect if the sun was the main driver of Holocene climate change.
As I said, I don’t think that the sun will decline enough for a new mini Ice Age. But even if it did, Earth is still working off all the heat that it accumulated during decades of unusually powerful solar cycles. The lag in the oceans is, as noted, a lot greater than for the air.
Chimp April 11, 2018 at 5:24 pm
Sorry, amigo, you get your own theories but not your own facts.
If the sun were the driver, temperatures would have been falling for decades. As I’ve pointed out over and over. And no, lagging the sunspot curve does NOT magically fix things, so spare me the excuses invovling lagging.
w.
High solar activity correlates with warming. Low solar activity correlates with cooling. Solar activity has been high in recent decades, hence warming…
High solar activity correlates with warming. Low solar activity correlates with cooling. Solar activity has been high in recent decades, hence warming
Not so. Solar activity was equally high in the 18th century when it much colder than today:
http://www.leif.org/research/Solar-Activity-No-Cooling.png
Willis Eschenbach April 11, 2018 at 4:36 pm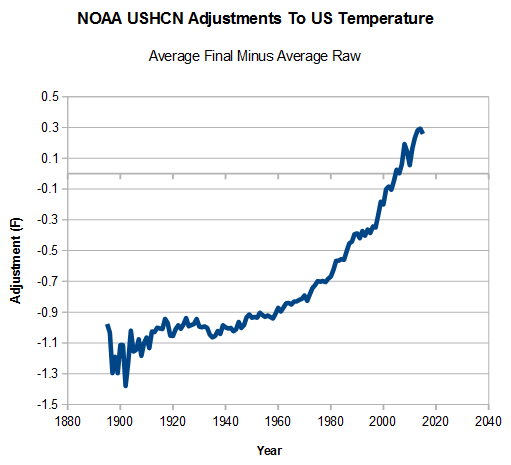
“Since it is warmer now than it was twenty years ago, and warmer now than it was either thirty or forty years ago, and warmer now than it was fifty years ago, and warmer now than it was sixty years ago, and seventy years, and eighty years, and warmer than it was ninety years ago… ”
Are you sure about all that?
https://realclimatescience.com/alterations-to-climate-data/
That’s obvious from the observations, the world is getting warmer as the interglacial progresses toward the next cyclical glaciation. I can’t help but agree that solar changes alone could never drive the continual stair-step process of interglacial warming. It might be something about the planet’s plethora of water?
20 years ago “global warming” already was already delivering milder winters, decreasing snowfalls (leading to increased sales of snow making equipment), hotter summers, and more frequent droughts and fires — as you might expect on a planet with an incessantly increasing heat budget to work with.
The independent UK, as you well know, famously warned that “Snowfalls are now just a thing of the past“, while ski resorts everywhere joined the “Keep Winter Cool” campaign in a desperate plea to keep their business models afloat.
But when solar activity declined, weather patterns changed dramatically, requiring a new kind of global propaganda to explain today’s weather…
A First! Snow Falls in Baghdad
By CHRISTOPHER CHESTER (AP)
Jan 11, 2008
==============
Arctic blast brings London earliest snow for 70 years
Mark Prigg (Evening Standard)
Oct 10, 2008
==============
Spokane, Washington., residents cope with record snow
By NICHOLAS K. GERANIOS (AP)
Jan 7, 2009
==============
The day the sea froze: Temperatures plunge to MINUS 12C and forecasters say it won’t warm up until Sunday
By Daily Mail Reporter
Jan 8, 2009
* * * * * * * *
Where’s global warming?
By Jeff Jacoby, Globe Columnist
March 8, 2009
[…] The United States has shivered through an unusually severe winter, with snow falling in such unlikely destinations as New Orleans, Las Vegas, Alabama, and Georgia. On Dec. 25, every Canadian province woke up to a white Christmas, something that hadn’t happened in 37 years. Earlier this year, Europe was gripped by such a killing cold wave that trains were shut down in the French Riviera and chimpanzees in the Rome Zoo had to be plied with hot tea. Last week, satellite data showed three of the Great Lakes – Erie, Superior, and Huron – almost completely frozen over. In Washington, D.C., what was supposed to be a massive rally against global warming was upstaged by the heaviest snowfall of the season, which paralyzed the capital.
* * * * * * * *
Children die in harsh Peru winter
By Dan Collyns (BBC News, Lima)
July 12, 2009
==============
Beijing’s Heaviest Snow in 54 Years Strands Thousand
Bloomberg News
Nov 12, 2009
==============
Heavy snow continues as temperatures set to plunge minus 20C
Herald, Scotland
Jan 6, 2010
==============
Quiet sun puts Europe on ice
New Scientist
May 4, 2010
==============
Freeze Challenges Power Supply
(Xinhua, China)
Jun 1, 2010
==============
‘Polar vortex’ brings big freeze to North America
Telegraph UK
Aug 13, 2014
==============
Scientists:Don’t make “extreme cold” centerpiece of global warming argument
WaPo
February 20, 2014
==============
A warming Arctic can actually make our winters colder
Poopular Mechanics, September 2017
==============
Why climate change may be to blame for dangerous cold blanketing eastern U.S.
NBC, January 2018
==============
Why a Warming Arctic May Be Causing Colder U.S. Winters
National Geographic, March 2018
And nowadays you can make ice in the oven by exploiting the post-normal heat–all thanks to the quiet sun.
I can say for sure that first frost come a good two week later than 40 years ago!
Basic mistake. The world has been warming since the end of the Little Ice Age. It is like saying that a pot with water 20 minutes under a constant fire should keep a constant temperature. Of course it is warmer today, and we have to add the effect of CO₂ since the 1950’s. You always conveniently forget about that when discussing about solar effect on climate. It shows you are more interested in scoring in debating skills than in a fair discussion on the possible effects of solar variability on climate.
If one looks at the solar activity chart over the last ten cycles or so we are just emerging from a major solar activity period. This pumped heat into the oceans, then the rampant sun went to sleep and we have a pause in temperature. The next is a fall in temperature, only weather changes fast, the climate takes a while.
Remove all the BS adjustments from the temp graphs and we are only .7K warmer than 1850.
Back in April 2012 Piers predicted that May 2012 would be the “coldest or near coldest for 100 years” in eastern parts of Britain. https://www.express.co.uk/news/uk/315293/Coldest-May-for-100-years-as-winter-roars-back
May 2012 turned out to be at or around the long term average temperature (1981-2010 base), both in eastern Britain and elsewhere in the UK. Certainly nowhere in the UK experienced anything near being ‘the coldest May in 100 years’.
When I challenged him on Paul Hudson’s blog Piers said that the ‘early’ part of May 2014 had been below average temperature, so in effect his prediction had been right! I replied that his prediction was specifically for ‘May’ and that as far as I knew May consisted of 31 days and always had (I paraphrase from memory). At that point Piers just threatened to sue me. Not worth the effort that guy.
At the moment it looks like there is a possibility we will not be around to enjoy the next solar cycle if nuclear powers start bombing each other with little suns.
Yes, that is a possibility thanks to the miserable SOBs who are attacking this president. They have been pushing every button in reach.
Let’s hope it’s just part of the twittering distraction he’s been using on the press while undoing the previous admin’s damage.
The problem as I see it is that Putin is making the most out of our current weakness by making provocative statements. While China is playing coy, and trying to act like the good guy by pulling on NK’s leash. I think that all of them work together on this. They are in the catbird’s seat as we move closer to uncivll war among ourselves. They smell blood in the water. That is what worries me.
The assimilation of public ed into the socialist ideology combined with nearly free higher ed for minorities and holders of educational visas has created a schism in the US. They are playing the game of numbers and attrition. when the unindoctrinated have attrited, there will be no division of doctrine.
Give the President more credit than that. It infuriates the MSM propagandists that he is still smiling and relaxed in the midst of mounting hysteria. He knows who his voters are and we know that he knows. Relax, spend more time at science blogs. MSM does not set his agenda and you should not let them set yours. JUST VOTE FOR YOUR REPUBLICAN CANDIDATE come November. The same push pollers who were at work during the Presidential election are at work now. Don’t believe them, half are made up or use weighted data.
To the discussion flying by here, Bastardi has pointed out repeatedly that UAH data shows too much warming in the NH due to a not as cold Arctic. It is freezing cold on the land masses where most humans reside, with record snow in the Sahara during April. Next winter will be a bell weather on where the temperatures are going for the human race. Meanwhile, crops will be planted late all over the NH including in the U.S. If this continues for a few more years it could be disastrous.
I have spent most of my time at science blogs for the last 10 years. As for politics, I had never followed the story line prior to the last election. The reason for that was my interest in the AGW debate.
I am hoping that any potential adverse weather/crop issues in the years ahead mainly hit NK, China, and Russia. It should as they are all nicely situated around the edges of the Siberian Winter Cold region, to give it a name.
The cycle is not over until the heliospheric current sheet flattens and that looks like it has another two years to go. Solar Cycle 24 has been a normal sort of cycle for the 19th century, before the time of the Modern Warm Period. Solar Cycle 25 will be much the same. Solar activity in 24 has been backloaded. What to watch for, with respect to climate, is the strength of the magnetic flux at minimum.
F10.7 will be the best metric to watch. Moving 90 day average uptick will signal SC25
Reality is beginning to dawn that seemingly small fluctuations in TSI and bigger variation in UV can affect Earth’s climate:
https://science.nasa.gov/science-news/science-at-nasa/2013/08jan_sunclimate/
One of the participants, Greg Kopp of the Laboratory for Atmospheric and Space Physics at the University of Colorado, pointed out that while the variations in luminosity over the 11-year solar cycle amount to only a tenth of a percent of the sun’s total output, such a small fraction is still important. “Even typical short term variations of 0.1% in incident irradiance exceed all other energy sources (such as natural radioactivity in Earth’s core) combined,” he says.
So something tiny (a change in TSI of one part in one thousand) is bigger than something even tinier (geothermal heat)?
So what?
w.
PS—I did enjoy his “all other energy sources (such as natural radioactivity in Earth’s core) combined” … other than the sun and radioactivity, just what is he talking about? Human burning of fossil fuels? That’s 0.01 W/m2 …
So does Willis agree or disagree that the maunder minimum (sunspot absence) had no effect on the global temperature?
““Even typical short term variations of 0.1% in incident irradiance exceed all other energy sources (such as natural radioactivity in Earth’s core) combined,”
But that does not mean [and he didn’t say so] that those variation are ‘important’.
Doc, over the spectrum of solar output, could the tiny variations in magnitude at some wavelengths be more geoeffective than others? (hoping that’s a fieldable question for you)
‘geoeffective’ is too broad a word. Some effects are in geospace thousands of mile away, others in the ionosphere hundred of miles away, others in the stratosphere tend of miles away, but are concern with very tenuous gases. What is of interest is the dense, neutral atmosphere we breathe, and there the situation is more murky as the energy needed is large and its variation is tiny.
So, with Svensmark as unverifiable as Revelle or Strong in observation, where does that leave an old thinker like myself? Observation seems to disfavor both as omnipotent to me.
Sorry, english violation,
Observation seems to favor neither as omnipotent to me.
Many here are far better at math and graphing than I am any more. I don’t claim to be an expert in any of this. Yet I have been observing it all, sometimes close up, since at least the late 1970s when it was beginning to be a topic of discussion at various institutions I regularly visited. Of course AGW didn’t hit the big time until the USSR rebranded itself and it looked as if the money funding most of the climatologists and oceanographers was going to dry up. I have been convinced that the two overwhelming driving forces for the Earth’s climate are the sun and the oceans not any or even all anthropogenic greenhouse gases. The system is probably the most complex system we have ever attempted to understand. I believe until we understand water vapor dynamics, which are driven by the sun and ocean state at any given moment, we will not even begin to understand our climate. I am also know for certain that “models” as once defined in the cartoon Shoe, are very small imitations of the real world. I watched too many times dealing with federal government and university scientists some model declared as the answer to all our problems in understanding, predicting, etc for some much less complex system and they failed miserably. Growing up in and around the aerospace industry I learned early days that even the best engineering models run on the best state of the art computers often fail, especially the farther out they try to predict.
The Cold War supercomputers hijacked by “climate scientists” in Colorado and elsewhere were originally designed to model thermonuclear explosions, and their programmers got pretty good at that. Climate is a lot less well understood than H-bombs.
IMO, the sun is important at all time scales of climate observation. And at all time scales, the oceans modulate solar inputs, with the possible exception of true Snowball Earth episodes, if indeed there ever has been an interval with sea ice from equator to poles.
At millennial time scales, Milankovitch cycles are important, and possibly at even shorter intervals. At the scale of millions of years, plate tectonics and orogenies become significant. Volcanism matters at centennial to multi-million year time frames.
The inherent heat of the Earth of course is declining over time, so becomes progressively less important. It was a major force during the Hadean Eon, but less so in our Phanerozoic Eon.
But the one constant is the sun, a more variable star in total output and spectral flux than many are happy to accept. And at all time scales, the fact that we live on a water world is important. So too the fact that Earth harbors life.
Failed to delete “that” in first sentence. My bad.
[Fixed. I hate it that WordPress doesn’t have a “preview” function, so I do my best to rectify that error. -w.]
Chimp, the inherent heat of the Earth doesn’t cool/ decline in a constant fashion but in fits and starts from certain volcanism to deep sea thermal vents opening and closing, etc. I had an email debate with some scientists at one of the Oregon universities over whether thermal vents played any role in heating the oceans or even parts of the ocean. That was about ten years ago. Even though they claimed to be the “experts” in deep water thermal vents they claimed then there couldn’t be enough thermal vents to matter. They claimed basically that deep ocean thermal vents were very rare and unique events. They stopped responding when I pointed out the largest geological feature on the planet was the mid-ocean ridge(s), also the least explored. I also forwarded them a reference to five very large thermal vents being studied off the SW Coast of South America where the estimated flow was larger than the Amazon River.
Edwin
Your theories fit my results
Some of the warming T mean is coming from far below.
Come down 1km into a goldmine here and discover how big that elephant is.
The argument that is warm of late does not hold up when it comes to solar climate relationships because of the lag times that are needed and the low average solar parameters that are needed.
This year is the year that these are finally starting to come into play and therefore expect cooling.
I never expected cooling to occur, NO wait I did expect cooling to occur earlier because back in year 2010 I thought solar parameters were going to be very low and stay that way. That did not happen.
It is finally happening now.
In the graphs at the end of Chapter 6 of the first IPCC report (page 190) there’s a large gap between temperature and equilibrium temperature. (See the middle graph.) I don’t seem to be able to paste in the figure, but here’s the link to the chapter.
https://www.ipcc.ch/ipccreports/far/wg_I/ipcc_far_wg_I_chapter_06.pdf
Assuming some kind of exponential decay like pattern, it looks like the “impulse response” of global temp is too slow to track the ups and downs of any forcing with a period on the order of a decade. (I’d guess the time constant to be almost 20 years. The “noise” of other factors – like El Ninos – is too large.)
Secondly, the sunspot count isn’t really the direct measure of what “might” affect climate; stratospheric radiation is. The good folks over at spaceweather.com have been measuring that.
http://www.spaceweather.com/images2017/12may17/radplot.png?PHPSESSID=85t4njmi2s20usa19ff1mlkgt3
If that continues to go up, we should have a good test, but not for a while yet. Wild guess: even if Svensmark is right, we’re almost a decade from seeing this effect emerge above the noise. That’s a tough reach; cosmic radiation should peak and start back down in a few years when cycle 25 ramps up.
Yes, due to the relative brevity of the satellite record, we have a limited understanding of the role that the oceans play in storing and releasing the sun’s input over centuries, much less the millenia between NH glaciations.
The water on this planet is a primary factor in its present physical paradigm, surely much more than a tiny increase in trace gas concentration.
That hadcrut T graph Willis presents says it all. Just not what he thinks….. Brett
Brett Keane April 11, 2018 at 9:25 pm
Have I mentioned, Brett, how much I despise that kind of crappy drive-by posting? So far, you’re all hat and no cattle.
How about you screw your courage to the sticking point and actually tell us
a) what you think I think the HadCRUT graph means,
b) what you think it means, and
c) what difference that might make?
Regards,
w.
Sorry for the repeat:
So does Willis agree or disagree that the maunder minimum (sunspot absence) had no effect on the global temperature?
Philip, sorry for missing your question the first time you asked, and thanks for asking again.
The problem with the Maunder is that we have very little information on either the sunspots during the Minimum or the global temperatures during the Minimum. Here is one of the few temperature records that go back as far as at least part of the Maunder Minimum, the CET, the Central England Temperature, along with the minima:
The problem is that in both the Maunder and the Dalton minima, the temperature started rising several decades BEFORE the sun kicked back into high gear. That is absolutely not what we’d expect. IF the sun caused the temperature decline, then temperatures should not start rising until AFTER the sun started to gain power.
In addition, the CET temperature stayed even for half the Dalton minimum, dipped slightly, and ended up warmer than at the start of the Dalton Minimum … again, not at all what we’d expect.
As a result, my answer is … we don’t have sufficient observations to know if the sunspot absence affected the temperature or not, but the CET does not support the idea.
w.
@ur momisugly Willis …here is something of interest which just came up, …http://www.weatherzone.com.au/news/historical-weather-records-collected-by-nsw-farmer-to-be-used-in-new-climate-modelling/527784
A system that hasn’t reached thermal equilibrium does not have a meaningful temperature.
A meaningful temperature doesn’t exist on most parts of the planet’s surface.
If you can establish a temperature, it still doesn’t tell you much about heat.
If you use the politically adjusted “global average temperature” set as a metric, it tells you nothing at all of value.
But we do have enough meaningful weather records for the Little Ice Age to say, with reasonable confidence, that it was somewhat colder than the present:
http://www2.sunysuffolk.edu/mandias/lia/little_ice_age.html
e.g., ” On many occasions bishops and priests were called to bless the fields and to pray that the ice stopped grinding forward (Bryson, 1977.)”
I have a post on temperatures that disappeared into purgatory, btw. Should I try again?
goldminor April 11, 2018 at 11:10 pm
Thanks, GM. Unfortunately, there’s no link to the data, but kudos to the aussies for digitizing all those handwritten records.
w.
It shows that the problem is with your expectations on how the Sun should affect climate. Obviously the effect of the Sun on the climate is not linear, immediate, and proportional to changes in TSI, because if that was the case the solar effect would have been identified decades ago, if not centuries. Your pursuit is pointless unless you abandon your assumptions on how the Sun should affect climate.
Scores of researchers are showing that the solar effect is non-linear, lagged, and mediated by a plethora of solar phenomena like spectral, magnetic and solar wind changes. Karin Labitzke opened the problem when she showed that data on polar stratospheric temperatures had to be segregated by QBO phase to show a strong correlation with solar activity. And if you think that polar stratospheric temperatures don’t have an effect on Northern Hemisphere weather you haven’t been paying attention to the polar vortex effect.
This problem is too complex for you and your statistical skills. Your rejection comes from not being able to scratch it, but that was the case for every researcher before Labitzke. Don’t worry. People smarter than you, with better scientific education, and better means and tools will continue advancing in the solution on how solar variability affects climate and they’ll let us know how it works. You can already learn how they are doing if you read their articles.
So
It is like I said.
The elephant that nobody speaks about?
On 9 and 10 April (UT dates) there were two small sunspots near the Sun’s central meridian, far south of the equator. But strangly enough, this group did not receive a NOAA number. Clearly it belongs to the new cycle 25.
See http://www.stce.be/news/422/welcome.html
lsvalgaard April 11, 2018 at 5:57 pm “there is ZERO chance. Indeed, the data are hard to contradict.”
Leif,
Sometimes I use the term ‘hard science’ to amplify that there are indeed examples of data that are hard to contradict. So I can understand your frustration at being questioned with soft science examples.
There should be more hard science in climate work, which is terribly soft. Example, I am still waiting for an answer from our Bureau of Meteorology to the question I asked 3 weeks ago about what total error terms they would apply to LIG temperature observations in the 20th Century. It is astounding that they cannot relate answers for what should be second nature to every scientist working there and using the tools of their trade.
Geoff
Here’s the correlation between the monthly CET values and the monthly sunspots since 1950.

 ,
,
As you can see, there is no correlation, with r^2 = 0.1%.
Here’s the correlation between the monthly CET values and the lagged monthly solar insolation since 1950.
As we would expect, there is a high degree of correlation, at r^2 = 90%.
We can safely exclude any sunspot effect.
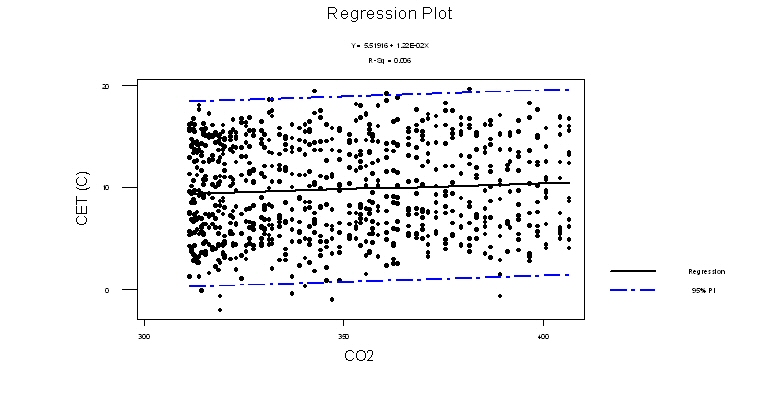
The monthly model offered here https://mynaturaldiary.wordpress.com/2018/03/03/whither-the-weather-2/
suggests that the CET depends mostly on last months solar insolation (seasonal sunlight!),
then teleconnections such as the arctic and north atlantic oscillation and its positioning of the jetstream
and finally a CO2 effect,
of 0.006 C per extra ppm of CO2 in the atmosphere. It’s small but there. But no sunspot effect.
the temperature effects due to increased forcing (before feedbacks) is the log of additional CO2. Using linear scales of CO2 over 100ppm delta versus temp and doing a linear regression is so wrong.
In which case it’s an even smaller amount than 0,.006C per ppm of CO2.
CET is very highly correlated with a 30 day lag in solar insolation.
So is almost the whole land surface. (oceans and water bodies have a slightly different lag amount).
But the month to month variation in solar insolation is very high. The lag is a proxy for how much energy builds up or draws down in the land surface from day to day.
Do the calculations to see how much the Sun needs to vary from year to year (or over how many years) to cause a similar effect.
Think of the Maunder Minimum having 2.0 W/m2 less solar insolation than today and this lasted for 100 years.
Think of the Maunder Minimum having 2.0 W/m2 less solar insolation than today and this lasted for 100 years
both claims are false. Get you facts straight before shooting your mouth off.
Five sources not including a Svalgaard. One could post about 10 other reconstructions like this.
http://jo.nova.s3.amazonaws.com/graph/astronomy/solar/sunspots/usoskin-2015-fig-17-total-solar-irradiance-maunder-.jpg
http://www.climate4you.com/images/SolarIrradianceReconstructedSince1610.gif
Bill Illis April 13, 2018 at 1:50 pm
You seem to be under the impression that science is settled by voting …
w.
Let me be clear. I DO NOT THINK THE HEAT IN THE OCEANS IS FROM CO2. That being said, the oceans are cyclically warm, The REDUCTION of incoming solar has been associated with the weakening of the easterlies in the tropics. Such an event would lead to el Ninos. El ninos spike WV and once that works into the entire pattern, the increased WV affects where its coldest and driest the most, We seem to discard the fact there was a monster 200-year minimum, a spike in activity which may have resulted in increased la ninas to set up the core of the LIA. If you watch the swings in the ENSO activity, certain relationships result in certain pattern feedbacks, For instance, next winter, I am already looking for a Modoki type el Nino ( basically 3.4 warmer than 1.2) and another big winter for the US However the fall off the super nino in global temperatures, which to me has been disappointing may end, Keep in mind that in the last super nino we fell much more than we did off this one, One may argue there is still more fall to come. I don’t disagree with that, but I do think that at the least a modoki event like 2006-2007 is brewing. So here is my point, THE REDUCTION OF INCOMING SOLAR may cause a response ( natural) that leads to cold enso’s being weaker ( the last la nina was nothing to write home about, look at the one that followed the 97-98 el nino, or even 09-10) and el ninos that release the “missing heat” that is the bad news the next few decades. The good news is these are largely natural responses with no provable link to co2. The bad news though is the other side will spin every event as being because of co2. If you wish to play the solar card, please remember that the LIA was had a 200-year min, a spike, then the minimum that followed. We are going into a period that has followed a 200-year MAX I think the heat in the oceans may be a product of that ( I dont believe its a product of co2 increase) but you have to get rid of that first. Again if you argue the solar card, just where is the 200 years of strong sunspot activity heat stored? The response may be to weaken easterlies, more warm enso’s. The cold March and April ( those of you that have weatherbell saw me chomping at the bit during the false spring of Feb using analogs from the late AMO period back in the 50s and 60s ) is typical of the late game stages of the warm AMO. In fact with 9 of the last 12 Jan-Mar periods being below normal and this year running amazingly close to 1962, it really is like what was built before is coming now. Cold Jan-April and especially March into April were common in the late warm amo period, more so than now but the last 12 years have certainly flipped from what was happening. And certainly low solar and easterly qbo with its enhancement of MJO responses is huge, this year, we pointed that out in October to look for a big MJO winter and we saw major rotations into 7 ( a warm phase) be followed by big responses to cold once that came off. But I would l caution that we may simply be going back to a warmer version of the 60s and 70s, cooler than now, certainly natural in source, but LIA could be a stretch.
Its fascinating, I see everyones point, but wanted to throw in my 2 cents even if one can argue it makes no sense. Peace out and keep on searching
What would be the effect of a nuclear winter on your climate predictions ?
Did anyone teach JB about the value of paragraphs?
Joe Bastardi April 12, 2018 at 3:27 am
Joe, I’m afraid that is not clear at all. Do you mean that a) CO2 has no effect on the downwelling radiation, or b) downwelling radiation from CO2 is not absorbed by the ocean, or c) something else entirely?
Thanks,
w.
From the halls of history, this
https://www.swpc.noaa.gov/sites/default/files/images/u2/Solar%20Cycle%20Progression%20and%20Prediction.pdf
their consensus of Cycle 24. Mostly they split about evenly between big and small number of spots (small 90, big 140). The small folks were closer and the panel was supposed to meet every three months. At this juncture, is this panel still in existance? Did any members modify their predictive formulas as they progressed through Cycle 24? Have they or are they working on a prediction for Cycle 25.
Oh, and one has to love the “The next cycle will be neither extreme, nor average”.
I recall another chart listing the panel and the methods used for each of their predictions but cannot remember where that was. I feel that was important because the methods used can be tested again for SC25 and beyond to see which methods continue to hold true. As those predictive methods narrow themselves down we may eventually find the one or two that work the best. The only problem is the time periods of the cycles could be longer than some, including myself, will live.
At this juncture, is this panel still in existance?
no, it is reconstituted for every cycle. Not yet formed for SC25.
Did any members modify their predictive formulas as they progressed through Cycle 24?
Some did, some [including me] did not.
Have they or are they working on a prediction for Cycle 25.
Yes, http://www.leif.org/research/Prediction-of-SC25.pdf
A gradual decrease in the amplitude indicates the cycle. It is not known when this cycle will end.
http://www.solen.info/solar/polarfields/polarfields.png
http://www.iup.uni-bremen.de/gome/solar/mgii_composite_2.png
Global SSTs have fallen a third of a degree in less than 3 years from the 2016 Nino peak. The biggest fall in 40 years. It’s starting to look like more than just post el Nino correction.
http://www.climate4you.com
(Click on “Oceans”)
Read Joe Bastardi’s post above. He is expecting another El Niño this winter. He also said the slow fall off in temperatures since the last one was disappointing as compared to the Super El Niño before the last one. Don’t get excited yet.
Cue the global cooling theorists.
Well, who shoots first?