Foreword by Paul Dreissen
Over and over, we are confronted with claims that last month or last year was “the warmest on record.” Each claim is accompanied by dire warnings that the alleged new records portend “unprecedented” chaos for wildlife, humans and planet.
Virtually never do these scary press releases mention that the supposed change is mere hundredths of a degree higher than previous measurements. Never do they admit that the margin of error in these measurements is far greater than the supposed increase. Never do they suggest that a little more warmth would be infinitely better than a colder world, with less arable land and shorter growing seasons. And most certainly, never do they admit to the massive deficiencies in the system that supposedly tracks Earth’s temperature … and always blames any increases on humans and fossil fuels.
This article by Dr. Tim Ball and Tom Harris points out all these highly relevant but often (deliberately) ignored realities.
Overheated claims on temperature records
It’s time for sober second thoughts on climate alarms
Dr. Tim Ball and Tom Harris
Now that the excitement has died down over the news that Earth’s surface temperature made 2017 one of the hottest years on record, it is time for sober second thoughts.
Did the January 18 announcement by the National Oceanic and Atmospheric Administration (NOAA) that 2017 was our planet’s third-hottest year since 1880, and NASA’s claim that it was the second hottest year, actually mean anything?
Although the Los Angeles Times called 2017 “a top-three scorcher for planet Earth,” neither the NOAA nor the NASA records are significant. One would naturally expect the warmest years to come during the most recent years of a warming trend. And thank goodness we have been in a gradual warming trend since the depths of the Little Ice Age in the late 1600s! Back then, the River Thames was covered by a meter of ice, as Jan Grifier’s 1683 painting “The Great Frost’ illustrates.

Regardless, recent changes have been too small for even most thermometers to notice. More important, they are often less than the government’s estimates of uncertainty in the measurements. In fact, we lack the data to properly and scientifically compare today’s temperatures with the past.
This is because, until the 1960s, surface temperature data was collected using mercury thermometers located at weather stations situated mostly in the United States, Japan, the United Kingdom and eastern Australia. Most of the rest of the planet had very few temperature sensing stations. And none of the Earth’s oceans, which constitute 70 percent of the planet’s surface area, had more than an occasional station separated from its neighbors by thousands of kilometers or miles.
The data collected at the weather stations in this sparse grid had, at best, an accuracy of +/-0.5 degrees Celsius (0.9 degrees Fahrenheit). In most cases, the real-world accuracy was no better than +/-1 deg C (1.8 deg F). Averaging such poor data in an attempt to determine global conditions cannot yield anything meaningful. Displaying average global temperature to tenths or even hundreds of a degree, as is done in the NOAA and NASA graphs, clearly defies common sense.
Modern weather station surface temperature data is now collected using precision thermocouples. But, starting in the 1970s, less and less ground surface temperature data was used for plots such as those by NOAA and NASA. This was done initially because governments believed satellite monitoring could take over from most of the ground surface data collection.
However, the satellites did not show the warming forecast by computer models, which had become so crucial to climate studies and energy policy-making. So bureaucrats closed most of the colder rural surface temperature sensing stations – the ones furthest from much warmer urban areas – thereby yielding the warming desired for political purposes.
Today, virtually no data exist for approximately 85 percent of the earth’s surface.

Note the grey areas in this map from NASA GISS. Other areas are smoothed to a 250km radius.

Indeed, fewer weather stations are in operation now than in 1960.

That means surface temperature computations by NOAA and NASA after about 1980 are meaningless. Combining this with the problems with earlier data renders an unavoidable conclusion: It is not possible to know how Earth’s so-called average surface temperature has varied over the past century and a half.
The data is therefore useless for input to the computer models that form the basis of policy recommendations produced by the United Nations Intergovernmental Panel on Climate Change (IPCC) and used to justify eliminating fossil fuels, and replacing them with renewable energy.
But the lack of adequate surface data is only the start of the problem. The computer models on which the climate scare is based are mathematical constructions that require the input of data above the surface, as well as on it. The models divide the atmosphere into cubes piled on top of each other, ideally with wind, humidity, cloud cover and temperature conditions known for different altitudes. But we currently have even less data above the surface than on it, and there is essentially no historical data at altitude.
Many people think the planet is adequately covered by satellite observations, data that represents global 24/7 coverage and is far more accurate than anything determined at weather stations. But the satellites are unable to collect data from the north and south poles, regions that the IPCC, NOAA and NASA tout as critical to understanding global warming. Besides, space-based temperature data collection did not start until 1979, and 30 years of weather data are required to generate a single data point on a climate graph.
So the satellite record is far too short to allow us to come to useful conclusions about climate change.
In fact, there is insufficient data of any kind – temperature, land and sea ice, glaciers, sea level, extreme weather, ocean pH, and so on – to be able to determine how today’s climate differs from the past. Lacking such fundamental data, climate forecasts cited by climate activists therefore have no connectionwith the real world.
British Professor Hubert Lamb is often identified as the founder of modern climatology. In his comprehensive 1972 treatise, Climate: Past, Present and Future, he clearly showed that it is not possible to understand climate change without having vast amounts of accurate weather data over long time frames. Lamb also noted that funding for improving the weather database was dwarfed by money being spent on computer models and theorizing. He warned that this would result in wild and unsubstantiated theories and assertions, while predictions failed to improve. That is precisely what happened.
Each and every prediction made by the computer models cited by the IPCC have turned out to be incorrect. Indeed, the first predictions they made for the IPCC’s 1990 Assessment Report were so wrong that the panel started to call them “projections” and offered low, medium and high “confidence” ranges for future guesstimates, which journalists, politicians and others nevertheless treated as reliable predictions for future weather and climate.
IPCC members seemed to conclude that, if they provided a broad enough range of forecasts, one was bound to be correct. Yet, even that was too optimistic. All three ranges predicted by the IPCC have turned out to be wrong.
US Environmental Protection Agency (EPA) Administrator Scott Pruitt is right to speak about the need for a full blown public debate among scientists about the causes and consequences of climate change. In his February 6 television interview on KSNV, an NBC affiliate in Las Vegas, Mr. Pruitt explained:
“There are very important questions around the climate issue that folks really don’t get to. And that’s one of the reasons why I’ve talked about having an honest, open, transparent debate about what do we know, and what don’t we know, so the American people can be informed and they can make decisions on their own with respect to these issues.”
On January 30, Pruitt told the Senate Environment and Public Works Committee that a “red team-blue team exercise” (an EPA-sponsored debate between climate scientists holding differing views) is under consideration. It is crucially important that such a debate take place.
The public needs to understand that even the most basic assumptions underlying climate concerns are either in doubt or simply wrong. The campaign to force America, Canada, Europe and the rest of the world to switch from abundant and affordable coal and other fossil fuels – to expensive, unreliable, land intensive alternatives – supposedly to control Earth’s always fluctuating climate, will then finally be exposed for what it really is: the greatest, most damaging hoax in history.
Dr. Tim Ball is an environmental consultant and former climatology professor at the University of Winnipeg in Manitoba. Tom Harris is executive director of the Ottawa, Canada-based International Climate Science Coalition.
Discover more from Watts Up With That?
Subscribe to get the latest posts sent to your email.
In this day and age it has never been cheaper to put in remote surface temp measurement devices.
Yet, no one seems to want to do so.
I think they don’t want real data.
Uncertainty ranges: Dr. Ball and Tom Harris have this bit exactly right “The data collected at the weather stations in this sparse grid had, at best, an accuracy of +/-0.5 degrees Celsius (0.9 degrees Fahrenheit). In most cases, the real-world accuracy was no better than +/-1 deg C (1.8 deg F).”
This was and is true still today — as I have written here many times. It is easily forgotten, intentionally ignored, and simply left off almost every temperature ever produced.
Kip,
HadCRUT4 publishes the lower and upper bounds of the 95% confidence interval of bias uncertainty in their monthly data: https://www.metoffice.gov.uk/hadobs/hadcrut4/data/current/download.html
Unless I’m reading it wrongly, the error margins, whether upper or lower, rarely exceed 60% of the best estimate value across the whole series and rarely over 40% of it in the past 30 years.
DWR54 ==> Translate you comment a bit for me — I have looked at the ascii file, but not the documentation.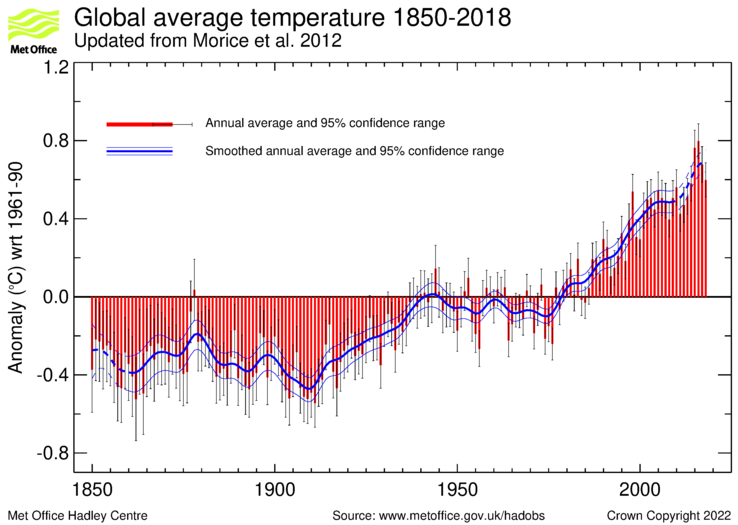
Are these “uncertainty in degrees C”? Simple statistically derived Standard deviations? In the time series, they call it 95% CI:
HADCRUT4 Time Series
To me, that is not the same — not even close — to a realistic approximation of the real physical uncertainty.
Kip,
The HadCRUT4 data are in the above link. They are tabulated in columns as follows:
Column 1 is the date.
Column 2 is the median of the 100 ensemble member time series.
Columns 3 and 4 are the lower and upper bounds of the 95% confidence interval of bias uncertainty computed from the 100 member ensemble.
Columns 5 and 6 are the lower and upper bounds of the 95% confidence interval of measurement and sampling uncertainties around the ensemble median. These are the combination of fully uncorrelated measurement and sampling uncertainties and partially correlated uncertainties described by the HadCRUT4 error covariance matrices.
Columns 7 and 8 are the lower and upper bounds of the 95% confidence interval of coverage uncertainties around the ensemble median.
Columns 9 and 10 are the lower and upper bounds of the 95% confidence interval of the combination of measurement and sampling and bias uncertainties.
Columns 11 and 12 are the lower and upper bounds of the 95% confidence interval of the combined effects of all the uncertainties described in the HadCRUT4 error model (measurement and sampling, bias and coverage uncertainties).
Have a look and see if I’ve misread it, but it seems to me that the monthly uncertainty bias is usually considerably less than 50% of the best estimate in either direction.
Surely, in the interest of openness and to provide some background about Tim Ball, the recent comments about his veracity and reliability from a Canadian judge should be displayed:
“… despite Dr. Ball’s history as an academic and a scientist, the Article is rife with errors and inaccuracies, which suggests a lack of attention to detail on Dr. Ball’s part, if not an indifference to the truth.”
“The Article is poorly written and does not advance credible arguments in favour of Dr. Ball’s theory about the corruption of climate science. Simply put, a reasonably thoughtful and informed person who reads the Article is unlikely to place any stock in Dr. Ball’s views… ”
https://www.desmogblog.com/sites/beta.desmogblog.com/files/Judge%20Skolrood%2C%20re%20Weaver%20v.%20Ball%2C%2002-13.pdf
Unless one has been reading Dr. Ball for a few years. desmogblog as a reference, really?!?!??
Ronald Skolrood is very leftwing with no science training. He knew that he had to dismiss the case but the excuse is a disgrace. It could easily be appealed but will not be because as the case states, Weaver didn’t cross examine witness statements from three distinguished suitable qualified scientists that Ball made a good argument. How can a judge with no scientific training contradict those more highly trained than himself?
“Regardless, recent changes have been too small for even most thermometers to notice. ”
While most post Hockey Stick reconstruction of proxies show a MWP, they are usually 0.2 degree cooler than modern times. That is about the temperature difference between the top and bottom of a 20 m tree on a dry day and a 40 m one on a wet.
Comparing the energy content of your backyard to the entire atmosphere and ocean down to 700m? Flimsy analogy Robert B.
I’m referring to the growing conditions of the proxy.
The entire reason for the authors to object the science of anthropogenic global warming is because those they have sold their souls to industry, can’t face the threat of GOVERNMENT REGULATION being one of the tools by which we address the issue. Regulations are costly, and the business community would bear the burden of the costs, something they profoundly refuse to accept.
Concerning the comment that warming is a positive outcome, while cooling would be terrible; this is unsubstantiated by any data. Cooling would not flood coastal lowlands while warming does. Cooling doesn’t increase the severity of tropical storms while warming does. Cooling doesn’t magnify the intensity of mid latitude thunderstorms, while warming does. Cooling doesn’t increase soil evaporation rates, while warming does. Cooling doesn’t reduce vital snowpack in the southern Rockies and Sierras, while warming does. Cooling doesn’t increase desertification and subsequent crop loses, while warming does.
The authors are simply tools of the vested interests, nothing more.
James, employs the old slime the industry babble, it is old and boring.
Since you offered ZERO counterpoint to the article, you really have nothing to contribute to the debate, which in itself indicative that you are ignorant and careless about the topic since your “cooling” babble is silly and unsupported, just drivel based opinion.
Congratulations!