Last week I hinted at this upcoming paper, which was embargoed until this morning. I noted then something Dr. Roy Spencer said in his book about clouds: The Great Global Warming Blunder: How Mother Nature Fooled the World’s Top Climate Scientists and how this new paper could be the “holy grail” of climate science, if it is true.
“The most obvious way for warming to be caused naturally is for small, natural fluctuations in the circulation patterns of the atmosphere and ocean to result in a 1% or 2% decrease in global cloud cover. Clouds are the Earth’s sunshade, and if cloud cover changes for any reason, you have global warming — or global cooling.”
Today, we have news of something that modulates cloud cover in a new paper by Henrik Svensmark in Nature Communications.
PRESS RELEASE: DTU Space at the Technical University of Denmark
A breakthrough in the understanding of how cosmic rays from supernovae can influence Earth´s cloud cover and thereby climate is published today in the journal Nature Communications. The study reveals how atmospheric ions, produced by the energetic cosmic rays raining down through the atmosphere, helps the growth and formation of cloud condensation nuclei – the seeds necessary for forming clouds in the atmosphere. When the ionization in the atmosphere changes, the number of cloud condensation nuclei changes affecting the properties of clouds. More cloud condensation nuclei mean more clouds and a colder climate, and vice versa. Since clouds are essential for the amount of Solar energy reaching the surface of Earth the implications can be significant for our understanding of why climate has varied in the past and also for a future climate changes.

atmosphere and produces a cascade of secondary particles who ionize molecules when traveling through the air. One 100 GeV proton hits every square meter at the top of the atmosphere every second.
Cloud condensation nuclei can be formed by the growth of small molecular clusters called aerosols. It has until now been assumed that additional small aerosols would not grow and become cloud condensation nuclei, since no mechanism was known to achieve this. The new results reveal, both theoretically and experimentally, how interactions between ions and aerosols can accelerate the growth by adding material to the small aerosols and thereby help them survive to become cloud condensation nuclei. It gives a physical foundation to the large body of empirical evidence showing that Solar activity plays a role in variations in Earth’s climate. For example, the Medieval Warm Period around year 1000 AD and the cold period in the Little Ice Age 1300-1900 AD both fits with changes in Solar activity.
“Finally we have the last piece of the puzzle explaining how particles from space affect climate on Earth. It gives an understanding of how changes caused by Solar activity or by super nova activity can change climate.”
says Henrik Svensmark, from DTU Space at the Technical University of Denmark, lead author of the study. Co- authors are senior researcher Martin Bødker Enghoff (DTU Space), Professor Nir Shaviv (Hebrew University of Jerusalem), and Jacob Svensmark, (University of Copenhagen).
The new study
The fundamental new idea in the study is to include a contribution to growth of aerosols by the mass of the ions. Although the ions are not the most numerous constituents in the atmosphere the electro-magnetic interactions between ions and aerosols compensate for the scarcity and make fusion between ions and aerosols much more likely. Even at low ionization levels about 5% of the growth rate of aerosols is due to ions. In the case of a nearby super nova the effect can be more than 50% of the growth rate, which will have an impact on the clouds and the Earth’s temperature.
To achieve the results a theoretical description of the interactions between ions and aerosols was formulated along with an expression for the growth rate of the aerosols. The ideas were then tested experimentally in a large cloud chamber. Due to experimental constraints caused by the presence of chamber walls, the change in growth rate that had to be measured was of the order 1%, which poses a high demand on stability during the experiments, and experiments were repeated up to 100 times in order to obtain a good signal relative to unwanted fluctuations. Data was taken over a period of 2 years with total 3100 hours of data sampling. The results of the experiments agreed with the theoretical predictions.
The hypothesis in a nutshell
- Cosmic rays, high-energy particles raining down from exploded stars, knock electrons out of air molecules. This produces ions, that is, positive and negative molecules in the atmosphere.
- The ions help aerosols – clusters of mainly sulphuric acid and water molecules – to form and become stable against evaporation. This process is called nucleation. The small aerosols need to grow nearly a million times in mass in order to have an effect on clouds.
- The second role of ions is that they accelerate the growth of the small aerosols into cloud condensation nuclei – seeds on which liquid water droplets form to make clouds. The more ions the more aerosols become cloud condensation nuclei. It is this second property of ions which is the new result published in Nature Communications.
- Low clouds made with liquid water droplets cool the Earth’s surface.
- Variations in the Sun’s magnetic activity alter the influx of cosmic rays to the Earth.
- When the Sun is lazy, magnetically speaking, there are more cosmic rays and more low clouds, and the world is cooler.
- When the Sun is active fewer cosmic rays reach the Earth and, with fewer low clouds, the world warms up.
- The implications of the study suggests that the mechanism can have affected:
- The climate changes observed during the 20th century
- The coolings and warmings of around 2°C that have occurred repeatedly over the past 10,000 years, as the Sun’s activity and the cosmic ray influx have varied.
- The much larger variations of up to 10°C occurring as the Sun and Earth travel through the Galaxy visiting regions with varying numbers of exploding stars.
The authors
- Dr. Henrik Svensmark, Danish National Space Institute, in the Technical University of Denmark (DTU).
- Senior Resercher Martin Andres Bødker Enghoff, Danish National Space Institute, in the Technical University of Denmark (DTU).
- Professor Nir Shaviv, Physics Institute, Hebrew University of Jerusalem.
- Ph.D. student Jacob Svensmark, Dark Cosmology Center, University of Copenhagen.
Full journal reference
H. Svensmark, M.B. Enghoff, N. Shaviv and J. Svensmark, Increased ionization supports growth of aerosols into cloud condensation nuclei, Nature Communications DOI: 10.1038/s41467-017-02082-2
The paper is here https://www.nature.com/articles/s41467-017-02082-2
Abstract:
Increased ionization supports growth of aerosols into cloud condensation nuclei
H. Svensmark 1, M.B. Enghoff 1, N.J. Shaviv2 & J. Svensmark1,3
Ions produced by cosmic rays have been thought to influence aerosols and clouds. In this study, the effect of ionization on the growth of aerosols into cloud condensation nuclei is investigated theoretically and experimentally. We show that the mass-flux of small ions can constitute an important addition to the growth caused by condensation of neutral molecules. Under present atmospheric conditions the growth rate from ions can constitute several percent of the neutral growth rate. We performed experimental studies which quantify the effect of ions on the growth of aerosols between nucleation and sizes >20 nm and find good agreement with theory. Ion-induced condensation should be of importance not just in Earth’s present day atmosphere for the growth of aerosols into cloud condensation nuclei under pristine marine conditions, but also under elevated atmospheric ionization caused by increased supernova activity.
From the discussion section of the paper:
This suggests that there are vast regions where conditions are such that the proposed mechanism could be important, i.e., where aerosols are nucleated in Inter-Tropical Convergence Zone and moved to regions where relative large variations ionization can be found. Here the aerosols could grow faster under the influence of ion condensation, and the perturbed growth rate will influence the survivability of the aerosols and thereby the resulting CCN density. Finally the aerosols are brought down and entrained into the marine boundary layer, where clouds properties are sensitive to the CCN density2.
Although the above is on its own speculative, there are observations to further support the idea. On rare occasions the Sun ejects solar plasma (coronal mass ejections) that may pass Earth, with the effect that the cosmic ray flux decreases suddenly and stays low for a week or two. Such events, with a significant reduction in the cosmic rays flux, are called Forbush decreases, and can be used to test the link between cosmic ray ionization and clouds. A recent comprehensive study identified the strongest Forbush decreases, ranked them according to strength, and discussed some of the controversies that have surrounded this subject.
Atmospheric data consisted of three independent cloud satellite data sets and one data set for aerosols. A clear response to the five strongest Forbush decreases was seen in both aerosols and all low cloud data. The global average response time from the change in ionization to the change in clouds was ~7 days, consistent with the above growth rate of ~0.4 nm h−1. The five strongest Forbush decreases (with ionization changes comparable to those observed over a solar cycle) exhibited inferred aerosol changes and cloud micro-physics changes of the order ~2%7. The range of ion production in the atmosphere varies between 2 and 35 ions pairs s−1 cm−337 and from Fig. 1b it can be inferred from that a 20% variation in the ion production can impact the growth rate in the range 1–4% (under the pristine conditions). It is suggested that such changes in the growth rate can explain the ~2% changes in clouds and aerosol change observed during Forbush decreases.
It should be stressed that there is not just one effect of CCN on clouds, but that the impact will depend on regional differences and cloud types. In regions with a relative high number of CCN the presented effect will be small, in addition the effect on convective clouds and on ice clouds is expected to be negligible. Additional CCNs can even result in fewer clouds. Since the ion condensation effect is largest for low SA concentrations and aerosol densities, the impact is believed to be largest in marine stratus clouds.
Further reading:
COSMIC RAYS, CLOUDS AND CLIMATE
Henrik Svensmark – DOI: 10.1051/epn/2015204
National Space Institute – Technical University of Denmark – Elektrovej, Bygning 328, 2800 Kgs – Lyngby, Denmark
The most profound questions with the most surprising answers are often the simplest to ask. One is: Why is the climate always changing? Historical and archaeological evidence of global warming and cooling that occurred long before the Industrial Revolution, require natural explanations.
Link to the PDF: SvensmarkEPN_46-2-2_2015
From that article:

Further Reading:

Scientists agree that the earth has become hotter over the last century. But on the causes, despite what looks to the public mind like a consensus, there are dissenting voices. Based on Henrik Svensmark’s research at the Danish National Space Center, this book outlines a brilliant and daring new theory that has already provoked fresh thinking on global warming. As prize-winning science writer Nigel Calder and Svensmark himself explain, an interplay of the sun and cosmic rays – sub-atomic particles from exploded stars – seem to have more effect on the climate than man-made carbon dioxide. For anyone interested in the real science behind our climate, this book is a must-read.
COUNTERPOINT:
I asked prominent solar physicist Dr. Leif Svalgaard his opinion on the paper (and sent him the advance full copy). He had this to say:
Think about this:
TSI over a solar cycle causes a variation of 0.05-0.10 degrees C. If GCRs as per Svensmark has 5-7 times the effect of TSI, that would translate to a temperature variation of 0.35-0.50 C over a cycle, which is simply not observed, hence the paper can be dismissed out of hand.
The battle over this paper will soon be waged in press and peer-review.
It’s the Sun stupid.
I’d like to see some discussion of space charge. If cloud condensation nuclei have a negative charge they will repel each other and resist raining out. But make the space charge negative and the repulsion is reduced. Tropical thunderstorm activity produces a negative space charge. A teleconnection? This would confound the data but not remove the Svensmark effect. The other thing is lag times, which Dr Svalgaard does not consider. With the oceans involved in the dynamics of climate, it may appear that a single solar cycle does not have an effect although several consecutive cycles will make their effect apparent.
Think about this:
Nobody knows how to model clouds. So Dr. Leif Svalgaard’s opinion on the paper can be dismissed out of hand.
So, this is a very measurable theory. Don’t we have satellites that measure Earth’s albedo? If the theory is true, we should be able to see the albedo go up as sunspots go down. Show me the data.
“Think about this:
TSI over a solar cycle causes a variation of 0.05-0.10 degrees C. If GCRs as per Svensmark has 5-7 times the effect of TSI, that would translate to a temperature variation of 0.35-0.50 C over a cycle, which is simply not observed, hence the paper can be dismissed out of hand.”
GCRs are not only dependent on the cycle though, are they. Unlike TSI, GCRs are dependent on their sources.
So based on that, no it should not be dismissed out of hand, and a poor counterpoint to boot
The topic is also a good reminder of why climate models will probably always be wrong. Clouds form from air that is super-saturated with water vapor. I.e. it is severely out of equilibrium, with no way of consistently predicting when, if ever, it will return to an equilibrium state. A climate model that cannot predict when water will condense is not much use.
Yeahbut… if I want to know whether it will rain on Thursday, I read the weather forecast.
…from weather systems that have already formed.
and climate models have to concern themselves with radiation to space that takes place from (super)saturated air above the tropopause. There are lot of unknowns in the formation of cirrus clouds. Some have suggested they may partly be due to methane oxidation in the stratosphere.
The link has been pretty obvious to anyone with an open mind a even a bit of knowledge of the science for years even decades.
What is appalling is that something so simple has taken such a long time. And that has clearly resulted from the Climate mafia blocking Svensmark and each and every turn. So well done Svensmark for having the time and patience to get this through.
But I don’t. And like the solar link, it is pretty obvious to me that the 1970-2000 warming was regional and directly linked to the reduction in aerosol/cloud forming pollution. Link: http://scottishsceptic.co.uk/2017/04/09/the-cause-of-1970-2000-warming/
So well done Svensmark – it’s superb work, but what I mostly admire is to have the shear dogged determination to have finally got this through the Climate stazi.
I’m sure there is some movement today in the EU and other nations like Canada on how they are going to tax cosmic rays…
+1
Especially those cosmic rays that can be attributed to the U.S. portion of the stratosphere
CRVAT tax
IMO: Toss the make-up of the atmosphere, ocean temps, TSI, cosmic rays, plate tectonics, precession, orbital mechanics, volcanoes, solar storms, abundance of flora, and a few unknowns into a pot, stir well, and the resulting climate/weather will have a poor correlation to any individual component.
We should see the cloud cover in satellite images if we look over a long enough period ? This should correlate to sunspots ?
Are supporters and detractors talking past each other? The time scale on the graph from the paper is in millions of years, evidence against is in decades.
Yes, the graph from the paper.A good place to start.
OK, correlation is not causation.
But causation cannot be involved unless there is correlation, as is shown in the graph from the paper.
Physical experiment is used to show nidus formation in the atmosphere.
My thoughts of the paper’s intent and finding.
The ‘butterfly’ Galactic Cosmic radiation from suprnovae points the direction of climate change, as a car is steered from the driver’s wheel. The car engine, like the heat engine of the earth’s atmosphere, modifies the energy.
The time scale of the GCR is greater than the satellite record.
See https://www.thegwpf.com/cosmic-ray-cloud-climate-link-found/
Nevertheless, Svensmark is right, let us not forget that the surface of the earth consists of 70 per cent of oceans, which serve as a buffer against such minor temperature fluctuations over an 11-year cycle. You could also say, just when it starts to cool down minimally, the sun turns up again. The situation is different in longer periods of time when the cosmic rays become stronger both in the minimum and in the maximum of the solar cycle. Let us just think of the different ups and downs of the warm and cold periods of the past millennia. It is clear that in cold weather the sun was weak, even though modern naysayers blame volcanic activity. Although their climatic impact took little longer than 3-4 years. But maybe it’s different too. It could also be that volcanic events in shallow solar times interact with the solar dysfunction and can increase cloud coverage for a longer period of time.
Tell that to Svensmark. I think he missed the memo. He claims an immediate effect on clouds [which would also make sense physically if there is any effect at all]:
http://www.leif.org/research/Svensmark-Low-Clouds-GCRs.png
(from http://www.leif.org/EOS/0005072-Svensmark-GCR-Climate.pdf)
Unfortunately [as for all spurious correlations] the effect didn’t hold up when more data became available:
http://www.leif.org/research/Cloud-Cover-GCR-Disconnect.png
In addition, solar activity has been decreasing the past half-century [cosmic ray intensity increasing according to Svensmark et al. with more clouds and cooling as result] while temperatures have been rising. So, the evidence is against the GCR-Cloud-Temp idea.
“while temperatures have been rising”…
well…….but there’s a fly in the soup
In other words, it’s the integral of sunspot activity that matters more than the current value or the trend. The past 50 years have seen the highest activity in the historical record, despite being on a downtrend.
Dr Svalgaard is more than a little disingenuous by saying that solar activity has been in decline for the past 50 years. Cycles 21, 22 and 23 were all strong cycles. Much higher than the average over the last few thousand years.
hat solar activity has been in decline for the past 50 years
Look and learn:
http://www.leif.org/research/Bias-Confirmed.png
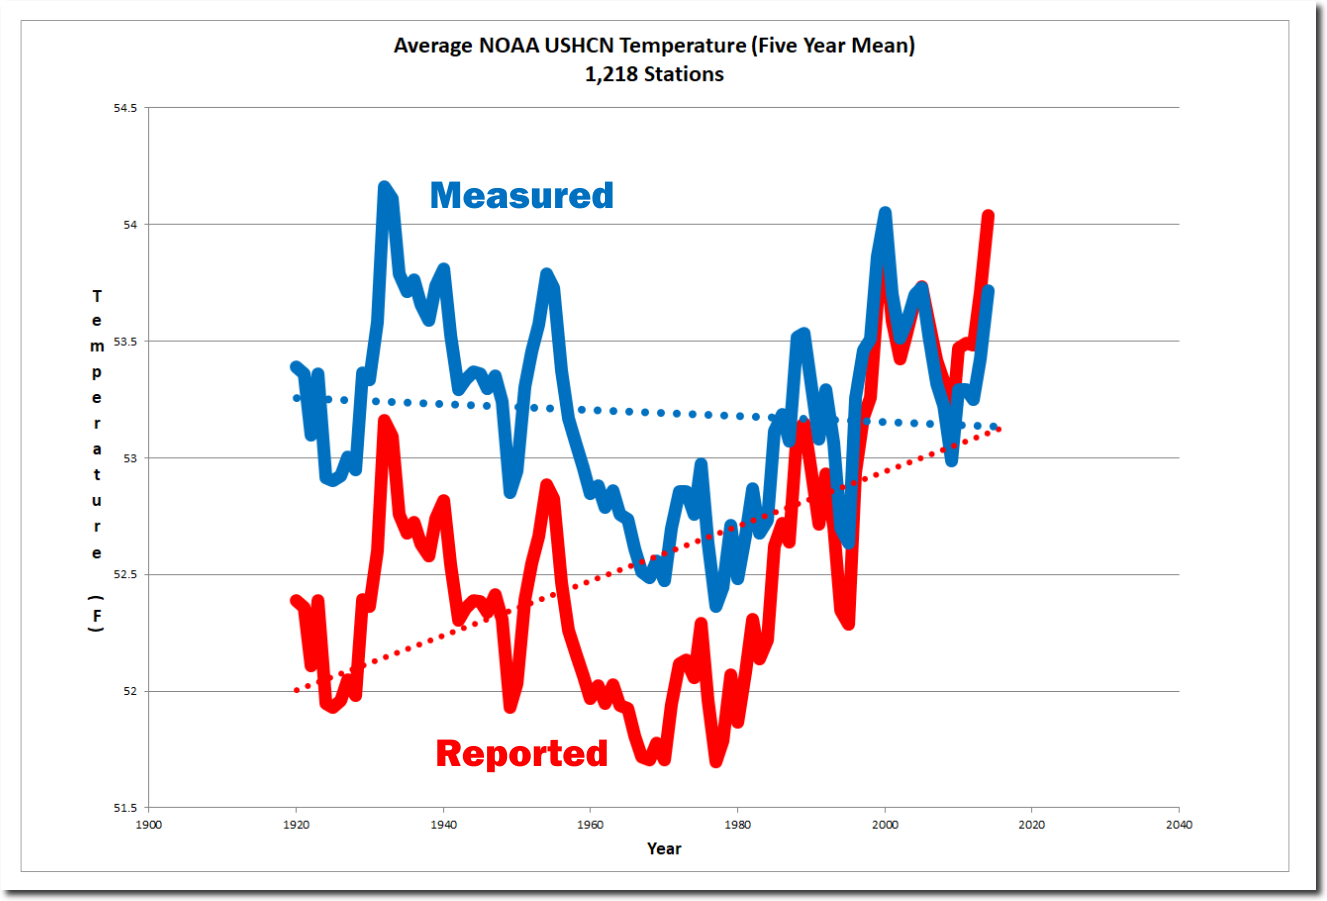
solar activity has been decreasing the past half-century….
exactly like the unadjusted temps…
Latitude December 20, 2017 at 6:34 am
Also note that the 50 year fall is from the highest peak on that graph following 50 years of even steeper climb. Which is basically a repeat of the 1700s and 1800s, except their climbs were even steeper.
Like our climate that Solar activity is never “stable”, it is up and down like a YoYo.
“solar activity has been decreasing the past half-century….
exactly like the unadjusted temps…”
Really?
http://2.bp.blogspot.com/-T65Ti_Kr_I4/Vp-ygKu_7XI/AAAAAAAADWU/PZrDckqeavY/s1600/Untitled.png
NOAA is a pack of lies. Even its unadjusted “data” are bogus.
Al governments lie. Almost all the time.
Gabro, I agree, that graph is NOT unadjusted, in fact it is not even the normal adjusted, it has the latest full set of adjustments.
!997/8 was warmer than any temperature since in the original NOAA data and it can still be found.
The 1998 anomaly at todays baseline would be at least 3.94C
What needs to be appreciated is that the effects on climate, of a change in cloud cover, are likely to be highly non-linear. Only a small proportion is likely to result in direct change in temperature. As I understand it, a substantial proportion of the sun’s radiation hitting the earth is absorbed deep within the oceans. Thus, if cloud cover is reduced a portion of the excess radiation will result in a direct increase in atmospheric temperature. However, a substantial portion of the excess energy will be absorbed deep within the oceans. Given the extremely high thermal mass of the oceans and the very long time constants for heat transfer processes within the oceans, this excess energy is unlikely to be transferred to the atmosphere for a period of years, if not decades. Could this be the mechanism behind the multi-decadal variation in ENSO that appears to be the most significant driver of atmospheric temperatures.
I am a simple man. (Ask anyone.) If ocean cycles have periods of ~60 years, why doesn’t it follow that energy that entered it 60 years ago (at the height of the modern sunspot maximum, 1958) is only now being released to the atmosphere, or perhaps that it has been released in a continuous manner over that time period, where temperature gradients between ocean and atmosphere are the greatest?
Nice post, maybe one mystery less, but I cannot agree with Dr. Roy Spencer that Mother Nature makes fool of the world’s top climate scientists. They make fools of themselves. Instead of observations, measurements and good scientific instinct they follow a political agenda. I wonder why they don’t realize it.
CCNs or CO2s? Clearly both have an effect. Both are merely catalysts for larger atmospheric changes through various feedback mechanisms. CO2 has the advantage of being attributable to man which seems to be a very attractive feature since it gets government and lots of funding involved. CCNs have the advantage of explaining how come climate change seems to have been around long before man came along and started spewing CO2. I think we’ve narrowed it down to the main two contenders. Let the games begin! CO2 advocates, explain how CO2 caused climate change without man around, especially for those times before man during which the CO2 was at 7000ppm. CCN advocates, explain the feedbacks that blow the cosmic ray effect up into an atmosphere mover. Peacemakers, combine the two into a believable theory.
Rather than worry about the secondary effects on climate, why don’t we focus on using this work to understand clouds. Then, whenever we can accurately measure climate globally and have an understanding of the latency involved with each driver or buffer, we evaluate the role of GCR driven cloud formation in climate.
This will be interesting. As has been noted, models don’t do clouds very well, and Svensmark’s theory is about the effect on clouds. As types of clouds have differing effects, this should be a bear to sort out.
Clouds and cloud formation follow chaos theory, not politics.
I’ve always felt this to be true. If global warming is a concern, I believe we already have the technology to increase cloud cover, and what a simple solution that would be.
Just as long as nobody tries it at the wrong time.
A good time to use it would be on any politician making a speech promoting Global BS Warming as a political message. A highly localized rainfall duping about 10 gallons of water on a Greenbean politician (e.g., Brown of CA) at just the right moment would be an enormous kindness to the rest of us on Mother Nature’s part.
If the climate wars were not on going this problem would have been solved decades ago.
It is a fact that planetary temperature changes cyclically and the cyclical change in the earth’s climate correlates with solar changes.
http://wattsupwiththat.files.wordpress.com/2012/09/davis-and-taylor-wuwt-submission.pdf
This is one of more than a hundred papers that not there is correlation of past climate change with solar changes.
http://ruby.fgcu.edu/courses/twimberley/EnviroPhilo/PersistentSolarInfluence.pdf
There is a 99.5% correlation of GCR level to planetary cloud cover 1974 to 1994.
Mechanism where Changes in Solar Activity Affects Planetary Cloud Cover
1) Galactic Cosmic Rays (GCR)
Increases in the sun’s large scale magnetic field and increases in the solar wind speed reduces the magnitude of GCR that strike the earth’s atmosphere. Satellite data shows that there is 99.5% correlation of GCR level and low level cloud cover 1974 to 1993.
2) Increase in the Global Electric Circuit
Starting around 1993, GCR and low level cloud cover no longer correlate. (There is a linear reduction in cloud cover.) The linear reduction in cloud cover correlates in time with an increase in high latitude solar coronal holes which cause high speed solar winds. The high speed solar winds cause a potential difference between earth and the ionosphere. The increase in potential difference removes cloud forming ions from the atmosphere through the process “electro scavenging”. Satellite data (See attached link to Palle’s paper) that confirms that there has been a reduction in cloud cover over the oceans (There is a lack of cloud forming ions over the oceans. There are more ions over the continents due to natural radioactivity of the continental crust that is not shielded from the atmosphere by water.)
http://bbso.njit.edu/Research/EarthShine/literature/Palle_etal_2004_ASR.pdf
Analysis of the change in the earth’s albedo determined the change in albedo caused warming of 7.5 watts/m^2 as compared to the IPCC calculated warming due to CO2 of 2.5 watts/m^2.
“There is a 99.5% correlation of GCR level to planetary cloud cover 1974 to 1994.”
From: http://www.leif.org/EOS/swsc120049-GCR-Clouds.pdf
“Despite over 35 years of constant satellite-based measurements of cloud, reliable evidence of a long-hypothesized link between changes in solar activity and Earth’s cloud cover remains elusive. This work examines evidence of a cosmic ray cloud link from a range of sources, including satellite-based cloud measurements and long-term ground-based climatological measurements. The
satellite-based studies can be divided into two categories: (1) monthly to decadal timescale analysis and (2) daily timescale epoch superpositional (composite) analysis. The latter analyses frequently focus on sudden high-magnitude reductions in the cosmic ray flux known as Forbush Decrease events. At present, two long-term independent global satellite cloud datasets are available (ISCCPand MODIS). Although the differences between them are considerable, neither shows evidence of a solar-cloud link at either long or short timesca es. Furthermore, reports of observed correlations between solar activity and cloud over the 1983–1995 period are attributed to the chance agreement between solar changes and artificially induced cloud trends. It is possible that the satellite cloud datasets and analysis methods may simply be too insensitive to detect a small solar signal. Evidence from ground-based studies suggests that some weak but statistically significant cosmic ray-cloud relationships may exist at regional scales, involving mechanisms related to the global electric circuit. However, a poor understanding of these mechanisms and their effects on cloud makes the net impacts of such links uncertain. Regardless of this, it is clear that there is no robust evidence of a widespread link between the cosmic ray flux and clouds.”
You are confusing a fight that goes on for ever which is boring with a scientific discussion.
Are you interested in science?
There are cycles of warming and cooling in the paleoclimatic record, which are called Dansgaard-Oeschger (D-O) cycles.
The past warming and cooling cycles must have a cause.
The 1470 year warming and cooling cycle (sometimes with abrupt cooling) is observed in both hemispheres which rules out earth causes as internal forcing mechanisms for the earth are chaotic, not periodic and in addition cannot cause the observed change in planetary temperature.
As each D-O cycle correlates with a solar cycle changes the question is not if the solar magnetic cycle changes caused the past observed D-O cycles but rather how. The 20th century warming matches the pattern of warming that was observed in other D-O cycles.
The sun is causing the changes.
http://www.climate4you.com/images/GISP2%20TemperatureSince10700%20BP%20with%20CO2%20from%20EPICA%20DomeC.gif
http://www.agu.org/pubs/crossref/2003/2003GL017115.shtml
“Are you interested in science?”
What a bizarre comment.
I posted links to some.
Oh, and yet again the deceptive “Alley” graph is posted here The that ends in 1855 and therefore does not include modern warming.
https://wattsupwiththat.com/2013/04/13/crowdsourcing-the-wuwt-paleoclimate-reference-page-disputed-graphs-alley-2000/
So, are you interested in science?
This paper virtually confirms my working hypothesis as published recently in Energy & Environment and which has been discussed for some years on several WUWT threads.
The coming cooling: usefully accurate climate forecasting for policy makers.
Dr. Norman J. Page Email: norpag@att.net
DOI: 10.1177/0958305X16686488
Energy& Environment
0(0) 1–18
(C )The Author(s) 2017
Reprints and permissions:
sagepub.co.uk/journalsPermissions.nav
DOI: 10.1177/0958305X16686488
journals.sagepub.com/home/eae
ABSTRACT
This paper argues that the methods used by the establishment climate science community are not fit for purpose and that a new forecasting paradigm should be adopted. Earth’s climate is the result of resonances and beats between various quasi-cyclic processes of varying wavelengths. It is not possible to forecast the future unless we have a good understanding of where the earth is in time in relation to the current phases of those different interacting natural quasi periodicities. Evidence is presented specifying the timing and amplitude of the natural 60+/- year and, more importantly, 1,000 year periodicities (observed emergent behaviors) that are so obvious in the temperature record. Data related to the solar climate driver is discussed and the solar cycle 22 low in the neutron count (high solar activity) in 1991 is identified as a solar activity millennial peak and correlated with the millennial peak -inversion point – in the UAH temperature trend in about 2003. The cyclic trends are projected forward and predict a probable general temperature decline in the coming decades and centuries. Estimates of the timing and amplitude of the coming cooling are made. If the real climate outcomes follow a trend which approaches the near term forecasts of this working hypothesis, the divergence between the IPCC forecasts and those projected by this paper will be so large by 2021 as to make the current, supposedly actionable, level of confidence in the IPCC forecasts untenable.
For an earlier discussion with supporting data and discussion see
https://wattsupwiththat.com/2017/12/11/study-finds-a-solar-amplification-mechanism-by-which-solar-activity-cosmic-rays-control-climate/#comment-2692016
Here is a neat example Fig11 from
Fig.11 Tropical cloud cover and global air temperature (29)
The global millennial temperature rising trend seen in Fig11 (29) from 1984 to the peak and trend inversion point in the Hadcrut3 data at 2003/4 is the inverse correlative of the Tropical Cloud Cover fall from 1984 to the Millennial trend change at 2002. The lags in these trends from the solar activity peak at 1991-Fig 10 – are 12 and 11 years respectively. These correlations suggest possible teleconnections between the GCR flux, clouds and global temperatures.
That’s weaker solar causing a reduction in tropical cloud cover with very little lag.
The counterpoint is all I needed to read.
This is great science. Now we just need to include the oceans in the variable mix to complete the picture.
High ice dominated Ci/Cc clouds warm the Earth overall while water dominated low clouds cool.
So where do these GCR’s exert most influence, if any?
http://www.iac.es/galeria/epalle/reprints/Palle_JASTP_2002.pdf
“Several authors have suggested that a link exists between the flux of galactic cosmic rays (GCR) and cloudiness. Here we review the evidence for such a connection from studies of cloud factors using both satellite and ground-based data. In particular, we search for evidence for the low cloud decrease predicted by the rising levels of solar activity and the low cloud-cosmic ray flux correlation indicated by satellite data. Sunshine and synoptic cloud records both indicate that the global total cloud cover has increased during the past century. This increase in total cloud cover argues against a dominating role by solar activity (via GCR) over cloud formation on centennial time scales. Either the predicted low cloud decrease has not occurred or the medium-high level cloud has increased to a greater extent than low cloud has decreased.
As there is no accurate long term data available on low cloud behaviour during the last century, we are not able to totally dismiss the link between GCR and cloudiness, but we list a number of arguments for and against the proposed cosmic ray-cloud connection.”
This study …..
https://link.springer.com/chapter/10.1007/978-94-007-4348-9_5
Says:
“Atmospheric ions produced through solar-modulated galactic cosmic rays can promote both the nucleation and the growth of aerosols. The potential impact on the cloud cover is subject of current debates. The CAWSES project SAGACITY (SAtellite and model studies of GAlactic cosmic rays and Clouds modulated by solar activITY) focuses on the statistical analysis of this link, using MIPAS-E satellite data. The extinction data, the cloud occurrence frequency, and the cloud index data from MIPAS-E are correlated with the data from the Climax neutron monitor. A superposed epoch analysis of 6 selected Forbush decrease events yields several weak but statistically significant correlations with an excess of positive cloud-GCR correlations. The impact of a 15 % increase in the Climax neutron monitor data is estimated to result in a small decrease in cloud index (corresponding to an increase in cloud opacity) which is most pronounced at 9 km altitude (−9 % to +0.5 %).”
So which is it? Preferentially high or low cloud formation (if any) or perhaps both making for a zero sum.
Toneb See 7:43 AM post above.
In discussions of GCR and cloud formation, I always interject the fact that Charles T. R. Wilson late 19th-early 20th Century won the Nobel Prize for his “Cloud Chamber” in which you can see the track of sub Atomic particles created by collision of GCR with atmospheric molecules as a streak of tiny clouds that condensed along the track.
I mention this for two reasons. First, because I never see attribution to Wilson for the very idea used by Svensmark. Second, without this information, the mechanism seems odd, contrived and fanciful to the lay sceptical reader. The assurance that this mechanism is real and observable and has resulted in the discovery of several subatomic particles generating more Nobel prizes for other scientists during the 20th C, would add more support to Svensmark’s theory. It may turn out that the effect is not strong, but the reader will at least find himself giving credence to the phenomenon. H.S. is unlikely to read this comment but a friend should advise him to heed it.
Back in 1959, Edward Ney suggested that variations in cosmic rays, which are charged particles mostly originating outside the solar system, could affect our weather
So it is not even Svensmark’s idea.
I am not making a judgement about who is right or wrong, but the tone of your endless comments on this is of a very personal nature.
You must separate what you perceive as the ‘tone’ from the information content of the comments.
Grow up.
Yes, and the Vikings discovered America, not Columbus. No wait evidence has surfaced that it was the Romans, no Chinese, no Egyptians…….
As I recall, it was his fascination with the cloud chamber that sparked Svensmark’s leap into the interaction between cosmic radiation and Earth’s atmosphere. This man has spent years running laborious experiments on a shoe-string budget, with help from like-minded scientists. He has been subjected to a lot of ridicule, public abuse and derision yet his work has been confirmed by the boffins at CERN. Svensmark’s dogged determination is right up there with the likes of Microsoft and Apple, both of which started in humble garages. This man is a scientist in the applied sense …
AGAIN talking about clouds when cosmic rays can only produce haze.