New research yields old result: Climate warming slow, steady. Observed value is half that of CMIP5 climate models.
HUNTSVILLE, Ala. (Nov. 29, 2017) — The rate at which Earth’s atmosphere is warming has not significantly accelerated over the past 23 years, according to research at The University of Alabama in Huntsville (UAH).
If you take away the transient cooling in 1983 and 1992 caused by two major volcanic eruptions in the preceding years, the remaining underlying warming trend in the bottom eight kilometers (almost five miles) of the atmosphere was 0.096 C (about 0.17° Fahrenheit) per decade between January 1979 and June 2017.
That was unexpectedly close to the 0.09 C warming trend found when similar research was published in 1994 with only 15 years of data, said Dr. John Christy, director of UAH’s Earth System Science Center.
This work might also indirectly affirm recent research showing the atmosphere is less sensitive to the warming effects of rising levels of carbon dioxide and other greenhouse gases than global climate models have suggested.
“We indicated 23 years ago — in our 1994 Nature article — that climate models had the atmosphere’s sensitivity to CO2 much too high,” said Christy, the lead author in the study, which has been accepted for publication in the 2017 fourth quarter edition of the Asia- Pacific Journal of Atmospheric Sciences and is available online. “This recent paper bolsters that conclusion.”
Mathematically removing the natural but transient climatic effects of volcanoes and El Niño/La Niña Pacific Ocean warming and cooling events leaves an underlying climate trend, all or some part of which might be attributed to human causes — including enhanced greenhouse forcing caused by rising levels of CO2 and other manmade greenhouse gases in the atmosphere.
At present, however, there is no accepted tool or technique for confidently estimating how much of the warming in the past 38+ years might be due to natural causes.

“For the purposes of this research, we assumed the climate was stable during that time, that the natural climate trend would have been zero,” Christy said. “If the natural trend was zero, then the climate models say the atmosphere is more than twice as sensitive to CO2 as the data might suggest.
“Of course, if the natural trend was greater than zero — if the natural climate was warming even a little bit — then the models have the atmospheric sensitivity to CO2 even further out of whack than that.”
The paper also describes a new index for determining the sensitivity of the climate system to extra greenhouse gases. Previously, indexes of this kind were based on the surface temperature.
Christy and UAH’s Dr. Richard McNider created a new index: the Tropospheric Transient Climate Response, which is based on the bulk atmosphere. That is a more representative quantity for any impact of increased greenhouse gases.
“The idea behind this index is to determine what the temperature increase will be by the decade when anthropogenic greenhouse gas forcing — which is dominated by CO2 — doubles what it was in about 1880,” Christy said. “We should reach that level — about 560 ppm of CO2 — in the latter half of this century.
“From our observations we calculated that value as 1.1 C (almost 2° Fahrenheit), while climate models estimate that value as 2.3 C (about 4.1° F),” Christy said. “Again, this indicates the real atmosphere is less sensitive to CO2 than what has been forecast by climate models. This suggests the climate models need to be retooled to better reflect conditions in the actual climate, while policies based on previous climate model output and predictions might need to be reconsidered.”
In their research, which was supported by the U.S. Department of Energy, Christy and McNider found the climatic effects of El Niño/La Niña warming and cooling events in the eastern equatorial Pacific Ocean largely cancelled each other out over the study period.
That left the El Chichon and Pinatubo volcanic eruptions in 1982 and 1991 as the remaining major natural perturbations to the climate trend, although that had as much to do with the timing of the eruptions as it did with the cooling caused by the nearly global distribution of volcanic ash in the upper atmosphere.
“Those eruptions happened relatively early in our study period, which pushed down temperatures in the first part of the dataset, which caused the overall record to show an exaggerated warming trend,” Christy said. “While volcanic eruptions are natural events, it was the timing of these that had such a noticeable effect on the trend. If the same eruptions had happened near the more recent end of the dataset, they could have pushed the overall trend into negative numbers, or a long-term cooling.
“By taking them out of the equation, we leave behind only that part of the climate influenced by nature’s long-term changes and human influences.”
Other researchers have tried to calculate the climate’s sensitivity using temperature data collected at the Earth’s surface. But that data lacks complete global coverage, especially over the oceans. Changes in the character of the land surface near thermometers (such as paving and urban growth) and changes in the thermometer instruments over time also add uncertainty to the data.
“Additionally, surface temperatures used for tracking climate change use the average of daily maximum and minimum temperatures,” said McNider, a distinguished professor emeritus at UAH. “Those minimum nighttime temperatures reflect only the temperature of a shallow layer of air near the surface and not temperatures in the deep layer of the atmosphere.”
Using satellite instruments to collect temperature data from the bulk atmosphere is a better and more robust tool for detecting the addition of energy related to extra greenhouse gases in the atmosphere, Christy said.
The unadjusted climate trend in the deep troposphere from January 1979 to June 2017 was +0.155 C (about 0.279° F) per decade.¹ After adjusting for the volcanoes and other less significant effects, including the Atlantic multi-decadal oscillation and the Pacific decadal oscillation, the trend drops to 0.096 C per decade — or about 0.364 C (0.66° F) total since December 1978.
Christy and McNider suggest two other possible explanations for the discrepancies between climate model forecasts and reality:
- The transfer of heat energy between the atmosphere and the ocean isn’t well understood, including the roles of wind, currents and ocean conditions. If more heat is transferred to the oceans than is accounted for by the models, that “is a negative atmospheric feedback, at least on shorter time scales.”
- Heat the models suggest should be staying in the atmosphere might instead be expelled more readily through the atmosphere into space, or is being more rapidly mixed into the oceans. In either case, that heat would not be available for warming the atmosphere.
“Also, if the atmosphere isn’t accumulating heat at the rate forecast by the models, then the theoretical positive climate feedbacks which were expected to amplify the CO2 effect won’t be as large,” McNider said. “For instance, one of the major climate feedbacks built into the models is increased water vapor. It was hypothesized that if CO2 warmed the atmosphere, the amount of water vapor — itself a powerful greenhouse gas — in the atmosphere should increase.
“The water feedback built into the models, however, depends first on warming in the deep layer of the atmosphere,” he said. “The lack of warming there means this feedback will be much less.”
As part of an ongoing joint project between UAH, NOAA and NASA, Christy and Dr. Roy Spencer, an ESSC principal scientist, use data gathered by advanced microwave sounding units on NOAA and NASA satellites to get accurate temperature readings for almost all regions of the Earth. This includes remote desert, ocean and rain forest areas where reliable climate data are not otherwise available.
Since the first microwave sounding unit was launched into orbit in November 1978, satellite-based instruments have measured the temperature of the atmosphere from the surface up to an altitude of about eight kilometers above sea level.
This is an especially important region of the atmosphere because climate models have forecast the deep layer of the lower atmosphere is the area where CO2-influenced warming should occur first and by the greatest amounts.
Once the monthly temperature data are collected and processed, they are archived for immediate access by atmospheric scientists in the U.S. and abroad.
The complete version 6 lower troposphere dataset is available here: http://www.nsstc.uah.edu/data/msu/v6.0/tlt/uahncdc_lt_6.0.txt
— 30 —
(1) The 0.155 C per decade trend reported here differs from the 0.13 C per decade trend recently reported in the Global Temperature Report, which is published monthly by UAH’s Earth System Science Center. The research reported here was done using an earlier version of the satellite microwave sounding unit dataset. That dataset was revised and updated, and the revisions published (Spencer et al., APJAS 2017) while the research reported here was under peer review.
The new 2017 paper: 2017_Christy_McNider (PDF)
The 1994 paper: 1994_ChristyMcNIder
So the question is, what do we do now?
1. Say the paper was not published in the right journals and dismiss it?
2. Say the writers are on big oil pay?
3. Go right to the lawsuit?
Or… perhaps we can discuss the science behind this study… maybe?
The 2018 United Nations climate summit COP24 will be held in Katowice, the heart of Poland’s coal-mining industry.
What a party that will be, with a declaration that we no longer face extinction due to global warming. All those Paris delegates will be able to pack up and go home and do some real work, the junkets are over. I think suitable work for them would be to work in the mining industry, producing real wealth for poor nations, not simply handouts.
Robber,
The mining industry has tight standards for recruiting new employees. Geoff.
From No Tricks Zone:
CO2 Warming Grossly Exaggerated… 60 Published Papers Find Extremely Low Climate Sensitivity To Doubled CO2!
http://notrickszone.com/2016/06/13/co2-warming-grossly-exaggerated-50-published-papers-find-extremely-low-climate-sensitivity-to-doubled-co2/#sthash.QlikUIzX.dpbs
and,
Recent CO2 Climate Sensitivity Estimates Continue Trending Towards Zero
http://notrickszone.com/2017/10/16/recent-co2-climate-sensitivity-estimates-continue-trending-towards-zero/#sthash.7XMO8Gby.dpbs
So, having just read the paper, I can say that I truly enjoy reading a well written paper. Although I don’t personally have the knowledge base necessary to fully judge it, the conclusions are narrow, and potential alternatives are presented. This is a credit to the authors.
I do have one lingering question, though, which was identified by the paper. In section 3.c, while discussing potential reasons for the discrepancy between models and observations, the paper offers the following explanation (as one of two):
I feel kind of embarrassed to admit this, but (and this is something that’s bugged for a while now) I just can’t understand why the higher elevation of the effective radiation level has a net reduction to the amount radiated. I presume the logic is that since the temperature drops as elevation increases (in the troposphere), transferring the effective radiation level to a higher elevation will result in radiating at a lower temperature…which means less radiation, which ultimately leads to higher temperatures. If I’ve understood this correctly, then I can’t help but feel this is simply a clever way to claim that as more heat is added to the atmosphere, less heat can radiate away…
I understand, obviously, that the lower temperature at elevation means a lower intensity to the radiation flux…but isn’t radiative flux also directly proportional to the magnitude of the area? And isn’t there geometrically more area to radiate from with each incremental increase in elevation? So, it evens out, right?
And furthermore, isn’t non-physical to assert that more heat is going to cause the radiative level be at a lower temp? This seems like it’s predicated on an assumption that temperature of the atmosphere is only dependent on distance from the earth’s surface (height), which is then correlated to pressure. But, since volume is not constrained, pressure at any altitude can vary. So…yes, while, all other things being equal, gas at a higher elevation has a lower temperature, adding more heat means all other things aren’t equal.
Sorry, what am I missing here? I know I must have some error in my thought process, I just don’t know what it is. I’m open to any offers of clarification on this…
rip
The increase in height results in a tiny increase in the effective area, compared to the effect of the lower temperature. The effect is well explained in this link https://www.acs.org/content/acs/en/climatescience/atmosphericwarming.html
The final altitude of emission is determined by the decrease in density with altitude of the emitting gas. At low densities there are not enough molecules to emit significant amounts of radiation. As you add more CO2, the altitude at which CO2 density becomes too thin to radiate increases, and the temperature of radiation becomes lower.
Thanks, all, for the responses.
eadler2, reading through your link is instructive. Thank you. I’ll admit that most, if not all, of the information presented is quite familiar to me. So, from that perspective, nothing new. Interestingly, that site itself says something that I interpret to be exactly my point. To wit:
https://www.acs.org/content/acs/en/climatescience/atmosphericwarming/multilayermodel.html
This seems to confirm my understanding that you can’t force CO2 to emit at a colder temperature by simply driving it to higher altitude. (Unless the theory is proposing that the sum of energy is fixed, and the more CO2 added drops the average of each molecule.)
I don’t know. I guess I have more studying to do and more grappling with where my error in understanding is.
Thanks again.
rip
Ripshin:
“but isn’t radiative flux also directly proportional to the magnitude of the area? And isn’t there geometrically more area to radiate from with each incremental increase in elevation? So, it evens out, right?”
A quick calc makes the increase in area from the Earth’s surface to a sphere at 8km above about 0.8%.
At ~8Km (corresponding to ~255K) then that “sphere” is radiating at 240 W/m2
Whereas at the surface (288k) it’s radiating at 390 W/m2
0.8% of the difference+diff = 150×0.8 = 12 W/m2
So decrease in radiative emittance = 150-12 = 138 W/m2
Not even sure the increase radiating area applies as it is primarily the CO2 molecules that are radiating there, and they will be less than at the surface.
“This seems to confirm my understanding that you can’t force CO2 to emit at a colder temperature by simply driving it to higher altitude. (Unless the theory is proposing that the sum of energy is fixed, and the more CO2 added drops the average of each molecule.)”
The Co2 molecule when taken to altitude (say 8 km), naturally cools by the LR. To an average of -18C. It therefore is bound to radiate at that temp and thus do so at a rate of 150 W/m2 (maybe minus 12 of that) than if at the surface.
Thanks Toneb. I had actually just gotten around to actually calculating and came up with 0.38% increase for 12km (looks like 0.25% by my calc for your 8km altitude). I guess this pretty much puts this to bed for me. I was neglecting to take into account the relative size of the earth’s radius. Just focusing on how big the atmosphere was relative to my own diminutive self. (Diminutive relative to the size of the earth, that is. And that delta has been significantly reduced following Thanksgiving!!!)
Should have done this originally instead of wasting people’s time with a dumb question. Thanks for your patience.
Also, regarding the second point, I completely understand that CO2 at elevation will radiate at a cooler temperature than at the surface. And, if that’s all that’s being proposed, then I withdraw my question since I clearly misunderstood. I had thought it was being suggested that adding CO2 to the atmosphere would drive the effective radiating level of CO2 from wherever it was to start (some X km’s above the surface) to a higher elevation (x + y km’s above the surface), and that this increase would necessarily reduce the effective radiating temperature from the 230ish Ks it started at, to something below this. That was what I was having trouble understanding.
rip
“A quick calc makes the increase in area from the Earth’s surface to a sphere at 8km above about 0.8%.”
quick indeed. And wrong (anyone can be sometime wrong, but when it comes from Toneb it is more than sometime… )
from R= to R’= R+e, e<<R, the relative increase in surface is ~2e/R = ~16/6400 = 0.0025 = 0.25 %
Radiation is related to temperature to the fourth power while surface area is to change in altitude squared. Lapse rate would have to be pretty small to make that work. (to be exact greater
Owen,
I understand this point. I guess my only thought here to clarify is that, yes, radiation emits to the 4th power…but it’s related to the 4th power of a really small number…but, as you point out, this is directly calculable. I guess I’ll have to make the effort to run through the actual math myself. (Apparently I’m too stubborn to just take your word for it…I have to see for myself that the math works. 🙂 )
rip
I find it helps to think of these things in terms of total energy, not temperature. The key here is to realize that the atmosphere is less dense the further you travel from the surface of the planet.
“Should have done this originally instead of wasting people’s time with a dumb question. Thanks for your patience.”
You are NOT wasting people’s time, crackers and Co are. And Toneb, seeing his answer, just doesn’t understand what he is trying to explain, and cannot even do basic calculation right, so HE is wasting your time.
I advise you duckduckgo “optical depth”. The best way to understand GHE is as follows, from space point of view:
* Earth is more or less at radiative equilibrium. It radiates as if at ~ -18°C / 255K
* radiation, on average, looks like it comes from somewhere in atmosphere (even though it really doesn’t, some of it comes from the ground and any altitude)
* lapse rate command Earth surface temperature, so the higher the apparent emission altitude, the higher surface temperature
* GHG make atmosphere more opaque, increasing optical depth, rising the emission apparent altitude and thus surface temperature [All the controversy is about this point only: to what extent CO2 really increase optical depth? a lot? very little? not at all? some say it even reduce optical depth, which could indeed happen if radiation from low altitude CO2 substitutes itself to higher altitude emitters’]
This answer you question,
and also explains Mars and Venus GHG. Venus is much hotter at surface, despite with close to ~2 less incoming radiation at surface level and only marginally more efficient GHG (Earth’s are already >90% efficient, Venus’ are more but still <100%, so Venus only enjoy a less than 10% increase in pure greenhouse effect). But its emission apparently (seen from space) comes from much higher altitude in its much thicker atmosphere. With the very same GHG, but a thinner atmosphere, Venus would be colder. Like Mars is. Mars has as much CO2 as Earth, but so thin atmosphere the lapse rate has very small effect.
Thanks paqyfelyc. I’ll take your suggestion on searching optical depth. It definitely sounds like approaching it from this perspective could resolve some nuances that I’m having trouble understanding. Appreciate the time and patience!
rip
Did the authors use TLT data sets other than their own, UAH? This is significant, since exactly the same data used by UAH is also interpreted by RSS (Remote Sensing Systems). RSS finds a much stronger warming trend over the period mentioned. RSS is also in better agreement with the surface data trends over the same period than UAH.
DWR, according to the article they used v5.6 for the study and uah v5.6 is fairly close to rss v4. (see footnote 1)…
and uah made big changes when
they went to v6. odd they wouldn’t
use that version.
(according to the footnote the switch to v6 was made when the paper was in peer review)…
“RSS is also in better agreement with the surface data trends “
Of course it is.. That was the whole aim of the “adjustments”.. DOH !!!

If I read Zeke’s comment about RSS 4.0 when it was announced, they now replace some of the data with either model results or surface data. In either case it is no longer pure satellite data. UAH is the only satellite data set.
uah’s data is itself a model.
the satellites they use are not measuring
temperatures.
they are measuring microwave insensities
and using a model to convert them to
temperatures. after adjusting for all
kinds of biases….
Again crackpot shows his ignorance of suppository models ie climate models, based on imaginary assumptions….
and engineering models based on known physics of satellite motion.
You really do not have the slightest clue about anything, do you crackpot. !
All measurements of temperatures are based on models, crackers. Are you telling me you didn’t know that? LOL.
I think they forgot about all the heat that hides deep in the ocean. Trenberth’s revenge!
“Using satellite instruments to collect temperature data from the bulk atmosphere is a better and more robust tool for detecting the addition of energy related to extra greenhouse gases in the atmosphere, Christy said.”
Inconvenient fact – this article says the warming rate based on V6 was 0.09°C/decade. But UAH V5.6 TLT, which they still publish, says it was 0.16°C/decade. Not so robust. RSS TLT V4 says 0.15.
Nick,
The .09C/decade value was based on a data set where natural events such as volcanoes and ENSO warming/cooling have been removed. I’m guessing you didn’t really read the paper.
Yeah, Paul, substitute .13C for Nick’s .09C…
what’s the trend
with rss’s data?
why is everyone
here ignoring
them?
I think they are just ignoring trolls with the I type like a “special needs patient” meme …[pruned]
(it’s not inconceivable that he is a special needs patient)…
Trends in RSS..
1980-1997
2001 – 2015.
http://www.drroyspencer.com/wp-content/uploads/RSSv4-vs-UAH-MT-original-series.jpg
That’s reasonably close to what I get from the surface stations, it just starts at a climatic low, so of course it’s gone up, just from shifting waters.
That doesn’t mean it’s linear, it’s just the rising edge of a cycle!
“it’s just the rising edge of a cycle!”
Caused by what?
“Caused by what?”
The same things that caused all variations before, when any human influence is ruled out.
It is up to CAGW crowd to calculate them right (or at least have some reasonable estimate), then subtract them from actual temperature, and the difference will be human influence. Not the other way round.
Nobody can calculate those natural variation? Indeed. So the whole CAGW meme is unscientific, as of now. Just hope it will turn scientific some day, as alchemy turned into chemistry.
paqyfelyc commented – “The same things that caused all variations before, when any human influence is ruled out.”
what are they?
which of them explains
today’s GW?
“It is up to CAGW crowd to calculate them right (or at least have some reasonable estimate), then subtract them from actual temperature, and the difference will be human influence.”
this has been done many many times.
it makes no difference to
people like
you
http://www.bloomberg.com/graphics/2015-whats-warming-the-world/
“what are they” ? it is up to “climate scientist” to calculate them.
And, as i said, they are unable to do that. For very good mathematical reasons, exposed by Lorenz himself decades ago, that no one challenged .
this has been exposed many many times.
it makes no difference to
people like
you
people that dare use Bloomberg as a scientific source, and afterward talk about “big money” behind WUWT, and don’t even see the irony… Seriously…
Yes, Nick, that looks to be a problem. (christy’s claim brings to mind the ol’ saying, “very important… if true!” ) v5.6 clearly had a couple problems. v6, in the same way, may have problems which have yet to come to light. Hopefully we’ll have data soon which has all the data sets going in one direction or another. Clear warming or clear cooling. (at that point maybe we’ll actually learn something)…
“Clear warming or clear cooling.”
huh? there is no doubt of the
warming. what are you
talking about?
(aka “the pause”)…
In both RSS and UAH, a zero trend has existed for 33 of the 39 years.
The ONLY warming has come from EL Nino events, particularly the step change at the 1998-2001 El Nino
Here the two graphs above are combined, minus the El Nino spike

The step change is clearly evident.
crackers resorts to comedy animations..
PATHETIC. !!
Imagine the squawking if that graph actually trended down.
tony – the error would be the same no matter what
the sign of the trend
two EMPTY clowns.
playing pitty-pap with each other.
Cute.. in a sickening kind of way.
Still nailed to your perch I see, Mc Cold.
RSS (Mears): the troposphere has not warmed quite as fast as most climate models predict
http://www.remss.com/research/climate/
And our own Ben Santer proved that the observed warming is natural from at least 1993:

John Bills commented – “And our own Ben Santer proved that the observed warming is natural from at least 1993:”
rubbish. pure rubbish.
your last graph shows
just the opposite, about
0.3 C warming
from 2000-2015. and more
since ’15.
Sorry crackers, the graph does not show any warming. You are looking at a line which represents models. There is no trend line, however, it is easy to see the trend is not distinguishable from zero.
Initial radiametric calculations came up with a climate sensivity of CO2, not including any feedbacks of 1.2 degrees C. One researcher has pointed out that these initial calculations fail to take into consideration that the doubling of CO2 in the troposphere will cause a slight but very significant decrease in the dry lapse rate in the troposphere effectively decreasing the climate sensivity of CO2 by more than a factor of 20 yielding a climate sensivity of CO2, not including feedbacks, of less than .06 degrees C.
The IPCC likes to use numbers like 3 for the amplification of CO2 based warming caused by H2O. The theory is that CO2 warming will cause more H2O to enter the atmosphere which will cause even more warming because H2O is an even stonger absorber of IR than is CO2. However what has been ignored is the fact that H2O is a major coolant in the Earth’s atmoshere transfering heat energy from the Earth’s surface to where clouds form via that heat of vaporiation. According to some energy balance models, more heat energy is moved by H2O via the heat of vaporization then by both convection and LWIR absorption band radiation combined. The net cooling effects of H2O are exemplified by the fact that the wet lapse rate is significantly lower than the dry lapse rate. So instead of applying an amplification of 3 a better amplification factor to apply would be 1/3, yielding a climate sensifity of CO2 of less than .02 degrees C which is a rather trivial amount.
Include the observation that a radiametric greenhosue effect has not been observed anywhere in the solar system will drive one to the concludion that the climate sensivitry of CO2 is effectively zero. The radiametric greenhouse efect is science fiction so hence the AGW conjecture is science fiction.
Good paper. I have two issues though.
1. They have not included the sun’s activity. The magnitude of the effect of the sun’s activity, as characterized by the sun spot number) is similar to that of ENSO, as they have characterized it.
2. The effect of ENSO is not linear. In this paper, they have correlated the temperatures to the immediate effect of ENSO. However there is a secondary, long term, effect that is even more important. This effect can be seen by putting the ENSO numbers through an exponentially weighted moving average (EWMA) filter.
EWMA (ENSO) at (time T) = EWMA (ENSO) at (time T-1) * (1-λ) + ENSO at (time T)*λ
For λ of about 0.01 the correlation is highly significant. In fact if this would be done, it would likely account for the entire increase in temperature over the time period.
Note that ENSO was very much below normal in the 1950s through the 1970s, and has been above normal since.
“The magnitude of the effect of the sun’s activity, as characterized by the sun spot number) is similar to that of ENSO, as they have characterized it.”
but there hasn’t
been an increase in
sunspot number for
50+ years.
in fact, there’s been a
decreasing trend:
http://sunspotwatch.com/share/201407_wolfmms.jpg
The last 50 years has had the highest average sunspot count for a long time.
So much so that real solar scientists called it a Grand Solar Maximum.
You seem to be trying to wear people down with your stupidity and ignorance.
Even a blind monkey could see that surge in sunspots during the latter half of last century
But you choose to remain blinkered and naïve.
mkelly; Many thanks for your reply to my comment. I will certainly look at further into the work of Hottel and Leckner.I have used data from Staley, D.O., and Jaluria,G.M., “Effective atmospheric emissivity under clear skies” J.Applied Meteorology,v.11,349-356,March 1972.” to estimate an increase in sky emissivity of 0.006 (0.7%) for an increase in CO2 in the atmosphere from 300 to 400 ppm, and corresponding increase in back radiation of about 2W/m^2–in line with measurements of ocean energy content increase.
To quote my hero, Prof. Richard Lindzen:
“We see that all the models are characterized by positive feedback factors (associated with amplifying the effect of changes in CO2), while the satellite data implies that the feedback should be negative. Similar results are being obtained by Roy Spencer.
This is not simply a technical matter. Without positive feedbacks, doubling CO2 only produces 1C warming. Only with positive feedbacks from water vapor and clouds does one get the large warmings that are associated with alarm. What the satellite data seems to show is that these positive feedbacks are model artifacts.”
“Discussion of other progress in science can also be discussed if there is any interest. Our recent work on the early faint sun may prove particularly important. 2.5 billion years ago, when the sun was 20% less bright (compared to the 2% change in the radiative budget associated with doubling CO2), evidence suggests that the oceans were unfrozen and the temperature was not very different from today’s. No greenhouse gas solution has worked, but a negative cloud feedback does.
You now have some idea of why I think that there won’t be much warming due to CO2, and without significant global warming, it is impossible to tie catastrophes to such warming. Even with significant warming it would have been extremely difficult to make this connection.”
Testimony: House Subcommittee on Science and Technology hearing on A Rational Discussion of Climate Change: the Science, the Evidence, the Response
November 17, 2010
Never forget, AGW is all about positive feedbacks. Fight them there! Because that is its Achilles’ heel.
“You now have some idea of why I think that there won’t be much warming due to CO2, and without significant global warming, it is impossible to tie catastrophes to such warming. Even with significant warming it would have been extremely difficult to make this connection.”
Keep this in mind the next time you hear some dope claim that some weather event is caused by human-produced CO2.
why is Lindzen the last and
only word on climate science?
because you like what he says?
Why the empty post , crackpot.
present something if you have anything.
“The notion of a static, unchanging climate is foreign to the history of the earth or any other planet with a fluid envelope. The fact that the developed world went into hysterics over changes in global mean temperature anomaly of a few tenths of a degree will astound future generations. Such hysteria simply represents the scientific illiteracy of much of the public, the susceptibility of the public to the substitution of repetition for truth, and the exploitation of these weaknesses by politicians, environmental promoters, and, after 20 years of media drum beating, many others as well. Climate is always changing.” Quote from Prof. Lindzen.
That’s why.
Prof. Lindzen is a true scientist. You are just an alarmist and a living example of the illiteracy and susceptibility that he mentions in this quote.
Any more questions?
why is Lindzen a
“true scientist” and
hundred of
thousands of other
scientists aren’t?
Because he knows the field extremely well and is a very succesfull scientist and professor.
“According to the UN’s Intergovernmental Panel on Climate Change, the greenhouse forcing from man made greenhouse gases is already about 86% of what one expects from a doubling of CO2 (with about half coming from methane, nitrous oxide, freons and ozone), and alarming predictions depend on models for which the sensitivity to a doubling for CO2 is greater than 2C which implies that we should already have seen much more warming than we have seen thus far, even if all the warming we have seen so far were due to man.”
Still more questions from Soros?
It could argued the “The notion of a static, unchanging climate” is a bit of a straw man. Who thinks that?
Isn’t it universally accepted that the climate is a non-linear dynamical system? I think that was universally accepted back in 2009 when he penned that op-ed piece.
@tony mcleod:
Very brave of you to attack the opening line of a paper.
And for your information, we have been presented the notion that man is responsible for the 20th centruy warming, so an unchanging climate must have been the default position. Right?
Now try to debunk the second sentence:
“The fact that the developed world went into hysterics over changes in global mean temperature anomaly of a few tenths of a degree will astound future generations.”
Guess you can’t.
universally accepted that the climate is a non-linear dynamical system
Then why do the child-minds like you, crackpot and the rest of your AGW trollups insist on putting monkey-like linear trends across obvious “event” changes that have nothing to do with human CO2.
Because its the ONLY way you can show there is any warming trend… that is why
Outside those El Nino “events’ (NON-LINEAR)…… there is NO WARMING
I’m very glad that you are finally starting to wake up to REALITY McClod.
Stay awake, stay of the mind-numbing addiction of klimate kool-aide…..
….. and don’t slip backward into the slime of the AGW agenda.
Scarface
“And for your information, we have been presented the notion that man is responsible for the 20th centruy warming, so an unchanging climate must have been the default position. Right?”
No, why? Who thinks that.
““Debunk…
The fact that the developed world went into hysterics over changes in global mean temperature anomaly of a few tenths of a degree will astound future generations.”
Guess you can’t.”
Debunk something with the word hysterics in it?
“The rate at which Earth’s atmosphere is warming has not significantly accelerated over the past 23 years”
Hmm. In other words: the rate at which Earth’s atmosphere is warming has accelerated over the past 23 years. So bad news right?
[?? .mod]
Last 23 years.. just the two El Ninos.
No other warming.
Only a trend if you use either or both El Ninos..
which are NOTHING to do with human CO2 or human ANYTHING.
The “good news” is the acceleration is not great. The elephant in the room is that warming has accelerated.
Tony McLeod,appears determined to try fogging up the thread with an unsupported claim,a lie probably since Andy TWICE using charts shows ZERO warming outside of El-Nino events,
From the article you didn’t read:
“The unadjusted climate trend in the deep troposphere from January 1979 to June 2017 was +0.155 C (about 0.279° F) per decade.¹ After adjusting for the volcanoes and other less significant effects, including the Atlantic multi-decadal oscillation and the Pacific decadal oscillation, the trend drops to 0.096 C per decade — or about 0.364 C (0.66° F) total since December 1978.”
The IPCC report says a .30C per decade warming is projected based on emission scenarios. Yet the Satellite data shows only about .15C per decade warming since 1979.
You are as usual full of baloney.
the top 0.7 km of the
ocean shows a clear
acceleration in OHC.
Crackers comes along in a dumb defense of a Tony lie, by trying to shift it to ocean waters,with his unsubstantiated claim.
You like Tony, are here to make nebulous claims then flit away. You are boring me.
“the top 0.7 km of the
ocean shows a clear
acceleration in OHC.”
BS, based on gullibility…..as usual.!
Show us where ocean were measured before 2003.
There is absolutely NO WAY anything before 2003 could be calculated.. data is way too sparse for any sort of accuracy, especially to the TINY amounts they talk about.
Its based on modelled suppositories.
And the first bit of the ARGO data showed COOLING until Josh got his weedy little hands on it.

“The elephant in the room is that warming has accelerated.”
Again, a load of total BS.. based only on the recent El Nino.
Keep letting your ignorance shine through, McClod. !!
http://www.bom.gov.au/climate/enso/
“All international climate models suggest further cooling of the tropical Pacific is likely.
All models reach La Niña thresholds in December 2017”
And a big La Nina spike forming (28th Nov)

Ignore me, just go by John Anthony say:
“If you take away the transient cooling in 1983 and 1992 caused by two major volcanic eruptions in the preceding years, the remaining underlying warming trend in the bottom eight kilometers (almost five miles) of the atmosphere was 0.096 C (about 0.17° Fahrenheit) per decade between January 1979 and June 2017.
That was unexpectedly close to the 0.09 C warming trend found when similar research was published in 1994 with only 15 years of data, said Dr. John Christy, director of UAH’s Earth System Science Center.”
The rate was 0.9, now it’s 0.96.
Anthony Watts: “Accelerating.”
crackhead shows his inability to read.
Its a MODEL.. assumption driven.
And it represents an immeasurable amount of temperature…. do you even know how much?
Show us where the data for pre-2003 came from for that MODEL of OHC.
There was little to NO DATA.. Phil Jones said most of the surface data was just “made-up”
FABRICATED.
Repeat after me…. (in a vain attempt to educate you.)
Basically No Data.. assumption driven model..
Do
You
Under-
stand !!
Do
You
Under-
stand !!
..that I am just repeating what Dr. John Christy and Anthony Watts said. Parrot your mindless squawking at them.
The atmosphere sensitivity to CO2 = 0 with uncertainty bonds of +/- 0.0
SIMILAR CONCLUSIONS ARE POSTED HERE FROM EARLIER THIS YEAR AND LAST YEAR.
I BELIEVE THE MINOR TEMPERATURE CHANGES EXPERIENCED SINCE THE LAUNCHING OF THE SATELLITES IN 1979 ARE LARGELY NATURAL AND FOLLOW THE INTEGRAL OF SOLAR ACTIVITY. THIS SUGGESTS THAT CLIMATE SENSITIVITY TO ATMOSPHERIC CO2 IS NO MORE THAN 1C/2xCO2, AND PROBABLY LESS, NEAR-ZERO.
IN ANY CASE, EVEN AT A CLIMATE SENSITIVITY OF 1C THERE IS NO REAL GLOBAL WARMING CRISIS. TOLD YA SO, 15 YEARS AGO. 🙂
ALSO, IF I AM CORRECT, MODERATE GLOBAL COOLING WILL PROBABLY START BY 2020-2030 – AS I ALSO PUBLISHED IN 2002. I AM NOW LEANING TOWARDS GLOBAL COOLING STARTING CLOSER TO 2020, AND POSSIBLY AS EARLY AS 2018.
I HOPE TO BE WRONG ABOUT ANY GLOBAL COOLING – COLD KILLS.
REGARDS, ALLAN
https://wattsupwiththat.com/2016/10/14/the-divergence-between-surface-and-lower-troposphere-global-temperature-datasets-and-its-implications/comment-page-1/#comment-2320319
UPDATED HERE:
https://wattsupwiththat.com/2017/09/20/from-the-the-stupid-it-burns-department-science-denial-not-limited-to-political-right/comment-page-1/#comment-2616345
NOT A WHOLE LOTTA GLOBAL WARMING GOIN’ ON!
Unlike the deeply flawed computer climate models cited by the IPCC, Bill Illis has created a temperature model that actually works in the short-term (multi-decades). It shows global temperatures correlate primarily with NIno3.4 area temperatures – an area of the Pacific Ocean that is about 1% of global surface area. There are only four input parameters, with Nino3.4 being the most influential. CO2 has almost no influence. So what drives the Nino3.4 temperatures? Short term, the ENSO. Longer term, probably the integral of solar activity – see Dan Pangburn’s work.
Bill’s post is here.
https://wattsupwiththat.com/2016/09/23/lewandowsky-and-cook-deniers-cannot-provide-a-coherent-alternate-worldview/comment-page-1/#comment-2306066
Bill’s equation is:
Tropics Troposphere Temp = 0.288 * Nino 3.4 Index (of 3 months previous) + 0.499 * AMO Index + -3.22 * Aerosol Optical Depth volcano Index + 0.07 Constant + 0.4395*Ln(CO2) – 2.59 CO2 constant
Bill’s graph is here – since 1958, not a whole lotta global warming goin’ on!
My simpler equation using only the Nino3.4 Index Anomaly is:
UAHLTcalc Global (Anom. in degC, ~four months later) = 0.20*Nino3.4IndexAnom + 0.15
Data: Nino3.4IndexAnom is at: http://www.cpc.ncep.noaa.gov/data/indices/sstoi.indices
It shows that much or all of the apparent warming since ~1982 is a natural recovery from the cooling impact of two major volcanoes – El Chichon and Pinatubo.
Here is the plot of my equation:
https://www.facebook.com/photo.php?fbid=1106756229401938&set=a.1012901982120697.1073741826.100002027142240&type=3&theater
I added the Sato Global Mean Optical Depth Index (h/t Bill Illis) to compensate for the cooling impact of major volcanoes, so the equation changes to:
UAHLTcalc Global (Anom. in degC) = 0.20*Nino3.4IndexAnom (four months earlier) + 0.15 – 8*SatoGlobalMeanOpticalDepthIndex
The “Sato Index” is factored by about -8 and here is the result – the Orange calculated global temperature line follows the Red actual UAH global LT temperature line reasonably well, with one brief deviation at the time of the Pinatubo eruption.
Here is the plot of my new equation, with the “Sato” index:
https://www.facebook.com/photo.php?fbid=1443923555685202&set=a.1012901982120697.1073741826.100002027142240&type=3&theater
I agree with Bill’s conclusion that
THE IMPACT OF INCREASING ATMOSPHERIC CO2 ON GLOBAL TEMPERATURE IS SO CLOSE TO ZERO AS TO BE MATERIALLY INSIGNIFICANT.
Regards, Allan
Alan wrote – “It shows that much or all of the apparent warming since ~1982 is a natural recovery from the cooling impact of two major volcanoes – El Chichon and Pinatubo”
what exactly do you mean by “recovery?”
volcanic emissions reflect sunlight. that sunlight
didn’t get into the earth’s
climate system – it
goes to
space.
so there wasn’t heat hiding somewhere waiting
for the volcanic emissions to
dissipate, when it then
came out and said hello.
so i don’t
know what “recovery”
means. do you?
Another dumb comment from boring crackers who plays his little word games.
“so i don’t know ”
Just leave it at that.
You just DO NOT KNOW… anything.
Mindless bluster is all you even manage.
The REAL Recovery is the 1ºC or so warming out of the COLDEST period in 10,000 years.
Be VERY thankful for that small amount of warming. Means your fossil fuel heating bill is less in winter.
And be VERY thankful for the enhanced atmospheric CO2, providing the biosphere with much needed fundamental building blocks.
Also be very thankful of the 1600 or so coal fired power stations being built around the world.
There will be PLENTY of extra CO2 for the world’s plant life for a long time to come :-).
And all your mindless yapping can do absolutely NOTHING about it. 🙂
sunset – do you have
a substantive reply to
my science?
i thought this blog didn’t
tolerate ad homs. i sure
do see a lot of them….
sunset – do volcanic emissions
reflect sunlight (heat) back to
space? yes or no?
You have produce ZERO science. Just a silly little brain fart. !
And stop whimpering like a little child !! Its sickening.
Recovery just means a return to natural processes. If someone gets locked in a freezer and ‘recovers’ from hypothermia after being rescued, nobody is claiming that their body temperature rose due to hiding heat that popped out to say hello.
Mark – and how
does this “recovery” take
place, if, in the case of
volcanic cooling, the heat
has already left the planet?
where does the new extra
heat come from?
Mark commented – “If someone gets locked in a freezer and ‘recovers’ from hypothermia after being rescued, nobody is claiming that their body temperature rose due to hiding heat that popped out to say hello.”
that’s a bad
analogy, because in the
freezer case the temperature
outside the freezer is constant.
Stil the mindless empty posts.
Come on crackhead.. even you can do better than empty papa and mindless comic graphs… or not !!
Crackers, once the temporary factor is removed, the temperature goes back to where it was. That’s a recovery in both cases. No hidden heat required.
Oh there’s delayed heat storage in the oceans, but you’re 100% right, once the support (water vapor) goes away, temps drop like a rock.
The changes in Co2 doesn’t matter in this.
If all the water condensed out, it would matter, and we’d be doing everything we can to make more of it.
But we’re not getting rid of the water, and it’s not because of co2, it’s the Sun.
Mark commented –
“Crackers, once the temporary factor is removed, the temperature goes back to where it was.”
except
many try to claim that
modern warming
is a “recovery” from
the LIA.
It isn’t.
there is new heat
into the
earth system.
“there is new heat
into the
earth system.”
Yes, the sun is much more active than during the LIA, especially during the latter half of last century.
Still waiting for empirical proof that CO2 causes warming in a convective atmosphere.
Still.. crackpot remains EMPTY.
AndyG55 commented – “till waiting for empirical proof that CO2 causes warming in a convective atmosphere.”
Manabe & Wetherald J Atm Sci 1967
http://ruby.fgcu.edu/courses/twimberley/EnviroPhilo/ThermalEqu.pdf
Allan,
You have a remarkable ability to forget your past ‘misses’ when it comes to predictions of global cooling. For instance in September 2008, ICECAP published a piece of yours in which, due to a (then) cooling trend starting Jan 2007, you rhetorically ask “Are we seeing the beginning of a natural cooling cycle?” Your answer is an emphatic ” YES” (your emphasis). You also stated back then that, starting January 2007, “… we can expect several decades of naturally-caused global cooling.” http://icecap.us/index.php/go/joes-blog/is_this_the_beginning_of_global_cooling/
Here we are almost 11 years later and, according to UAH v6, about 0.4 C warmer! Even if we generously leave off the El Nino influenced warming that started around mid 2015, i.e. if we only count monthly temperatures from Jan 2007 to June 2015, there is ‘still’ a warming trend in UAH v6 (~0.14 C/dec). That period includes the 2010/11 ‘double-dip’ La Nina. All the other data sets, including RSS TLT, show even more warming than UAH since 2007.
On the bases that a broken clock is right twice a day, I guess we have to say it’s possible that you’ll be right about global cooling this time around. However, if I were you I wouldn’t put too much money on it.
DWR54 (aka WD40, the slippery one):
The previous natural global cooling period occurred from ~1940-1975, even as fossil fuel consumption strongly accelerated. That fact is sufficient to prove that the sensitivity of climate to increasing atmospheric CO2 is very low, equal to or less than ~1C. There is no real global warming crisis, as we published in 2002:
“Climate science does not support the theory of catastrophic human-made global warming – the alleged warming crisis does not exist.”
Reference:
PEGG, reprinted in edited form at their request by several other professional journals , The Globe and Mail and La Presse in translation, by Baliunas, Patterson and MacRae.
http://www.apega.ca/members/publications/peggs/WEB11_02/kyoto_pt.htm
http://www.friendsofscience.org/assets/documents/KyotoAPEGA2002REV1.pdf
Note that alarm about this previous real global cooling period was only raised circa 1975, ironically when that ~35-year cooling period was about to naturally reverse, in the Great Climate Shift of ~1976.
It will probably take several decades of global cooling data before there is a consensus on when the next natural global cooling period actually started.
There are posts here on wattsup by credible parties that state that natural global cooling started circa 2003.
We will just have to wait and see what nature tells us. I do hope to be wrong about imminent moderate global cooling – cold kills – that is incontrovertible.
Reference:
“Cold Weather Kills 20 Times as Many People as Hot Weather”, September 4, 2015
by Joseph D’Aleo and Allan MacRae
https://friendsofsciencecalgary.files.wordpress.com/2015/09/cold-weather-kills-macrae-daleo-4sept2015-final.pdf
Question for you:
When have your warmist friends actually made a correct prediction? The correct answer is NEVER. Every one of the warmists’ very-scary predictions about catastrophic global warming, wilder weather, etc. has proven false to date. The warmists and the IPCC have a perfect negative predictive track record, and hence perfectly negative credibility. The heat is not “hiding in the ocean”, nor is it hiding “up their butts”.
It is time for the warmist mob to fold their tent on their global warming sc@m (aka “climate change”), the greatest fr@ud in dollar terms in human history.
********************
Allan,
The best estimate trend in global temperatures since 2003 is between 0.16 and 0.19 C/dec warming in the satellite data sets. In the surface data sets it’s between 0.18 and 0.23 C/dec and statistically significant in all cases. What sort of natural long term cooling trend starts off with 15 years of statistically significant surface warming and continued best estimate warming in the atmosphere?
You do like those rhetorical question Allan; but if you permit me an answer also, then I would say that by simply projecting further warming (as opposed to cooling) from 2007 onward, the IPCC (AR4) has the advantage over your own 2007 prediction. Getting the direction of travel correct at least is a step in the right direction, would you not agree?
You’re right that they may have gotten it wrong in one sense though. IPCC AR4 (2007) stated that “For the next two decades, a warming of about 0.2°C per decade is projected for a range of SRES emission scenarios.” [Page 12]: https://www.ipcc.ch/pdf/assessment-report/ar4/wg1/ar4-wg1-spm.pdf
As of October 2017, almost 11 years on from that projection, all the surface and satellite data sets show warming trends far in excess of 0.2 C/dec since Jan 2007. It’s been nearly double that according to UAH (0.38 C/dec). Obviously that is influenced by the 2015/16 El Nino, but it’s fair to say that unless things cool off slightly over the next decade then the IPCC’s projection of ~ 0.2 C/dec warming for 2 decades starting 2007 would represent another ‘failed prediction’.
Taking a linear trend from a cycle is going to give you junk.
Temps just followed to ocean cycles, since the hemisphere’s do not have equal land masses, the same warm water in the southern hemisphere causes a larger temperature response when it moves to the northern hemisphere than it had in the southern. What happened at the end of the 1999 el nino was the AMO went positive, that was the cause of the step in 2000.
This is the measured temps from the Air Forces temp data set
Min T just follows dew point, which follows the ocean. Max T follows min T, and water vapor during cooling at night regulate the amount of energy released late, when it slows and stops surface temps from falling till sunrise.
Since water vapor regulates the final temp based on the change in temp, in reference to dew point (it’s like an Op Amp Comparitor), so it doesn’t slow cooling until after it’s already released most of the heat from the prior day, including any excess from co2. If co2 makes it a little warmer, it just cools a little bit longer, cools that excess, then slows cooling. Co2 has less than 0.5C Climate Sensitivity, and compared to actual measurements, it’s 0.0004C/W insolation/m^2 . Ouch!
Allan (and the other global cooling alarmists here), it has been getting warmer and despite the Grand Solar minimum this and the plunging PDO cycle that it’s going to continue warming at least until human CO2 emissions plateau, maybe longer if we’ve significantly disturbed natural sources of carbon. In terms of your lifetime – think of it as forever.
ALLAN commented – “The previous natural global cooling period occurred from ~1940-1975”
what was natural
about it?
Allan, in 2008 you wrote “Are we seeing the beginning of a natural cooling cycle? YES. Further cooling, with upward and downward variability, is expected because the Pacific Decadal Oscillation (PDO) has returned to its cool phase, as announced by NASA this year.”
http://icecap.us/index.php/go/joes-blog/is_this_the_beginning_of_global_cooling/
that cooling didn’t happen.
you were wrong. Just wrong.
in what way has this made you
reevaluate your ideas
and conclusions?
Wow, it is hilarious reading the silly comments of the trolls who think building a trend with two La Nina years at the start is somehow an intelligent thing to do. Of course it will show warming over a single decade.
It’s easy to play games. The anomaly for January 2017 was .43. Now it is at .36. Obviously Allan was right. It has cooled.
“who think building a trend with two La Nina years at the start is somehow an intelligent thing to do”
The forecast was made in 2007. It predicted cooling. So they checked. It has been warming since then. How else do you check a forecast?
As to La Nina, the original forecast said
“Since just January 2007, the world has cooled so much that ALL the global warming over the past three decades has disappeared!”
Now that is building a trend! Seemed fairly insouciant about La Nina.
Allan,
Apply volcanic and ENSO corrections to the models also (same formula) and I guess there would be very little warming in the satellite era. (You can do it quick and dirty with the model average only).
You see, the model average trend in Nino 3.4 SST is around 0.20C/decade, whereas that of real world is almost flat.
This study by Christy & friends seems quite silly, adjusting observations but not models,
a classical apples to oranges comparison fallacy…
Crackers
The moderator told me to be nice to you as you were supposedly adding something to the debate .
So here goes .The climate has warmed and cooled for millions of years on this rock traveling at a tremendous pace around the sun .Only 12000 years ago ,a blink of an eye in time the world warmed and the ice retreated from the continents in the northern hemisphere..This was an entirely natural event no human input .
The climate warmed up and humans started working their way towards civilization .It is a proven fact that the climate in the northern hemisphere has been warmer or at least as warm as it is at present three times since the Ice retreated .
Natural warming natural cooling .
What John Christy is stating here is that there is no tool or technique to establish whether the warming is man made or natural
The warmist scientists believe that it is mainly man made by C02 and other gasses .
This is a theory which has not been proven but it has been seized on by activist scientists and the political left .
Co2 may warm the world by .6 of a degree Celceus
While working or playing outside I’m still looking for those “Heat Trapping Clouds”.
O R wrote:
“This study by Christy & friends seems quite silly, adjusting observations but not models,”
Your statement is false – technically wrong – what you describe is actually the tactics of the warmist fr@udsters, not those of John Christy and colleagues. Tony Heller posted this sequence – all “global” surface temperatures – see the “inconvenient” global cooling of ~1940-1975 disappear?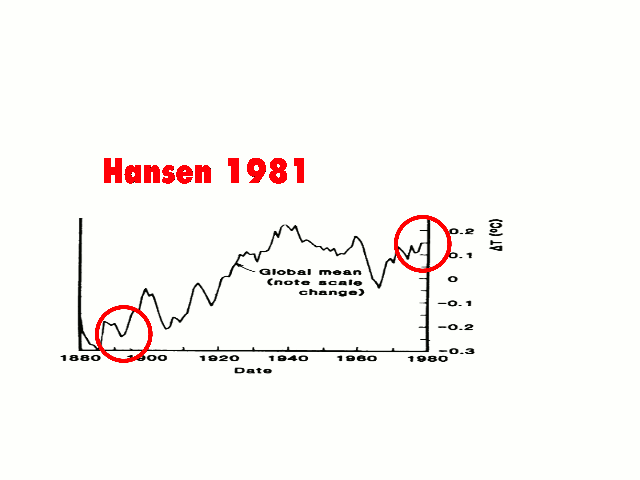
Your comment is “quite silly” and suggests that you are a warmist troll – or simply an imbecile.
Do you have any idea who Dr. John Christy is? He and Dr. Roy Spencer, received NASA’s medal for exceptional scientific achievement in 1991 for developing the original satellite method for precise monitoring of global temperatures from Earth-orbiting satellites. Christy and Spencer have unequaled credibility in the accurate measurement of global temperatures.
The original paper on this subject by Christy et al was published in 1994. I doubt that you have the intellect or the integrity to follow what is being said here, based on your utterly false and ignorant comment.
Also, consider posting under your own name, instead of “sniping from the bushes”, spreading false nonsense while you hide under a pseudonym.
Reference:
https://wattsupwiththat.com/2017/11/11/noaa-la-nina-is-officially-back/#comment-2663837
From: John Christy
Date: November 4, 2017 at 7:28:22 PM GMT+7
To: Allan MacRae
Cc: Anthony Watts, Roy Spencer, John Christy, Joe D’Aleo, Joe Bastardi
Subject: Re: Sorted – atmospheric cooling will resume soon
Allan
Yes. We’ve seen this correlation since our first paper about it in Nature back in 1994. The Pacific gave up a lot of heat between July and October – and some of it is making its way through the atmosphere. We think the anomalies will drop soon too.
John C.
Sent from my iPhone
On Nov 4, 2017, at 6:03 AM, Allan MacRae wrote:
FYI friends.
I was curious why the UAH LT was diverging above its predicted value based on the East Equatorial Upper Ocean Temperature Anomaly – I re-plotted the data vs UAH LT Tropics (instead of UAH LT Global) and the situation became more clear- atmospheric cooling will resume soon, imo.
Best, Allan
https://wattsupwiththat.com/2017/11/02/while-global-surface-temperature-cools-the-lower-troposphere-has-record-warmest-october/comment-page-1/#comment-2654147
Sorted – atmospheric cooling will resume soon. See the plot below of the UAH LT TROPICAL Anomaly vs the East Equatorial Upper Ocean Temperature Anomaly and the situation becomes more clear.
This is a typical pattern after major El Nino’s, in which atmospheric (LT) temperature diverges above the level predicted by the long term relationship with the East Equatorial Upper Ocean Temperature Anomaly. The pattern will converge again soon, and atmospheric cooling will resume. WHY this happens after major El Nino’s is still to be explained. Perhaps the El Nino heat in the atmosphere just needs time to dissipate.
• Allan M R MacRae
1994 paper by Christy and McNider:
https://wattsupwiththat.files.wordpress.com/2017/11/1994_christymcnider.pdf
[excerpt]
Sulphur compounds are often injected into the stra-
tosphere during volcanic eruptions and,
when in contact with water, may become
aerosol particles of sulphuric acid. These
aerosols can scatter sunlight back to
space, resulting in less solar energy
reaching the lower atmosphere and therefore
cooling it4
·
These same aerosols also
trap thermal energy coming from below,
leading to a warming of the stratospheric
air. The warming in the MSU stratospheric
temperature (MSU 4 or T4) after the
eruptions, then, can represent the magnitude
of the volcanic shading effect9
We found the temperature increases ( Ll T4) to
be 0.75 and 1.10 degrees C for El Chich6n and
Mount Pinatubo, respectively. We devised
a formula in which the Ll T4 predicts
the magnitude and duration of the T2R
cooling
T2R voL =ex jY exp ( -j/r),
where a=a0 (LlTS15
; j is months since
eruption; y=y0 ; and r=r0 (LlT4)05.
We selected the coefficients a0 , r0 and
yo (0.11, 9.0 and 1.20, respectively) to fit
the observations (curve c) of the volcanic
impact on T2R.
ALLAN MACRAE November 30, 2017 at 4:32 am “Perhaps the El Nino heat in the atmosphere just needs time to dissipate.”
WR: If that delay shows the time heat (energy) needs to dissipate, some calculations could be made about the time that the El Nino energy needs to disappear from the troposphere. This would give us information (facts) about the concrete functioning of the greenhouse effect.
There is also a season dependent temperature difference between the Northern Hemisphere and the Southern Hemisphere. This too (I think) will give possibilities to make calculations about the time delay between a certain surface temperature and the complete exit of that surface energy from the troposphere.
Did someone ever made those kind of calculations?
Yes i have.
And it doesn’t need time, it’s cools just fine every night.
But it would take time for the underlying warmer surface to cool.
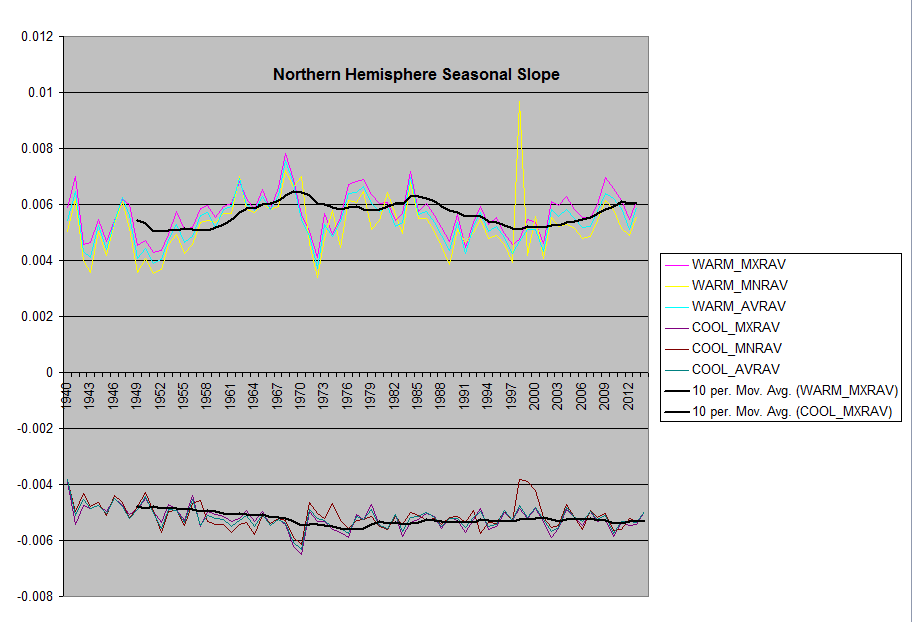
Here is the warming/cooling seasonal slope
SH
NH
Note that this 2017 paper ASSUMES “that the net impact of this decadal scale natural variability has been near zero since 1979 and that the underlying trend due to the net impact of human influences is +0.096 ± 0.012 K dec−1”, and STILL concludes that “the tropospheric transient climate response (TTCR) is 1.10 ± 0.26 K.”/(2xCO2).
This ~1.1K is a conservative (upper bound) estimate of TTCR, which suggests that there is NO REAL GLOBAL WARMING CRISIS, and that any warming due to increasing atmospheric CO2 will be minor – and either benign or beneficial to humanity and the environment.
This is similar to the conclusion that we reached in our article written in 2002:
“CLIMATE SCIENCE DOES NOT SUPPORT THE THEORY OF CATASTROPHIC HUMAN-MADE GLOBAL WARMING – THE ALLEGED WARMING CRISIS DOES NOT EXIST.”
Reference:
PEGG, reprinted in edited form at their request by several other professional journals , The Globe and Mail and La Presse in translation, by Baliunas, Patterson and MacRae.
http://www.apega.ca/members/publications/peggs/WEB11_02/kyoto_pt.htm
http://www.friendsofscience.org/assets/documents/KyotoAPEGA2002REV1.pdf
Reference – 2017 paper:
Asia-Pac. J. Atmos. Sci., 53(4), 511-518, 2017 pISSN 1976-7633 / eISSN 1976-7951
DOI:10.1007/s13143-017-0070-z
“Satellite Bulk Tropospheric Temperatures as a Metric for Climate Sensitivity”
John R. Christy and Richard T. McNider
Earth System Science Center, The University of Alabama in Huntsville, Alabama, USA
(Manuscript received 9 June 2017; accepted 14 September 2017)
© The Korean Meteorological Society and Springer 2017
https://wattsupwiththat.files.wordpress.com/2017/11/2017_christy_mcnider-1.pdf
[excerpts]
Abstract: We identify and remove the main natural perturbations
(e.g. volcanic activity, ENSOs) from the global mean lower
tropospheric temperatures (TLT) over January 1979 – June 2017 to
estimate the underlying, potentially human-forced trend. The unaltered
value is +0.155 K dec−1 while the adjusted trend is +0.096 K dec−1,
related primarily to the removal of volcanic cooling in the early part
of the record. This is essentially the same value we determined in
1994 (+0.09 K dec−1, Christy and McNider, 1994) using only 15
years of data. If the warming rate of +0.096 K dec−1 represents the
net TLT response to increasing greenhouse radiative forcings, this
implies that the TLT tropospheric transient climate response (ΔTLT at
the time CO2 doubles) is +1.10 ± 0.26 K which is about half of the
average of the IPCC AR5 climate models of 2.31 ± 0.20 K. Assuming
that the net remaining unknown internal and external natural forcing
over this period is near zero, the mismatch since 1979 between
observations and CMIP-5 model values suggests that excessive
sensitivity to enhanced radiative forcing in the models can be
appreciable. The tropical region is mainly responsible for this
discrepancy suggesting processes that are the likely sources of the
extra sensitivity are (a) the parameterized hydrology of the deep
atmosphere, (b) the parameterized heat-partitioning at the oceanatmosphere
interface and/or (c) unknown natural variations.
However, here we shall assume that the net
impact of this decadal scale natural variability has been near
zero since 1979 and that the underlying trend due to the net
impact of human influences is +0.096 ± 0.012 K dec−1, where
the error range represents the spread of the various simulations.
**************
We are not defending this rather bold assumption regarding
natural variability, but simply stating it as a basis for going
forward to derive climate sensitivity estimates, acknowledging
the strong dependence on this assumption to what follows.
***************
Conclusions
[excerpt]
The assessment of tropospheric climate sensitivity from the
calculation of the underlying trend above requires significant
assumptions. If we assume, among other things, that the
impact of the net of natural external and internal forcing
variations has not influenced the observed trend and that
anthropogenic forcing as depicted in the average of the IPCC
AR5 models is similar to that experienced by the Earth, then
observations suggest the tropospheric transient climate response
(TTCR) is 1.10 ± 0.26 K. This central estimate is likely less
than half that of the average of the 102 simulations of the
CMIP-5 RCP4.5 model runs also examined here (2.31 ± 0.20).
****************
micro6500 November 30, 2017 at 5:31 am
WR: Micro, thanks for the graphs, but I have got some problems in reading them well. What are the numbers on the Y axis? And what means for example MXRAV in the legend?
Wim, this should help explain them
https://micro6500blog.wordpress.com/2016/05/18/measuring-surface-climate-sensitivity/
But, the y axis is the slope of the change in temp for half a year.
So there’s slopes of Min Avg and Max temp as it warms, and as it cools.
OK Micro, thanks for the link!
Wim – please see the plot posted here:
https://wattsupwiththat.com/2017/11/02/while-global-surface-temperature-cools-the-lower-troposphere-has-record-warmest-october/comment-page-1/#comment-2654279
https://www.facebook.com/photo.php?fbid=1483830358361188&set=a.1012901982120697.1073741826.100002027142240&type=3
This is the plot of the UAH LT TROPICAL Anomaly vs the East Equatorial Upper Ocean Temperature Anomaly, lagged 6-months to show the ~5-month lag of UAH Tropical LT after the East Equatorial Upper Ocean Temperature Anomaly. UAH Global LT temperature follows UAH Tropical LT ~1 month later.
There is a typical pattern after major El Nino’s, in which atmospheric (LT) temperature diverges above the level predicted by the long term relationship between LT temperature and the East Equatorial Upper Ocean Temperature Anomaly. I suggest that the relationship will converge again soon, as atmospheric cooling resumes.
The temporary divergence is caused by the time it takes this excess heat to dissipate from the LT into the upper atmosphere and then into space.
Based on this generally-robust long-term relationship, I expect that within ~6 months, the UAH LT Global anomaly will decline to about 0.0C. I have no time to work on this further now, my apologies,
See also my related correspondence with John Christy, posted on this page.
micro – you are writing about something different, and probably irrelevant to my comment. Perhaps you realize that but many readers will not.
What temperatures you are referring to in your paper – surface or satellite? At what altitude? Source?
Your comment “And it doesn’t need time, it’s cools just fine every night.” is incorrect IF you are referring to my post.
Tropical and Global Lower Tropospheric (LT) temperatures lag Pacific Ocean East Equatorial temperatures (0-300m) by 5 and 6 months, respectively. as shown in my graphs and those of Bill Illis.
This correlation is robust, but tends to diverge after major El Nino’s and then re-converges after a number of months, as the excess LT heat takes time to dissipate to the upper atmosphere and thence to space.
The two main drivers of Tropical and Global LT temperatures are equatorial temperatures in the Pacific Ocean, moderated by major volcanoes. The heat is overwhelmingly contained in the oceans and atmospheric humidity and atmospheric LT temperatures simply follow. The details are described in my previous posts.
The two drivers of equatorial temperatures in the Pacific Ocean are (probably) the integral of solar activity (ref. Dan Pangburn), moderated by the El Nino Southern Oscillation .
For clarity, and in contrast to the IPCC position:
Increasing atmospheric CO2 may have a minor impact on global warming, but this impact is small, less than 1C/(2xCO2), which is probably beneficial to humanity and the environment and certainly not harmful.
surface 2m temps.
Source is gsod dataset, and nightly observations and measurements.
That lag you see, could be the delayed action of dew point reduction, but you can get 40°F drops in temp over night. But temps settle near dew point in the morning, and that’s because water store energy during the day, and releases it at night to limit min T.
This happens in hours, not months. Dew points are slower reacting, but not temps.
The change in slope in the middle of the night, is water vapor regulating cooling, prior to that, the high cooling rate, is the none water vapor affected rate(though it too is effected by absolute humidity).
micro wrote:
“surface 2m temps.
Source is gsod dataset, and nightly observations and measurements.”
As I expected, you are talking about something totally different from my post.
Your points may or may not be correct, but you are talking about Surface Temperatures (ST’s) at 0-2m elevation (from an unspecified data source) and I am referring to Lower Tropospheric (LT) Temperatures at up to ~10,000m.
I typically use UAH LT data because I believe it is more credible than the alternatives.
I am especially concerned with all the data manipulation of the ST data.
I can comment no further because I have not studied your points in detail.
If you’re interested follow my name. And I use the Air Forces daily summary.
Plus some other observations.
Oh, then your LT, is reacting to the more seasonal variation is absolute WV. Min T at the surface follows dew point, LT is the warmth of the surface heating the LT as the hear is leaving the planet, that where the delay is. That follows the delay day 2 day change average, also on my pages
Q1: isn’t cooling the trend going by the last million+ years?
Q2: treating the atmosphere as a static entity seems ‘odd’
Q3: Which is a better indicator of future predictions? C02 or Antarctic core samples or (other)
This new Christy paper continues to make the same basic error of the establishment scientists by ignoring the recent peak in the millennial cycle at about 2003/4 in the RSS data seen in Fig 4 in
https://climatesense-norpag.blogspot.com/2017/02/the-coming-cooling-usefully-accurate_17.html
Fig 4. RSS trends showing the millennial cycle temperature peak at about 2003 (14)
“Figure 4 illustrates the working hypothesis that for this RSS time series the peak of the Millennial cycle, a very important “golden spike”, can be designated at 2003.
The RSS cooling trend in Fig. 4 and the Hadcrut4gl cooling in Fig. 5 were truncated at 2015.3 and 2014.2, respectively, because it makes no sense to start or end the analysis of a time series in the middle of major ENSO events which create ephemeral deviations from the longer term trends. By the end of August 2016, the strong El Nino temperature anomaly had declined rapidly. The cooling trend is likely to be fully restored by the end of 2019.”
Here is an abstract of the paper:
Energy & Environment
sagepub.co.uk/journalsPermissions.nav
DOI: 10.1177/0958305X16686488
ABSTRACT
This paper argues that the methods used by the establishment climate science community are not fit for purpose and that a new forecasting paradigm should be adopted. Earth’s climate is the result of resonances and beats between various quasi-cyclic processes of varying wavelengths. It is not possible to forecast the future unless we have a good understanding of where the earth is in time in relation to the current phases of those different interacting natural quasi periodicities. Evidence is presented specifying the timing and amplitude of the natural 60+/- year and, more importantly, 1,000 year periodicities (observed emergent behaviors) that are so obvious in the temperature record. Data related to the solar climate driver is discussed and the solar cycle 22 low in the neutron count (high solar activity) in 1991 is identified as a solar activity millennial peak and correlated with the millennial peak -inversion point – in the UAH temperature trend in about 2003. The cyclic trends are projected forward and predict a probable general temperature decline in the coming decades and centuries. Estimates of the timing and amplitude of the coming cooling are made. If the real climate outcomes follow a trend which approaches the near term forecasts of this working hypothesis, the divergence between the IPCC forecasts and those projected by this paper will be so large by 2021 as to make the current, supposedly actionable, level of confidence in the IPCC forecasts untenable.”
And forecasts to 2100:
Fig. 12. Comparative Temperature Forecasts to 2100.
“Fig. 12 compares the IPCC forecast with the Akasofu (31) forecast (red harmonic) and with the simple and most reasonable working hypothesis of this paper (green line) that the “Golden Spike” temperature peak at about 2003 is the most recent peak in the millennial cycle. Akasofu forecasts a further temperature increase to 2100 to be 0.5°C ± 0.2C, rather than 4.0 C +/- 2.0C predicted by the IPCC. but this interpretation ignores the Millennial inflexion point at 2004. Fig. 12 shows that the well documented 60-year temperature cycle coincidentally also peaks at about 2003.Looking at the shorter 60+/- year wavelength modulation of the millennial trend, the most straightforward hypothesis is that the cooling trends from 2003 forward will simply be a mirror image of the recent rising trends. This is illustrated by the green curve in Fig. 12, which shows cooling until 2038, slight warming to 2073 and then cooling to the end of the century, by which time almost all of the 20th century warming will have been reversed. Easterbrook 2015 (32) based his 2100 forecasts on the warming/cooling, mainly PDO, cycles of the last century. These are similar to Akasofu’s because Easterbrook’s Fig 5 also fails to recognize the 2004 Millennial peak and inversion. Scaffetta’s 2000-2100 projected warming forecast (18) ranged between 0.3 C and 1.6 C which is significantly lower than the IPCC GCM ensemble mean projected warming of 1.1C to 4.1 C. The difference between Scaffetta’s paper and the current paper is that his Fig.30 B also ignores the Millennial temperature trend inversion here picked at 2003 and he allows for the possibility of a more significant anthropogenic CO2 warming contribution.”
Regarding climate sensitivity the paper says:
“The IPCC AR4 SPM report section 8.6 deals with forcing, feedbacks and climate sensitivity. It recognizes the shortcomings of the models. Section 8.6.4 concludes in paragraph 4 (4): “Moreover it is not yet clear which tests are critical for constraining the future projections, consequently a set of model metrics that might be used to narrow the range of plausible climate change feedbacks and climate sensitivity has yet to be developed”
What could be clearer? The IPCC itself said in 2007 that it doesn’t even know what metrics to put into the models to test their reliability. That is, it doesn’t know what future temperatures will be and therefore can’t calculate the climate sensitivity to CO2. This also begs a further question of what erroneous assumptions (e.g., that CO2 is the main climate driver) went into the “plausible” models to be tested any way. The IPCC itself has now recognized this uncertainty in estimating CS – the AR5 SPM says in Footnote 16 page 16 (5): “No best estimate for equilibrium climate sensitivity can now be given because of a lack of agreement on values across assessed lines of evidence and studies.” Paradoxically the claim is still made that the UNFCCC Agenda 21 actions can dial up a desired temperature by controlling CO2 levels. This is cognitive dissonance so extreme as to be irrational. There is no empirical evidence which requires that anthropogenic CO2 has any significant effect on global temperatures. “
This oversensitivity was written about in a paper from 1962 by Kaplan. Kaplan wrote that the numbers generated by Plass for CO2 sensitivity were 2-3X over stated. If you look at Gavin Schmidt’s list of papers that he approves, Plass is one of the early ones at the top of the list.
Kaplan used empirical data measurements by the USAF in their “upper atmospheric” research. Plass used models.
Thank you Dennis, Re your statement:
“Kaplan used empirical data measurements by the USAF in their “upper atmospheric” research. Plass used models.”
One of my co-authors, an accomplished senior meteorologist, recently said to me of the warmist camp:
“These people live in a Virtual World – they believe that their models are more credible than actual scientific observations.”
This, sadly, is the basis of the warmists’ belief that global warming is manmade and catastrophic. This belief system is so obviously false nonsense that nothing more needs to be said about it – it is a childish delusion that is utterly inconsistent with the scientific method.
To date, there is ample evidence that humanmade global warming, if it exists at all in significance, is benign and probably beneficial to humanity and the environment.
Regards, Allan
They’ve been proven wrong time and again. https://thinkprogress.org/scurvy-story-why-you-should-believe-97-of-climate-scientists-not-long-wrong-john-christy-2ad3ad1bec5f/
“flat-earther, flat-earther” say the people who invented, use and abuse of a flat-earth diagram of its energy budget. Oh the irony. Quite usual, actually, to project one’s one sin on the opponent.
Well, i surely would not trust such people. Apparently you do.
And again, I must point out that both sides here are tacitly accepting the proposition that CO2 causes global warming through the greenhouse effect. THIS HAS NEVER BEEN PROVEN BY HARD DATA ANALYSIS! The climate-related, peer-reviewed literature is astonishingly free of such studies, which means that the concept is purely theoretical. This is anything but scientific, and that needs to be pointed out to the rabid “warmist” community and to the world at large. ALL hypotheses and theories MUST be subject to hard-data studies that unequivocally show proof of concept. This has never happened in the case of the supposed CO2/warming link. I know of three such studies, based on hard data, that unequivocally disprove it. Why on Earth do we go on giving credence to this theory when there is nothing behind it?
No. Water vapor temperature regulates cooling at night, and has about 10 times as much forcing as co2 has to work with (if not a lot more), but it adjusts to temperature, so it just converts a little less water vapor to water, and temperatures will not measurably change.
Thank you1