Guest essay by Michel de Rougemont
Without questioning the observed global warming or the emissions to the atmosphere of infrared-absorbing gases, three central issues remain without properly quantified responses, without which no other climate policy than that of a gradual adaptation can be justified: the sensitivity of the climate to human contributions, the disadvantages and the benefits for mankind resulting from a generally warmer climate, and the foreseeable evolution of the climate in consequence of unpredictable changes in human activity. To date, no instrumental observations made in our climate system can disentangle anthropogenic effects and natural variations.
We are left with conjectures and other speculation, both in the recent past and for the future. For this, climatologists develop models with which they can test their hypotheses. But these models are obviously overheating.
To verify their validity, the climate changes must be hindcasted (rebuilt a posteriori). It is then possible to compare the model results with the observed reality. Here is an example of such reconstructions, made with 102 CMIP5 models (Coupled Model Intercomparison Project, round Nr 5) from different institutions around the world, compared with series of observations made by balloons and satellites between 1979 and 2016.

Over that period, the mid troposphere temperature over the tropics (just taken here as one example) rose at a rate of 0.11 °C per decade (between 0.07 and 0.17), meanwhile, according to these models, it should have risen at the rate of 2.7 °C per decade (between 0.12 and 0.46). This difference is statistically significant. Since 1998, the global warming of the lower troposphere is only 0.02 °C per decade; this current period is called a “pause”, may be because it is hoped that the temperature will soon get more animated.

Another view of the same data represents their frequency distribution.

It looks like that model outputs are “normally” distributed around a mean, but only two of them overlap with the observations, the nearest one being of Russian origin.
Discussion
It is unlikely that the observations are erroneous, even if the model-makers have the bad habit of speaking of “experiment” each time they run an “ensemble” of a model on their supercomputers, i.e. by performing several repetitions of a scenario with the same parameters while varying its initial conditions. Until proven otherwise, in vivo results shall prevail over those obtained in silico.
If various models are developed by competing teams, their results should not be expected to converge to an average. And if they did, then this mean should approach reality, a true value. The distribution observed and its sizeable inaccuracy indicate that these models may all be of the same nature, that their approximations of the climate system stem from similar methods and assumptions. There are only two extreme values, one of which (Russian-origin model) is hitting the target at a right place, thus deserving to be better understood. Is it a lucky occurrence, or that of deliberate considerations?
It is undeniable that, with two exceptions, these models overheat, by a factor of about 2.5. The explanations that are provided are not satisfactory because, too often, these results are examined with the help of other models. The only plausible explanation for this difference is that one or more systematic errors are committed that lead to an exaggeration, or amplify themselves as the model is running (by iteration alongside the time scale).
Yet, there are many possible causes of systematic errors. Erroneous interpretation of feedbacks (de Rougemont 2016), known phenomena that are computed only by approximation, the still too coarse modelling patterns tending to amplify instability (Bellprat and Doblas-Reyes 2016), known but not computable phenomena that cannot be considered, or are represented by very rudimentary black boxes, and all unknowns that remain so. Also, a systematic bias may result from the model calibration over a same recent reference period, and with the help of parameters singularly oriented to the emergence of greenhouse gases.
Another complicated but wrong explanation. Reader hang on!
Often, to explain observations in contradiction with the calculated projections, the anthropogenic part of the models will be eliminated from their algorithms (especially the effect of CO2), and computing runs will be made to ascertain what should have occurred without human influence during the period under consideration. As, for example, such a “return-to-Nature” model does not foresee a warming between 1979 and 2016, then the actual warming will be attributed at once to human activities (Santer et al. 2017). Such scientists even dare to talk about “evidence”. Human’s artefact including all his incompetencies, the model is then used as a reference: if the system does not respond as predicted by an “internally generated trend”, as calculated sui generis, any deviation from it will be deemed anthropogenic. This is a tautological way of doing: I am right because I am right. It is pervasive in scientific articles on the climate and in reviews, especially the fifth report of the IPCC. It shows probability distribution curves that are centred on an average of model results, like the blue bars in Figure 3 albeit more nicely Gaussian, without worrying about the accuracy of this average. It does not seem that climatologists, the activist ones of course, understand the demand for accuracy.
So, there is at least one certainty: that climate modelling is not [yet] adequate. Denying this, would be madness, only explicable by a collective hysteria of the apologists of the Causa Climatica. If it remained within the scientific community in search of an eluding truth, it would not be serious, quite the contrary. But when this goes into public policy, such as the Paris agreement and the commitments of its contracting parties, then it is more than very likely that the anticipated measures will be useless and that the huge resources to be involved will be wasted. It’s stupid and unfair.
Bibliography
Bellprat, Omar, and Francisco Doblas-Reyes. 2016. “Attribution of Extreme Weather and Climate Events Overestimated by Unreliable Climate Simulations.”
Geophysical Research Letters 43(5): 2158–64. http://doi.wiley.com/10.1002/2015GL067189.
de Rougemont, Michel. 2016. “Equilibrium Climate Sensitivity. An Estimate Based on a Simple Radiative Forcing and Feedback System.” : 1–8.
Santer, Benjamin D. et al. 2017. “Tropospheric Warming Over The Past Two Decades.”
Scientific Reports 7(1): 2336.
http://www.nature.com/articles/s41598-017-02520-7.
This article was published on the author’s blog: http://blog.mr-int.ch/?p=4303&lang=en
 About the author:
Michel de Rougemont, chemical engineer, Dr sc tech, is an independent consultant.
In his activities in fine chemicals and agriculture, he is confronted, without fearing them, to various environmental and safety challenges.
His book ‘Réarmer la raison’ is on sale at Amazon (in French only)
He maintains a blog blog.mr-int.ch, as well as a web site dedicated to the climate climate.mr.int.ch
E-mail: michel.de.rougemont@mr-int.ch
He has no conflict of interest in relation with the subject of this paper.
Why is it that, even though it is known and acknowledged by the IPCC that the climate is a coupled, non linear chaotic system that cannot be modelled, we insist n modelling it?
Trebla, because, IMO and that of many others, the IPCC, UN, etc are NOT interested primarily in science; rather, they are interested in propaganda — by any means they can get away with — which will enable them to establish a broad [global?] command and control governing institution … by which they may be able to direct the future of our planet and its inhabitants.
Because of this, it is to the best interest of these globalists that the majority of the population remain ignorant and deceived. This “practice”, except, perhaps for the scale, is nothing new; such has been attempted by some components of humanity, time and again, since the beginning of our human history.
Surprise, surprise: the new Secretary General of the UN is a socialist.
Exactly propaganda not science is the central objective of th IPCC. Similarly in the UK the BBC is not about unbiased reporting of the news but more about pushing left wing propaganda to secure a win by the Stalinist/Bolshevik Labour party at the next election.
U.S. Senate, Senator Sanders, Vermont, January 28, 2013
Re: Wind and Global Warming.
Read the full Statement:
https://www.sanders.senate.gov/newsroom/press-releases/statement-of-senator-bernie-sanders-on-climate-change-and-a-proposed-moratorium-on-wind-energy
This is one of the main reasons I suspect. And this is old:
An inconvenient truth: ‘Climate change industry’ now a $1.5 trillion global business
http://www.washingtontimes.com/news/2015/aug/11/climate-change-industry-now-15-trillion-global-bus/
Well I read the Guest’s first two sentences.
My command of the English language is not up to the task of understanding what those two sentences are saying.
I’m grateful to the author for not putting them in French, of which language I have essentially zero cognition.
G
Perhaps a good candidate for the Bullwer-Lytton Prize for English Literature.
G
merci pour la stupidité de la critique:
For kindergarten pupils: Warming takes place. Greenhouse gases are emitted. 3 central questions need quantified answers. Adaptation is the only strategy because these answers are not available..
You can (but you may not be able to) read the post in French here: http://blog.mr-int.ch/?p=4291
Trebla, the answer to your question is simple. In another article here at Wattsup, Tim Ball quotes H.L. Mencken
“The whole aim of practical politics is to keep the populace alarmed (and hence clamorous to be led to safety) by menacing it with an endless series of hobgoblins all of them imaginary.”
so the answer is that the models both create and provide logistics support to the hobgoblins.
The IPCC, like the EU are in the hobgoblin business. For the IPCC and its apparatchiks, ‘Hobgoblins R Us’
U.S. Senate, Senator Sanders, Vermont, March 10, 2010
News
Solar Power: Introduced legislation to encourage the installation of 10 million solar power systems on home roofs and businesses over 10 years.
https://www.sanders.senate.gov/newsroom/newsarticle/031010
U.S. Senate, July 21, 2010
Article at:
http://www.sanders.senate.gov/newsroom/press-releases/release-senate-panel-approves-sanders-solar-panel-bill
Or internet search.
Have the Russians continued with their one model that did track reality, and how did it differ from the assumptions baked into the bulk of the IPCC models?
I assume the effects of changes in solar activity are included in the the Russian model and not in the others.
INM-CR4 has three main distinguishing features compared to the other 31 models in CMIP5. 1. Higher ocean thermal inertia. 2. Lower water vapor feedback. 3. In consequence of the first two, significantly lower sensitivity (ECS 2.08). See Andrews et al in GRL 2012 for details. Ron Clutz also had a good discussion a while back on his blog.
I had seen coverage of INM-CR4, but no news if the Russians did more than one run of the model. If that model continues to more closely track reality, all well and good, but one run might be chance.
Ve arr vay ahed off you comrad.
Remember Gagarin?
Or the models use the wrong sign for water vapor feedback. Lowering the value makes the virtual closer to reality with all other vars fixed. Errors in the other vars are masked by the wrong sign.
The common logic fault in most hyper specialized fields is critical thinking.
There is a INMCM5 ready for participation in CMIP6. A paper describing it is behind a paywall at Springer. A paper on its simulation of the present climate is here:
https://istina.msu.ru/download/…/1dcw3B:m5FoB-9gE-YWmJDJuK2KtxsYqAQ/
(might take more than one attempt to get the pdf download.)
From the Conclusion:
“The INMCM5 climate model is created, and it differs from the previous version by a higher upper boundary of the atmosphere and more detailed vertical resolution in the stratosphere. Horizontal resolution of the ocean model is increased. Furthermore, the scheme for simulation of clouds and condensation is modified in the atmospheric model, and an aerosol block is added.
A numerical experiment is carried out with the model to reproduce the current climate over 80 years. It has been shown that some systematic errors have decreased due to increase in the spatial resolution and implementation of new parameterizations. The reproduction of some phenomena, first and foremost, the quasi-biennial oscillation of the wind speed in the equatorial stratosphere and sudden stratospheric warmings, has become possible due to the improvement of the vertical resolution in the atmospheric block.
At the same time, some errors, including those in the global mean values, remained at the same level or even slightly increased. For example, a distorted picture of the meridional stream function in the Southern Ocean requires a separate study. Overall, the new version of the climate model is ready to take part in numerical experiments for the simulation of the climate and its changes within the CMIP6 program.”
I see the link above copies incompletely. If your do a search on: Simulation of Modern Climate with the New Versionof the INM RAS Climate Model you should get a result with the Russian server noted above. Clicking on it got a pdf download.
Simulation of Modern Climate with the New Version Of the INM RAS Climate Model
http://sci-hub.cc/10.1134/S0001433817020128
For a more complete look at INMCM5, see post today:
https://rclutz.wordpress.com/2017/10/02/climate-model-upgraded-inmcm5-under-the-hood/
In the 19th C scientists attempted to model the experimental results obtained for the distribution of blackbody radiation, later perfected by Lummer and Pringsheim (1898). The models based on classical physics correctly predicted the longer wave distribution but failed with shorter wave radiation( uv etc). In 1900 Planck’s model introducing quanta ( a accurately mapped the experimental results. This model, now known as Planck’s Law, considered the quantum as a neat mathematical trick which gave Planck a formula that worked.
The current climate models which are widely inaccurate and overheated ( suffering from the uv catastrophe syndrome) require a little or a lot of Planck type inspirational input to make them accurately predict reality.
I find it difficult to understand how scientists can propose an Average of any model when average implies that the entire population of the object is available for sampling. As models are only a reflection of the input variables used in developing the results and all ranges of all variables have not been modeled, it is not appropriate to discuss the average of a limited sample of the whole. Each model needs to be compared to its ability to model the past accurately and then its veracity in forecasting the future temperature and other climatic variables. I submit that with these criteria, all models have failed.
If the sample is not random, its average does not correspond to the average of the entire population. The ensemble of models thingy is wrong in so many levels.
It is also not valid to average a set of unrelated variables each one a unique event that will never be repeated.
Well let me clarify. ANY finite set of finite real numbers can be treated to ALL of the algorithms of Statistical mathematics. Even a set of numbers where no two of them are even numerical values of some real physical variable that may have dimensional units.
Physical dimensional units are not any part of statistical mathematics which applies strictly to finite sets of finite real numbers. Variables are not even allowed in statistical data sets; only numbers whose exact values are already known.
Your daily news paper is a perfect source for a finite data set of exact finite real numbers that can be analyzed using ANY algorithm of statistical mathematics.
The results have NO significance as regards, anything that may have happened in the real universe. They are of interest only to statisticians, who are always trying to concoct new and more complex algorithms to write papers on.
Pure numerical Origami.
G
no instrumental observations made in our climate system can disentangle anthropogenic effects and natural variations.
HOORAY. It has been said at last.
DSc even. My upmost respect and admiration Michel.
“Over that period, the mid troposphere temperature over the tropics (just taken here as one example) rose at a rate of 0.11 °C per decade (between 0.07 and 0.17), meanwhile, according to these models, it should have risen at the rate of 2.7 °C per decade (between 0.12 and 0.46). This difference is statistically significant”.
Factor of 10 error, presumably, should be 0.27C?
Yes, typo!
My results of an analysis of the results of 27 weather stations NH an 27 SH balanced to 0 latitude show there is no man made warming.
Measured in degrees C /annum.
“But when this goes into public policy, such as the Paris agreement and the commitments of its contracting parties, then it is more than very likely that the anticipated measures will be useless and that the huge resources to be involved will be wasted. It’s stupid and unfair.”
… and, for those who want to ram this unfair stupidity down our collective throats, it is immoral.
Excellent post. IMO the main flaw is mistaken attribution in the unavoidable parameterizarion. See recent guest post ‘ Why models run hot’ for the essence of the argument. See guest post ‘The trouble with models’ for more background detail on climate models generally.
when I have time to slow down again…I’m going to read them both :)….again!
And any model run depends on the source data being accurate and authentic.
(Maybe a few spiders should be named after Hansen and Gavin? “Oh, what a tangled web we weave!”)
I’m leaning strongly in the direction that no matter how many bells they add….they are still predicting a straight line….this much CO2 = this much temp
When you adjust past temps down..to show more warming…and then hind cast to that
….of course the models are going to run hot
That is also true. But the model/obs discrepancy is significantly larger than the apparent temperature fiddles impacting parameter tuning. Plus, the CMIP5 ‘experimental design’ required submission 1.2 was best tuned hindcast from YE 2005 back three decades. The major temperature fiddles removed the 1930’s warming, so not much parameterization impact.
1 1/2 adjusted out..is what they claim for rise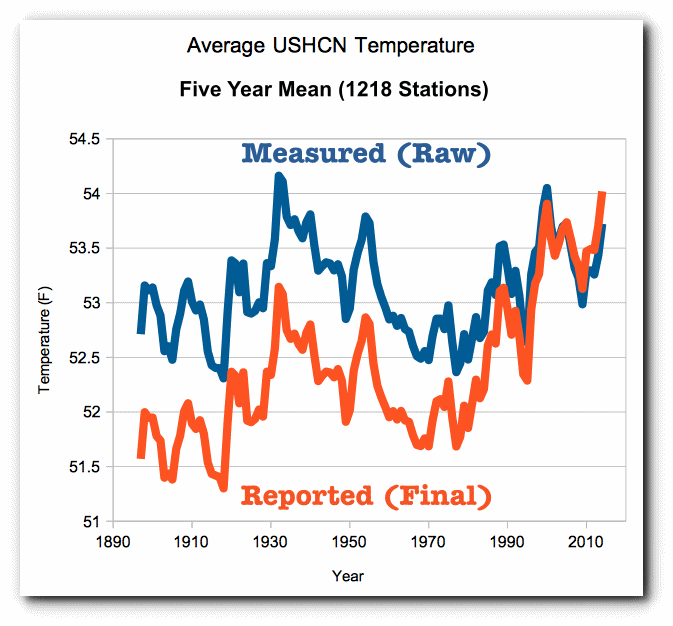
L, true. A great Tony Heller graph. But the parameter tuning period was supposed to be (who knows what was actually done) 1975-2005. So your chart and my comment are not fundamentally inconsistent.
dunno….eyeballing that graph…75 to 05 still looks like 1 to 1 1/2…and the slope they are getting on the models
Latitude/ristvan. A lot of world raw temps have the same pattern as that of the US. Here is Capetown South Africa’s:
Both Greenland and Iceland raw data shows the late 1930s/1940 to be the warmest period.
Why should the (contiguous) US be an outlier when CO2 is a well mixed gas? What is it about the topography and.or geography of the (contiguous) US that would make it some outlier?
Do not forget that even in the IPCC First Assessment Report they had 1940s being the warmest period, and the Briffa/Mann tree ring data also showed that through to 1995, the NH was no warmer than 1940.
I am far from convinced that the NH is any warmer today than it was in 1940. the sampling and historic date is too sparse to make any meaningful assessment of the SH.
There is a serious flaw in a fundamental concept used to justify ALL the climate change models. That concept is the ‘greenhouse gas’ – usually understood as “infrared-absorbing gases” in the atmosphere. The assumption is that the infrared energy absorbed by these gases will directly warm the atmosphere *more* than the atmosphere would warm if the gases were not absorbed.
Consider that the infrared energy that does NOT get absorbed by these gases passes through the atmosphere to be absorbed at the earth’s surface itself – either the solid earth, the liquid oceans, or the solid ice. Every square centimeter of the earth’s surface is in contact with the atmosphere, and this surface can heat the atmosphere by conduction rather than radiation.
It makes no difference to the molecules in the atmosphere whether the heat come from absorbed radiation or from contact with a warmed surface – heat energy is heat energy.
All of the incoming infrared energy from the sun eventually finds its way into the atmosphere, notwithstanding the IR absorption spectra of individual molecules.
Studies of thermodynamics and physics reveal that the two key quantities that determine the temperature of the atmosphere are the Total Solar Irradiance (TSI) and the Adiabatic Lapse Rate (ALR).
Climate change ‘scientists’ tend to ignore the former on the assumption that it is either constant or that its variations are not significant. As far as I can tell they are all woefully ignorant of the latter.
The ALR is critical, however, because it directly connects the variations of temperature according to altitude (dT/dh) with a fundamental physical property of the atmosphere that is directly related to its composition – the heat capacity at constant pressure Cp.
Much is made of the temperature of Venus’ atmosphere, given that Venus has a mass closely comparable to that of the Earth, and an atmosphere composed primarily ((96.5%) of carbon dioxide. Ths CO2 is wrongfully seen as the reason the average surface temperature of Venus is 462° C, while that of earth is only 14 °C. This comparison naively ignores the effect of the far greater pressure of the atmosphere of Venus (92.1 atmospheres at the surface) and its relation to the lapse rate. A fair comparison would require comparing the temperatures at the same pressure level. The atmosphere of Venus has a pressure of 1 earth atmosphere at an altitude of about 51 km(!), where the temperature is a far more moderate 65° C.
Given that Venus is considerably closer to the sun than earth, the 65° C temperature is about in line with one’s expectations for the difference in TSI.
I am still looking for a “climate scientist” who understands the ALR and it’s impact on temperatures and convection.
The concept of a “Greehouse Gas” is a myth based on lack of understanding of basic physical chemistry.
Beg to differ. GHGs do not warm. Only the sun’s SW radiant energy after reflected albedo warms. GHGs retard offsetting LW cooling. So the planet warms. The question is how much after water vapor and cloud feedbacks in a convective atmosphere, not whether CO2 is a LW retarding GHG. That was first experimentally determined by Tyndall in 1859.
Agreed.
But why do we not see GHGs retard offsetting LW cooling on Mars? The Martian atmosphere, on a numerical basis, contains an order of magnitude more CO2 molecules than there are in Earth’s atmosphere, and the CO2 molecules are more tightly spaced together in the Martian atmosphere (since Mars is a smaller sphere) than are CO2 molecules in Earth’s atmosphere.
The upshot of this is that on Mars, a photon of LWIR radiating from the surface of Mars, is far more likely to be intercepted by a CO2 molecule in the Martian atmosphere, and then re-radiated by that CO2 molecule and then intercepted by another CO2 molecule in the Martian atmosphere and so forth, than is the case of a photon of LWIR being radiated from Earth’s surface being intercepted by a molecule of CO2 in Earth’s atmosphere.
Put simply, it is far more difficult for LWIR radiating from the surface of Mars to find its way to TOA of the Martian atmosphere, than it is for LWIR radiating from the surface of Earth to find its way to TOA of Earth’s atmosphere, and yet there is no measurable (radiative) GHE observed on Mars!
Mars ought to show (in relative terms) more retarding of LWIR cooling than that seen on Earth, and yet it exhibits no measurable retardation of LWIR cooling.
Indeed it is surely a self evident fact that if you build anything on shaky foundations then however good the bit on top if the base is fundamentally flawed it all fails. The “theory” of Global Warming is fundamentally built upon the assumption of Greenhouse Gas(es). If this assumption is flawed everything else is not only a waste of time and resources but all result will be pure BS.
The basic assumption needs to be properly tested in detail by repeatable experiments of varying size, lab and field. Experiments should be designed to not only test the veracity of the assumption but also quantify its effect. To carry out this will be trivial compared to current expenditure on CO2 mitigation. anyone who object to this must be under suspicion of having a political agenda and not be interesting in finding the scientific “truth”.
RB, I shall paraphrase a comment from elsewhere earlier at WUWT. Too much skepticism can be in this great policy debate as harmful to the outcome as too little, because it generally discredits skeptics. Obama used that observatiin in his flat earth society comeback. GHG do not warm, they ‘only’ impede radiative cooling. Any other statement shows ignorance of basic well established radiative physics. See essay Sensitive Uncertainty for a layman’s level detailed and illustrated explanation using actual lab proven physics, with solid references.
Ritsan.
With respect your comment lacks scientific credence. It appears that you are approaching the matter as if you are a lawyer trying to negotiate a settlement. When negotiating a settlement, it is unhelpful to take extreme positions, since one needs to find common ground. You are looking at it politically, not scientifially.
From the scientific perspective, sceptism should be applied to all aspects. What is there to object to this statement:
You will note that I have elsewhere made a comment about Mars. I will make another comment.
Earth has an atmosphere which is approximately 215 times as massive/dense as that of Mars. however, if you were to remove all the non GHGs (Nitrogen, Oxygen, Argon etc), and leave just the GHGs (water vapour, CO2, Methane etc) then both Mars and Earth would have similar mass/density of atmospheres.
It is interesting to note that both planets have broadly the same mass of GHGs in their respective atmospheres. Under the (radiant) GHE we are led to understand that it is the GHGs in Earth’s atmosphere that has led to the temperature of the planet, and it is not the vast mass of the non GHGs that have led to the temperture of the planet.
This begs the question: If it is only the amount of GHGs in an atmosphere that cause the temperature of the planet, why does Mars which has about the same total mass of GHGs as does planet Earth, show no measurable (radiant) GHE?
In fact the only difference between Earth and Mars, is that on Earth there is additionally a huge mass of non GHGs which give the atmosphere both thermal mass and thermal inertia. the difference between the two planets is the presence in large quantities of non GHGs.
PS. I am talking in relative terms. One needs to take account that solar insolation is less on Mars and the albedo is different. So one would not expect Mars (which has the same quantity of GHGs as does Earth) to have some 33degC of GHE, but rather a figure of that order but as regulated by the different solar insolation and different albedo of the two planets.
The Spirit rover recorded a maximum daytime air temperature in the shade of 35 °C, and Viking measured soil temperature at 27 degC, so even though Mars is considerably further from the sun, because there are few clouds most of the solar insolation reaches the surface, and with low albedo, relatively little is reflected. So there is quite some temperature for the GHGs to retard LWIR cooling of LWIR radiated from the Martian surface, but to date no observable GHE has been measured on Mars.
I consider that we have a lot yet to learn, know and understand. It is a big mistake to be over confident as to our present day understanding of matters. I consider that if cAGW falls apart, given the knock on effect to the credibility of science in general, and the huge waste of resources there will be an inquiry into this matter, and one finding will be why have so many assumptions, which have never been properly tested, simply assumed to be correct.
@richard
“and with low albedo, relatively little is reflected”
The albedo does not matter! The albedo is just the deviation of absorptivity from 1. But Emissivity
is not 1 either, and both deviations tend to even out. Sure, one may be greater than the other, but unless we have precise information on that subject, it is best to assume that both will be equal. And if they are equal, any object will turn as warm as a perfect black body would.
If you only take one deviation into account, and that would be the albedo, you will always get temperatures which are too low and that will determine a GHE where there is none.
A great example would be Enceladus, which given its albedo of 0.99 (!) should only have 28K, but has about 75K in reality. That gives it a massive GHE of 47K – despite there is not even an atmosphere.
Also the moon, or the hull of the ISS, do reach up to 120°C, which is just the temperature a PBB would reach, but should be impossible if only their albedos were taken into account. Otherwise the moon might only get up to 108°C at an abeldo of 0.13.
And finally we have the same subject with Earth, which should have 279K and not 255K or so in theory.
“why does Mars which has about the same total mass of GHGs as does planet Earth, show no measurable (radiant) GHE?”
Mars has a small GHE
ave. solar irradiance = 590/4 = 147.5 W/m^2
bond albedo = 0.25
ave. surface irradiance = 147,5 (1 – 0,25) = 110 W/m^2
SB equation
110 = o T^4
T = 210 K
Reported ave. T = 218 K
8 K difference may be GHE
It’s not the total mass of GHG. Radiative forcing (RF) is a function of the increase in concentration of GHG
RF = k ln (C/Co)
where C is final concentration, Co is initial concentration
If Co is already 90% you cannot double it. You can only increase it by 10% so C/Co = 100/90 = 1.11
That’s why methane which has much lower concentration is more potent than CO2
@Strangelove
Again this is the wrong approach. You need to skip the albedo, and then, as a PBB Mars would have 226K. The subject is finding the correct average temperature of the surface.
As emissions increase by the power of 4 with temperature, an arithmetic average is pointless. For instance the arithmetic average for the moon will be about 205K, while the geometric average is about 280K. I had to calculate it myself, because you not find this correct value anywhere.
With Mars the arithemtic average will be substantially higher as well, but I will not try to assess the correct value at this point. But once you understand the logic behind, it is easy to predict the average will be the named 226K.
I will largely agree. What I find ironic however, is how the 500lb Gorilla in the room is completely getting ignored.
We can observe the GHE, if it should exist, on a daily level. The sun comes, the surface heats up, the sun goes away, the surface cools down. This process needs to be badly affected by GHGs, as they slow down the rate of nocturnal cooling specifically.
Of course GHGs would take effect throughout the day, causing higher temperatures over all. But he have no way to tell, what temperatures would be like in a specific place with or without GHGs. So there is no way to validate the theory (there is one exception though, but that failed too).
Next we can well observe how changes in the radial properties in the atmosphere do affect such fluctuations. We only need to look what effect coulds have. With an overcast sky, temperature variations become minimal (<5°C), while they reach 15-20°C with a clear sky. One might think that is because sun light gets blocked and reflected, but that ignores the other side. For instance, and such situations do occur, clouds may come just after a bright, sunny and hot summer day. Then they will conserve the high temperatures well through the night. So clouds also have a massive GHE, if you will. That however is due to reflection of (IR) light, not due to absorbing it, which is a huge difference.
Now we can see extreme temperature variations on the moon. The moon of course has a very long day/night cycle, no atmosphere, thus no convection, but most importantly no GHE. It actually turns just as hot as a PBB (120°C), despite a significant albedo. Which is just as much true for the ISS btw.
Mars shows variations of about 70°C (air) and 100°C (soil). On Mars however the day lasts almost as long as on Earth (24h37min), and the martian atmosphere is extremely rich in CO2, though it lacks H2O.
Now do we have places on Earth, where GHGs are very low? Absolutely! Deserts like the Sahara or the Atacama are very dry. So there is the myth, temperatures would extremely low during the night, which seems logical if you follow the GHE theory. Reality has it different however. Temperature variations do not, or should I say hardly ever go beyond 20°C in these places, just like they do anywhere else where the sky is clear.
But we have even more extreme places, like the Tibetian plateau. At altitudes of 4.500m and higher, only 55% of the atmosphere are remaining, and even 95% of water vapour are gone. So GHGs would be reduced (if we assumed vapor would account for 60% of which) to 0.05*60% + 0.55*40% = 25%. With only 25% of GHGs remaining, we would definitely need to see much more extreme temperatures between day and night. But again, the theory does not materialize, not a single bit!
http://www.meteo365.de/klima,xainza,898.html
The ocean is a vast heat sink and air moves horizontally too, not just vertical. Heat is transported across the globe moderating the temperature difference between night and day.
“But he have no way to tell, what temperatures would be like in a specific place with or without GHGs.”
But we can easily determine the difference in effect between the two primary GHGs, water vapour and CO2.
Imagine two places on the same relatively low latitude, one in the Amazon jungle and one in the Sahara desert.
The one in the Amazon jungle will have much higher humidity – ie atmospheric water vapour content – than that in the Sahara. Both will have effectively equal concentrations of CO2.
The highest temperature in both will occur some time after noon, the temperature in the desert will be higher than the one in the forest.
When night falls, the temperature in the desert where the atmospheric water vapour concentration is low will drop rapidly, even approaching freezing point, while that in the Amazon where the water vapour concentration is high will not drop anywhere near as much.
Clearly it is water vapour that controls the temperature difference between the two locations, not CO2.
@catweazle666
You are not listening to what I am saying. You are just quoting the myth of freezing in the Sahara. Look at the reality here:
https://en.wikipedia.org/wiki/Ab%C3%A9ch%C3%A9
There is no freezing in the Sahara generally. Sure, there may be rare exceptions, but that is irrelevant in terms of climate. As the table shows, temperature may be varying by up to 20°C in the desert, just like anywhere else if there is a clear sky, which of course is prevalent in the desert.
Btw. .. why the hell is it hotter in the dry desert, than somewhere in the moist Amazon jungle in the first place?!?!?
It’s not the incoming radiation that we are talking about. It’s the outgoing radiation.
A thought experiment. Put air in a cylinder with a piston at the top end. Put a weight on the piston to increase air pressure up to the surface pressure of Venus. Surely temperature would also rise. Keep that pressure for one year, assume the cylinder is not heat insulated. What happens? The pressure remains the same but temperature drops to ambient temperature, whatever that temperature is, say 0 C to 40 C.
This demonstrates that for this thermodynamic system, air temperature is independent of pressure. It is dependent on heat flow between the air inside and outside the cylinder. This is true for planets with atmosphere. They are not heat insulated. Heat flows to space via radiation. Without constant heat flow from the sun, the planets will cool in a matter of years.
BTW since the planets are over four billions years old, the heat from gas compression had radiated to space long ago
“This demonstrates that for this thermodynamic system, air temperature is independent of pressure.”
You are missing the other variable: volume. You always have constant proportionality of PV to T to first order. Your piston will continuously decrease in height until ambient temperature is reached.
This reply is intended only to help you refine your thought experiment. It is not to be construed as an endorsement of GHG independent models of planetary temperatures.
It goes without saying that volume will change. It’s a consequence of Charles law:
V/T = k
When pressure is constant, volume must change with temperature. It is true for planetary atmospheres. Surface pressure is constant because it is a product of the planet’s gravitational field and mass of the atmosphere. The height of the atmosphere varies with the average temperature, which is independent of pressure.
“The height of the atmosphere varies with the average temperature, which is independent of pressure.”
What do you think holds it up there?
“Surface pressure is constant because it is a product of the planet’s gravitational field and mass of the atmosphere.”
The mass of the atmosphere is dependent upon temperature. Think of the seas of methane on Titan.
All of these things are interconnected.
“What do you think holds it up there?”
kinetic temperature = average velocity of gas molecules
The higher the velocity, the higher the kinetic energy, the higher up they go. If the gas is confined, pressure will increase but the atmosphere is not confined
“The mass of the atmosphere is dependent upon temperature. Think of the seas of methane on Titan.”
Nope. One kilogram of methane is still one kilogram whether it is solid, liquid or gas
What do you think pressure is?
Can a substance in liquid state be part of an atmosphere?
“sensitivity of the climate to human contributions”
I have done some work in this area. Here are links to some of these results.
https://ssrn.com/abstract=2997420
https://ssrn.com/abstract=3000932
https://ssrn.com/abstract=3033001
https://ssrn.com/abstract=3023248
https://ssrn.com/abstract=2956179
https://ssrn.com/abstract=2845972
It has always amazed me in my 35 some odd years of working with, around, programming and designing computers how gullible the general population, up to and including most academics, was and still is to results generated as output by any computer. For some reason they just cannot believe or except the fallibility of computers. I have even seen modellers who could not be disassociated from their belief in their own models., even when presented with proof that their models were incorrect. I have even worked with/for project managers and software development managers, up and including corporate Vice President level, that fully believed in ‘zero-defect programming’ and the simplicity of developing it.
So, it’s not hard for me to see why we have wasted so many billions of dollars developing over a hundred CMIP5 climate models and believing in their (catastrophic) results to the point of throwing away another several billion dollars a year on global warming research in every field from oceanography to psychology, climatology to cryptozoology. Dr, Tim Ball, in the previous post on this site, gave several examples of the almost total lack of “common sense” of most urbanites, but even that doesn’t explain the general believe in the infallibility of computers. Maybe Univac and IBM just did too good a job of selling our parents and grandparents on computers back in the 1950’s and 1960’s and we are all just too dumb to recover, fully deserving what we now have.
I don’t understand what all the fuss is about. Leave all fridge doors open World wide on a Wednesday at 10am for one hour, there! it’s easy, and makes as much sense as anything else.
Wow, that is funny if you meant /sarc. Else better study up on the cooling coils and fan behind/under your fridge, and the underlying thermodynamics. We presume you meant sarc.
Of course it was a sarcastic comment, as is plainly apparent from the explanation mark, and the ridicule that follows.
We were once working on a major species of marine fish trying to ascertain population size, size distribution and the effect of commercial fishing. We had better and more complete data on this species than any other species under management or consideration for management. The federal scientists and technocrats agreed that the data was the best they had seen, though note they didn’t collect it because none of the fishermen trusted the federal government. We had turned all the data over to the feds for them to use in some “new” and fancy computer model. We held a management meeting including all the federal management councils for the Atlantic Ocean for the federal scientist to present the new, great advancement in fisheries management. Well, we brought with us to the meeting a great statistician, who the federal scientists literally labeled a ringer. I am not kidding it is in the record. He proceeded to point out that the model was not new, but was just a poor modification of a older model. They only difference was they had run the model several hundred times on their new computer. He also pointed out that they had screwed up their testing methodology, little things like reverse X and Y axises. At that point we noted that our data and Spanish data indicated that the average size of the fish under consideration had gone from over 120 pounds dressed weight to 20 pounds. They referred us back to their model, promising to make corrections, but still obviously dependent on the model for any management decision. I finally asked them if we had 100% of the data from the fishery (we had about 75%) and they ran their model and they model and the data disagreed what would the use for manage considerations. Their immediate answer was “the computer model” results. That answer did not go over well with the politically appointed council members. Who were all practical men and women with a great deal of common sense.
I worked some with fisheries and other modelers and the obvious take is that a good one will give you the uncertainties (assumptions), not just more runs. I recall those from back in the “blackened redfish” day that were somewhere between extinction and needing a bounty. Currently there is a controversy between Louisiana /Texas and the feds about red snapper. I have not studied it lately, but I suspect there is still the lack of understanding of the great difference in productivity between Florida, where they are much more susceptible to overfishing, and the other states.
There is a lot of this around, not just in climate modeling. in silico is fine if it matches in vivo.
in silico
Good one!
JS, been around in molecular biology since the mid 1990’s. In vitro=lab test tube. In vivo=live animals including humans. In silico=in computer simulations (some of which for DNA/RNA/antibody protein binding are quite good having been verified. Unlike climate models.
There is a typo: the models predict 0.27 °C per decade (not 2.7).
“It is unlikely that the observations are erroneous”
1. the UAH “record” has changed numerous times since version 1.
2. the UAH record is not “observations” but rather data output from a model.
a) that model assumes the validity of radiative physics: the same physics that GCMs have.
b) that model assumes a constant and uniform emmissivity of land and water.
c) that model ( the current version0 has NO PUBLISHED CODE, the older version is published
and has known errors.
d) that model has never accounted for STRUCTURAL UNCERTAINITY.
e) that model differs Dramatically from the RSS Model for the same metrics
3. Comparing the GCM outputs to the outputs of the UAh Model is not as simple
as Christy and other have portrayed because the GCMs output multiple atmospheric levels
and UAH averages over monolithic layers.
a) no one has posted their methods or code for getting the ACTUAL data from the ACTUAL
GCM data archive. They mostly use secondary and unverified sources for GCM data
(KNMI)
All we know for sure is the following
1. RSS and UAH disagree in their estimates (modelled estimates) of the temperature of the bulk
atmosphere.
2. RSS have published their Structural uncertainty, UAH have not.
3. Neither have published their current code for
a) estimating the temperature
b) extracting data from the OFFICIAL archive of GCM data.
c) Comparing the two sets of MODELLED data while accounting
for the uncertainties of BOTH sets of modelled data.
Of course none of this stops faux skeptics from claiming to know the final answer.
That said, a complete comparison is being prepared that will include all uncertainties.
while we wait…..
what folks should do is force all parties playing this game to post their code and data
so that people can check.
That means.
1. Code and data to produce both the RSS and UAH records.
2. Code required to extract the SOURCE DATA from the GCM archive
3. Code required to manipulate the GCM data so that an Apples to Apples comparison
with UAH and RSS can be done. This is non trivial and subject to debate.
4. Code required to reproduce the charts as published
Until folks have that, I’d basically Suspend Judgment.
In short, I haven’t seen any work by any satellite group that comes close to fully documenting this
issue from the raw data up to conclusion.
So says Steven Mosher who works in a group (BEST) that does not even understand instrumental resolution (see Figure 13).
Their own error bars are ludicrous. They’d be disingenuous misrepresentations if they weren’t evidence of incompetence.
In their defense, Steven Mosher, et al., are no more incompetent than UEA/UKMet or NASA GISS (see Figure 12) at the link.
I disagree entirely. BEST are more culpable since before they started they were well aware of the short coming of the time series data sets, and therefore they were able to start from scratch, devising a system for temperature comparison without those short comings.
We needed to be in a position to compare unadjusted RAW data with unadjusted RAW data. BEST ought to have taken an entirely different approach than the approach that UKMet/NOAA/NASA/GISS take. Instead, BEST take exactly the same approach but with a slightly different algorithm. No wonder they get similar results since their approach, as a matter of principle, suffers from the same inherent shortcomings.
What BEST should have done was to go back to first principles and carried out observational testing. They should have identified the best sited 200 stations where we can be absolutely certain that there has been no impact by man whatsoever on the local environment and we can be certain that the station today is exactly as it was in the 1930s/1940s.
Then those best sited stations should have been retrofitted with the same type of enclosure as fitted in 1930/1940 painted with the same type of paint, and fitted with the same type of LIG thermometer as used by that station in the 1930s/19402. The thermometer would be calibrated using the same methodology as was used at that station. Then current observational data would be used using the same practice and procedure (eg, the same TOB) as used at that station in the 1930s/1940s.
We would then be able to obtain 200 individual pinpoint data sets whereat modern day RAW data could be compared with past RAW data, without the need to make any adjustment whatsoever to the data.
We would simply make a like for like direct comparison. We would not make a global data set, there would be no area weighting, kriging etc. Just simply compare on an individual station by station basis the modern day observation with the station’s own historic data for the 1930s/1940s. We would soon see what if any change there has been since the highs of the 1930s/1940s.This would cover the period when some 95% of all manmade CO2 emissions have taken place, so we do not really need to go back further than the 1930s to see whether CO2 may be having any material impact on temperatures. .
If there was no significant change, it would have been unnecessary to study further.
BEST was a real lost opportunity. Typical of this head of science and its reluctance to carry out empirical observational experimentation. This science is nothing more than a numbers game where the quality of the data itself is paramount. Yet the science persists in using poor quality data. It needs to work with the cream rather than with the crud. One cannot make a silk purse out of a sow’s ear, and the current time series data sets should be thrown out and a new approach taken where good quality data can be compared directly with historic data without the need for any adjustments whatsoever.
PS. Frank, you have posted several very interesting articles on this site, which I have enjoyed reading immensely. Thank you.
Pat Frank
In my conversation with Steven about the propagation of uncertainties from multiple instrument readings, I also found that he was (apparently) unaware of the concept, let along how to calculate it. He multiple times indicated that he thought that the more readings you make with more instruments, the more exactly is known the average temperature, whereas one actually knows more accurately the centre of the uncertainty range within which the average is located, and further, that the range of uncertainty increases as each additional instrument’s readings are added to the set.
richard verney, interesting idea. You’re suggesting a calibration of previously deployed instruments to estimate an average accuracy of past measurements. That would be something NOAA could have done, and should have done 30 years ago when AGW became an issue.
The calibration would probably be too expensive for BEST to carry out. But that doesn’t excuse them from using garbage data to foist an exercise in false accuracy on us all.
Thanks for your kind words, by the way.
Crispin in Waterloo, your story is no surprise at all. I’ve had several exchanges with Steve Mosher as well. He shows no understanding of measurement error. Honestly, he shows no understanding of how science works, either.
BEST, including SM, assume all measurement error is random, and globally stationary. So do UKMet and GISS.
Those assumptions (random, global stationarity) are utterly unjustified. Nevertheless, they use this idea to set all temperature measurement error to zero.
Even worse, they assume all ship-borne thermometers have both random error and a constant normal error distribution. Also utterly unjustified, but universally applied.
In his 2014 review, John Kennedy noted the systematic measurement error in SSTs, and then folded his hands, invoked his faith in the Central Limit Theorem, and his prayers were answered when all error went to zero. This was passed by his reviewers.
The problem we’re facing here is not global warming, but global incompetence.
SM,
You said:
“1. the UAH “record” has changed numerous times since version 1.” How much has it changed? Can you provide some numbers so that we don’t have to assume that it has flipped on its head?
“2. the UAH record is not ‘observations’ but rather data output from a model.” How does that differ substantively from changing historical temperature records?
“1. RSS and UAH disagree in their estimates (modelled estimates) of the temperature of the bulk atmosphere.” Again, what is the sign and magnitude of the disagreement?
You would be well advised to follow your own advice and forget about the hand waving.
“1. the UAH “record” has changed numerous times since version 1.” How much has it changed? Can you provide some numbers so that we don’t have to assume that it has flipped on its head?”
http://www.drroyspencer.com/wp-content/uploads/UAHNCDC_trends_v6-vs-v5.6-thru-Mar-2015.gif
http://www.drroyspencer.com/wp-content/uploads/V6-vs-v5.6-LT-1979-Mar2015.gif
“1. RSS and UAH disagree in their estimates (modelled estimates) of the temperature of the bulk atmosphere.” Again, what is the sign and magnitude of the disagreement?”
http://www.drroyspencer.com/wp-content/uploads/RSSv4-vs-UAH-MT-original-series.jpg
I start by accepting Mr. Mosher’s thesis that satellite data is also inaccurate. But is it more or less inaccurate than the much adjusted terrestrial measurements? If it is less accurate than the adjusted terrestrial measurements that are preferred by the modellers then why does balloon data appear to agree with satellite data rather than terrestrial data?
Steven M
Yes, we understand that there are modeling calculations carried out in order to yield a satellite temperature set.
Why do the two satellite-derived temperature sets match the balloon-borne direct measurements so much better than do the climate models? I agree that the two satellite-derived temperature sets don’t match each other perfectly, but they both match the radiosonde data much better than every climate model except the Russian one which has a low CO2 sensitivity.
It is all well and good to complain about opaque systems but the fact is, however it works, it is a lot better than the general circulation models. Why is that, Steven? Is it because the sensitivity to CO2 is set too high the GCMs?
The head of Canada’s persistently wrong multi-million dollar computer model predicting 6 degrees C rise by 2100 has mercifully moved on to a BC Legislature political career in Green camouflage. Unable to predict the global temperature, perhaps he will have more success gauging the political temperature.
Sometimes an essay in English from someone whose first tongue is not English conveys, perhaps because of its more carefully constructed prose, a greater clarity than similar thought expressed by someone habituated in the idioms of his native language.
I think this is one such occasion.
Very nicely presented.
Thank you, Michel de Rougemont
People I know of live in regions of variable climate, with no obvious correlation with ‘global’ temperature data. The region I happen to spend most of the time has a relatively good historical temperature record. The recent ‘exceptional’ warming record lasted hardly a decade and it appears that it might well be over.
http://www.vukcevic.talktalk.net/CET-11yrLPF.gif
Models don’t work because the primary driver ‘natural variability’ is replaced by the spurious CO2 sensitivity.
In the above case the CET data has two distinct annual parts: winter and summer temperatures which do not correlate.
Winter has 0.4C/century and summer 0.1C/century rising trends, giving an average of 0.25C/century (spring and autumn are near carbon copies of the annual trends)
Further more there is important difference in the spectral composition of the winter and summer date.
Main multidecadal components for winter are about 70 and 90 years, while for the summer data are 55 and 70 years.
Natural variability model can be cratered by simply superimposing these three components (55, 70 & 90 years) on the CET rising trend of 0.25C/century.
http://www.vukcevic.talktalk.net/CET-recon.gif
Of course this kind of the ‘temperature trends model’ may not be very accurate but it gives good back-casting representation in the case of the CET data.
In case of the global data the north and south hemisphere may need to be considered separately.
1883 eruption of Krakatoa
Outstanding article, but, regrettably, the content will never breach the censorship wall that shields the mass media from ideas contrary to their preferred narrative on climate change. The chief problem for rational scientists is how to overcome this huge communication barrier. Maybe not possible.
My simple take on climate modeling can be expressed as a thought experiment. Think of the earth’s climate system as a black box. The output of the black box is the earth’s temperature. Climate research should focus first on analyzing the output. If one cannot analyze the output of a complex system, what is the likelihood that the complex system itself can be modeled?
My first attempt to better understand the problem is a simple numerical analysis of the HadCRUT4 time-temperature series. The following graph shows the rate of increase (first derivative) of the global mean temperature trend-line equation, which has been constant or steadily decreasing since October 2000. The HadCRUT4 temperature anomaly has decreased by nearly 40 percent from March 2003, the El Nino peak, to July 2017. The rate of change of the trend-line will likely become negative within the next 20 years, reaching the lowest global mean trend-line temperature in almost 40 years. (draft ref: An-Analysis-of-the-Mean-Global-Temperature-in-2031 at http://www.uh.edu/nsm/earth-atmospheric/people/faculty/tom-bjorklund/)
https://imgur.com/a/p7Hcx (right click “view image”)
The focus of climate research should be on analyzing the output of the black box rather than spinning wheels trying to analyze unknown interactions of particles and waves within a black box. Ultimately, the results might lead to a better understanding of how the climate system works and, finally, a conclusion on the viability of GCMs. The goal of climate studies should be to successfully predict global mean temperatures within a range of values adequate to guide public policy decisions. The U.S. is on the verge running off a cliff if we cannot make a mid-course correction on the current direction of climate change research and policies.
Black box. Kind of like the ‘top down’ analysis at http://globalclimatedrivers2.blogspot.com It identifies three main drivers of climate change. CO2 is not one of them.
Hindcasts do not verify climate models. Hindcasts are used to tune the parameter sets so that target observations are reproduced. Such a process is not a verification.
The process means that climate models are not equipped to predict observables outside the bounds of their hindcast tuning region.
Climate model projections are physically meaningless.
It matters not whether they are running hot, running cold, or getting the “correct” answer by happenstance. They are all nonsensical pseudo-results.
If the modelers really knew what they were doing then they would have only one model. The fact that they are dealing with multiple models signifies that a lot of guess work in involved. Averaging over multiple model guesses makes no sense what so ever. At the very least they should have discarded the worst models many years ago but that has not happened. The more models they consider the more confused they really are.
Their modeling approach is basically that of a weather simulation but with wider sampling so that the can get results in finite time. They model the Earth and the atmosphere as a bunch of cells that relate to each other via a set of partial differential equations. The mumerical method involves predictor corrector loops. In advancing time they must predict the state of each cell and then correct it after applying the appropriate differencing equations, often requiring multiple iterations to reduce the error between the predicted and the calculated. The weather simulations that I am familiar with are only reasonably good for about ten days and in themselves may be marginally unstable yet over a ten day time period the marginal instability may not be notacable. However increasing the sampling interval may add to the errors involved and significantly add to the instability. The results of their climate simulations may be dominated by numerical instability more than anything else. Then there is the problem of rounding and unknown coding errors in such a complex simulation all of which adds to the numerical instability. I have seen too many results that were really a result of numerical instability and had nothing to do with reality. Then there is the problem of simulating laminar flow versus chaotic flow and combination chaotic and laminar flow which adds even more to the chance that the simulations have little to do with reality and are really just make believe.
Going from a weather simulation to a climate simulation the modelers would have had to add code to specifically simulate the effects of changing amounts of CO2 in the atmopshere. Hard coding in that adding CO2 causes warming begs the question as to whether CO2 has any effect on climate and renders the simulations as totally useless.
In their first report the IPCC published a wide range as to their guess as to the climate sensivity of CO2. Only one value can be correct. In their last report the IPCC published the exact same wide range of values. So over more than two decades of effort the IPCC has learned nothing that would allow them to reduce the range or their climate sensivity of CO2 guestamates one iota. It is as if the climate sensivity of CO2 was really zero.
One researcher has points out that the original calculations of the climate sensivity of CO2 is too great by more than a factor of 20 because the calculations neglect the fact that doubling the amount of CO2 in the atmosphere will cause a slight but very significant increase in the dry lapse rate in the troposphere which is a cooling effect. So instead of a climate sensivity before feedback effects of 1.2 degrees C, the value should really be less than .06 degrees C. Then there is the issue of H2O feedback. The AGW conjecture theorizes that an increase in CO2 causes warming that causes more H2O to enter the atmosphere that causes even more warming because H2O is really the primary greenhouse gas. Proponents of the AGW conjecture like to assume that an H2O positive feedback amplifys the climate sensivity of CO2 by a nominal factor of 3. However they completely neglect the fact that H2O is really a net coolant in the Earth’s atmosphere as evidenced by the fact that the wet lapse rate is significantly less than the dry lapse rate so that the H2O feedback is really negative so a better value for the H2O feedback gain would be 1/3 instead of three yielding a climate sensivity of CO2 of less than .02 degrees C which is a rather trivial amount.
The AGW conjecture depends upon the existance of a radiant greenhouse effect in the Earth’s atmosphere provided for by trace gases with LWIR absorption bands. It turns out that the warming in a real greenhouse has nothing to do with a radiant greenhouse effect. A real greenhouse stays warm because the glass reduces cooling by convection. It is entirely a convective greenhouse effect and not a radiant greenhouse effect. So too on Earth where gravity provides a convective greenhouse effect. As derived from first principal’s, the Earth’s convective greenhouse effect keeps the Earth’s surface 33 degrees C warmer then if there were no greenhouse effect at all. 33 degrees C is the derived amount and 33 degrees C is what has been observed. Any additional warming caused by a radiant greenhouse effect has not been observed. A radiant greenhouse effect has not been observed anywhere in the solar system. The radiant greenhouse effect is sceince fiction and because the AGW conjecture depends upon the existance of a radiant greenhouse effect, the AGW conjecture is science fiction as well. Modeling based upon the AGW conjecture is nothing more than make believe.
I take the fact that there are multiple models all saying different things as conclusive evidence that (i) the science is neither well known still less well understood, and (ii) that the science is not settled.
Whenever someone suggests to me that the science is based upon well known and understood principles of physics, I ask them which one of the models has the correct known and understood physics. If someone says to me that the science is settled, I ask why there are so many different models and why have the scientists not settled on just one (or just 3 reflecting the different CO2 scenarios).
You are being very kind. The average of wrong is always wrong. It would only be per chance that the right answer was obtained, not because the underlying science of the models was right.
When will people get this: the surface is not 33C warmer because of the atmosphere, the atmosphere is 33 degrees colder than the surface. The toy-model calculations subtract 30% of the heat before calculation of surface temperature with incompetent interpretation of the blackbody model. You can´t subtract 30% of the heat before calculation and then come whining about there being not enough heat, that is ignorant.
Look here: solar heating on the hemisphere, 2pi*r^2, diffusing in a spherical volume with two shells, V=4/3pi*r^3, gives the correct surface temp without any GH-effect of any kind. Try it:
1/2*TSI/V^2=383W/m^2=286.7K
1/2*1360.8/(4/3)^2
THERE IS NO GREENHOUSE EFFECT!
So the Russian model gets the closest to reality while most of the others aren’t even in the ballpark. Why don’t we just throw away the others and pay more attention to the Russian one? Oh, but if Trump did that, the outcry from the media and the alarmist troughers would be deafening. The Russian connection, you know. 😉
Lot’s of U.S. Government money (actually, our money) on models. Time for defunding, e.g. “Katharine Hayhoe is a Professor in the Public Administration program at Texas Tech University and Director of the Climate Science Center at Texas Tech, part of the Department of the Interior’s South-Central Climate Science Center. Her research focuses on developing and applying high-resolution climate projections to evaluate the future impacts of climate change …”