A very significant post over at Dr. Curry’s blog ~ctm
From Climate Etc.
Posted on August 16, 2017 |
by Dr. Ronan Connolly & Dr. Michael Connolly
Satellite observations indicate that the average Arctic sea ice extent has generally decreased since the start of the satellite records in October 1978. Is this period long enough to assess whether the current sea level trend is unusual, and to what extent the decline is caused by humans?
This change in Arctic climate is often promoted as evidence that humans are causing drastic climate change. For instance, an April 29th 2017 article in the Economist (“Skating on thin ice”, pg 16) implied that the Arctic is melting unusually, dramatically and worryingly:
“The thaw is happening far faster than once expected. Over the past three decades the [Arctic sea ice extent] has fallen by more than half and its volume has plummeted by three-quarters… SWIPA estimates that the Arctic will be free of sea ice in the summer by 2040. Scientists previously suggested this would not occur until 2070.”
However, is the 1978-present satellite record really long enough to allow us to:
- a) Assess how unusual (or not) the recent trends are?
- b) Determine how much of the recent climate change is human-caused vs. natural?
Recently, we published a study in Hydrological Sciences Journal (HSJ) in which we extended the Arctic sea ice estimates back to 1901 using various pre-satellite era data sources (Abstract here).
HSJ have chosen this article as one of their “Featured Articles” which means that it is free to download for a limited time: here. But, if you’re reading this post after that offer has expired and you don’t have paywall access, you can download a pre-print here.
In our study, we found that the recent Arctic sea ice retreat during the satellite era actually followed a period of sea ice growth after the mid-1940s, which in turn followed a period of sea ice retreat after the 1910s. This suggests that the Arctic sea ice is a lot more dynamic than you might think from just considering the satellite records (as the Economist did above). So, in this post, we will review in more detail what we currently know about Arctic sea ice trends.
Sea ice trends during the satellite era
The Arctic and Antarctic sea ice extent satellite data can be downloaded from the US National Snow & Ice Data Center (NSIDC) here. In the graphs below, we’ve plotted the average annual sea ice extents from this satellite data for both the Arctic and the Antarctic. For comparison, we’ve also shown Arctic air temperature trends since 1900 (adapted from our HSJ article).
We can see that, yes, the average Arctic sea ice extent has generally decreased since the start of the satellite record. Although, interestingly the average Antarctic sea ice extent has generally increased over the same period. However, when we look at the much longer Arctic temperature record we can see that this is not surprising. The Arctic region has been warming since the late 1970s (when the satellite records began), but this followed a period of Arctic cooling from the 1940s to the early 1970s! In other words, if the satellite records had begun in the 1940s and if the Arctic sea ice extent is related to Arctic temperatures, we would probably have detected a period of Arctic sea ice growth.

Arctic sea ice changes during the pre-satellite era
One of the reasons there has been such interest in the satellite-based sea ice records is that the satellites are monitoring most of the planet and provide almost continuous coverage. But, people were also monitoring Arctic sea ice before the satellite era using various land, ship, submarine, buoy and aircraft measurements.
In the 1990s and early 2000s, Profs. Walsh and Chapman decided to try to combine together some of these pre-satellite measurements to extend the satellite record back to the early 20th century. You can see from the figure below, that their estimates implied that there was almost no variability in Arctic sea ice extent before the satellite era!

For many years, their “Walsh and Chapman dataset” was assumed to be fairly reliable and accurate, and it was widely used by the scientific community.
As can be seen from this clip, it even was shown in Al Gore’s 2006 An Inconvenient Truth film, although Gore seems to have been confused about what data he was showing and mistakenly claims that the Walsh & Chapman graph is based on “submarine measurements of ice thickness”.
https://www.youtube.com/watch?v=vTFuGHWTIqI
By the way, we suspect the submarine measurements Gore refers to are probably the ones from Rothrock et al. 1999 (Open access), but those measurements are a lot more limited than Gore implies, and it had already been published in 1999, so it’s unclear why Gore felt he needed to “persuade them to release it”.
However, when we looked in detail at the available pre-satellite data, we realised that there were serious problems with the Walsh & Chapman estimates.
The main problem is that the pre-satellite data is unfortunately very limited. If a ship travelled through a particular region in a given season, then they could have reported how much ice was in that region, or whether it was ice-free. But, what do you do if there were no ships (or airplanes, buoys, etc. ) in that region?
It seems that in a lot of cases when Walsh & Chapman didn’t have measurements for a given region they effectively ended up assuming that those regions were ice-filled!
For example, in the figure below, the map on the left shows the main data source used by Walsh & Chapman for August 1952. It’s an estimate of the Arctic sea ice extent that was compiled by the Danish Meteorological Institute (DMI). On the map, the red lines indicate the ice boundaries where the DMI actually had taken measurements – in this case, mostly around Greenland and eastern Canada. The white regions on the rest of the map indicate regions where “ice supposed, but no information at hand”. In other words, the DMI was guessing that there might be ice there, but didn’t know!

This period was in the middle of the Cold War and unfortunately there was very little data-sharing between the Soviet Union and western countries like Denmark. So, the DMI had almost no information for the Russian Arctic. However, as it happens, the Russians were making their own observations of the Russian sea ice using aerial reconnaissance, ships, buoys, etc. In the 21st century, some Russian scientists began digitizing this data and publishing it. The map on the right hand side shows the Russian observations for the exact same month (August 1952). The blue regions were ice-free, the white regions were ice-filled and the grey regions were regions they weren’t measuring.
Notice how all of the Siberian Arctic regions that the Russians could see were ice-free were assumed to be ice-filled by the DMI?
The Walsh & Chapman estimates assumed that the DMI’s guesses were accurate, but they weren’t!
Now, we must point out that while we were carrying out our study which used both the Russian data and the DMI data, Walsh and Chapman also updated their estimates. And, the new 2017 Walsh et al. dataset (Open access) uses the Russian dataset too.
However, as we discuss in the paper, their approach still ends up effectively assuming that most of the regions without observations were “ice-filled”! To us, this is a very unwise assumption, particularly for the earlier years when there were very few observations.
So, we realised that the pre-satellite data needs to be re-calibrated to account for the limited observations and also the changes in different data sources (airplanes vs. ships vs. buoys, etc.) for different regions and times. For a detailed discussion of our re-calibration procedure, we’d recommend reading our paper (Abstract here). But, essentially, we used Arctic temperature records from weather stations on land to ensure that the sea ice measurements from each of the data sources show a similar response to Arctic temperatures to that observed in the satellite era.
After re-calibration, we obtained the following result including error bars:

There are several points to notice:
- While Arctic sea ice has indeed been generally decreasing since the start of the satellite era, this coincidentally followed a period of Arctic sea ice growth from the 1940s to 1970s!
- Indeed, the Arctic seems to routinely alternate between periods of sea ice growth and sea ice retreat. This is quite different from the previous Walsh & Chapman estimates which implied that Arctic sea ice was almost constant before the satellite era!
- If we ignore the error bars, perhaps you could argue that sea ice extents since 2005 are lower than they have been since 1901. However, we shouldn’t ignore the error bars. We can see that the lower error bars for the pre-satellite era have been lower at several stages than the upper error bars for the entire satellite era. In other words, the recent low values are still consistent with our estimates for the pre-satellite era.
A useful test of the Global Climate Models used by the IPCC reports (called “CMIP5” models) is to see how good they are at “hindcasting” Arctic sea ice trends. A “hindcast” is a “forecast” that goes backwards in time.
Below, we compare our summer reconstruction with the average of the IPCC’s climate model hindcasts.

We can see that the IPCC climate models were completely unable to reproduce the different growth and retreat periods.
Arctic sea ice changes over the last 10,000 years
In recent years, several researchers have developed an interesting new “proxy” for Arctic sea ice cover, called “PIP-25”, which can be used for estimating long-term changes in Arctic sea ice extent. A “proxy” is a type of measurement which can be used to indirectly approximate some property – in this case, Arctic sea ice cover.
In 2007, Prof. Simon Belt and colleagues noticed that a type of algae which seems to only grow in sea ice produces a specific group of molecules called “IP-25” – see Belt et al., 2007 (link to abstract, link to Google Scholar). They found that if the sea ice in a region melts in the summer, some of this IP-25 will sink to the bottom of the ocean as part of the ocean sediment. However, if there is no sea ice, or if the sea ice remains frozen all year, then the ocean sediment for that year doesn’t contain any IP-25. They realised that if you drill an ocean sediment core for that region, you could use the presence of IP-25 as a proxy for “seasonal sea ice”, i.e., ice that only forms for part of the year.
Later, it was realised that if the IP-25 was absent you could also use the presence of certain species of phytoplankton to distinguish between periods with permanent ice cover (less phytoplankton growth because the sea ice reduces the amount of sunlight under the ice) and ice-free conditions (more phytoplankton growth). So, by combining the IP-25 and phytoplankton measurements in an ocean sediment core, you have a “PIP-25” proxy series (“P” for phytoplankton) which can distinguish between three types of sea ice cover:
- Permanent ice cover (low IP-25 and low phytoplankton)
- Seasonal ice cover (high IP-25)
- Mostly ice-free (low IP-25, but high phytoplankton)
In Stein et al., 2017 (abstract here, although the paper is paywalled), Prof. Rüdiger Stein and colleagues presented the results from two new PIP-25 ocean sediment cores (from the Chukchi and East Siberian Seas) and compared them with another two cores from earlier studies in different parts of the Arctic (one from the Laptev Sea and the other from Fram Strait).
We have adapted the maps below from Figure 2 of Stein et al., 2017, with some editing to make the locations easier to see. The maps show the location of the four cores relative to the maximum and minimum Arctic sea ice extents in 2015. The four cores are quite well distributed throughout the Arctic and so should give us a reasonable estimate of how sea ice has varied throughout the Arctic over longer time scales.
Notice that all four locations were ice-free during the summer minimum (06 September 2015), but three of the locations (the Chukchi Sea, East Siberian Sea and Laptev Sea cores) were ice-covered during the winter maximum. In other words, these three locations currently experience “seasonal sea ice cover”. The remaining location (the Fram Strait core) was still outside the ice extent even during the winter maximum (17 March 2015). So, currently that location is “mostly ice-free”. However, as we will see, the PIP-25 sediment cores suggest that these conditions have changed over time.

For the four plots below, we have digitized the PIP-25 results for the four sediment cores from Figure 10 of Stein et al., 2017. Roughly speaking, PIP-25 values below about 0.5 indicate that the region was mostly ice-free at the time (Stein et al., 2017 use the term “reduced sea-ice cover”), while values above about 0.7 indicate that the region was permanently ice-covered, i.e., it remained ice-covered throughout the entire year (Stein et al., 2017 use the term “perennial sea-ice cover”). Values between 0.5 and 0.7 indicate that the region experienced “seasonal ice coverage”, i.e., it was usually ice-covered during the winter maximum, but ice-free during the summer minimum.

As we discussed above, three of the locations (the Chukchi Sea, East Siberian Sea and Laptev Sea sites) currently experience “seasonal ice coverage” and the Fram Strait site is currently “mostly ice-free”. However, according to the PIP-25 data, over the last 10,000 years, all four of these sites have gone through extensive periods with less ice coverage as well as extensive periods with more ice coverage. In particular, all four locations seem to have experienced much less ice coverage 6,000-8,000 years ago (i.e., well before the Bronze Age) than they do today.
This suggests two points particularly relevant to our discussion:
- Arctic sea ice extents have shown a lot of variability over the last 10,000 years (at least), so we shouldn’t be too surprised that the extents have substantially changed since the start of the satellite records in 1978.
- Despite the widespread belief that the current Arctic sea ice coverage is “unusually low” (based on a combination of the 1978-present satellite records and computer model results), it seems that the coverage was actually a lot lower 6,000-8,000 years ago.
Summary
- After re-calibrating the pre-satellite data, it now transpires that Arctic sea ice has alternated between periods of sea ice retreat and growth. The satellite record coincidentally began at the end of one of the sea ice growth periods. This has led to people mistakenly thinking the post-1978 sea ice retreat is unusual.
- The results from new sea ice proxies taken from ocean sediment cores suggest that Arctic sea ice extent has varied substantially over the last 10,000 years. They also suggest that Arctic sea ice extent was actually less before the Bronze Age than it is today.
- The current Global Climate Models are unable to reproduce the observed Arctic sea ice changes since 1901, and they seem to drastically underestimate the natural sea ice variability
And most of all, no one has said to me how can Ice melt if the air temperature goes from -38 to -8°C (30 degree of “warming”). Doesn’t ice melt at 0°C?
There is some study about microwaves (ice melt without air warming) and/or sea waves, or tide, that can stress the ice border?
Ocean temps above 0C.
For those that are interested, Ron Clutz has performed a useful study of Arctic temperatures and concludes that there is no alarming warming. See: https://rclutz.wordpress.com/2016/05/06/arctic-warming-unalarming/

Ron looked at the temperature record of stations around the Arctic circle. Here is the details of the whereabouts of the stations studied.
This is the result of his analysis of the reported data from those stations:
Does Ron submit his slam dunk evidence to anyone worthwhile ?
There is nothing contentious about Ron”s analysis. After all, the station data is the data.
If you had looked at my comment detailing the Hadcrut plot, you will note that Ron’s finding is in line with that.
Hadcut (which is accepted by the IPCC) also shows no significant warming, and shows that temperatures today are not as warm as they were back in the 1920s, let alone the 1930s
…and curiously US data and NH data follows that chart as well. At least it used to before the blip was removed.
That depends on your definition of worthwhile. Much like sea ice charts, that varies widely depending on one’s preconceived beliefs.
Read this;
http://www.nature.com/ngeo/journal/v1/n11/fig_tab/ngeo338_F1.html#figure-title
Thanks for pointing to this Richard. I must say my post is a synopsis of Arctic temperature trends from the early nineteenth century to the present, W. A. van Wijngaarden, Theoretical & Applied Climatology (2015).
What do we know about Arctic sea ice trends?
Two thirds of the summer ice has flash melted.
http://neven1.typepad.com/.a/6a0133f03a1e37970b01bb09a1f2e6970d-pi
the rate is accelerating.
This we know. Move along.
To bad this will be one of your last post Tony, will miss you. see you in three weeks.
You apparently don’t know that trends reverse, hence extrapolation is unjustified.
The trend since 2012 has been for growing ice. The trend was slowed by the 2015-16 Super El Nino, but should continue next year.
Arctic sea ice, like all climatic phenomena, is cyclic. It’s decline for some 30 years was natural, having nothing at all to do with CO2. If manmade GHGs were the cause, then what caused the increase in Antarctic sea ice from 1979 to 2014?
And what caused the decline in Arctic Sea Ice between 1928 and 1945 (See the 1980 Vinnikov study paper referred to in posts above). The IPCC confirm that CO2 (manmade or otherwise) did not cause pre- 1945 changes.
In 1980, when the Warmist world was created……..
Move along? Now? Right before it all disappears next month? Evidently your chart is not “peer reviewed”, your peers would have adjusted the chart to remove that embarrassing box in the upper right.
And only the most mathematically and scientifically illiterate would think that any natural cycle could be linked to a quadratic trend.
Must be one of the really high up in the AGW hierarchy.
next time you post that chart you can compress it a further 50% and hey presto even greater rate of acceleration . alarmist visual manipulation of that sort was old hat a long time ago on here tony.
Apparently created and covers 1750 to 2016, really?
During World War Two, in 1940, the Germans passed a warship disguised as a merchant ship called Komet into the Pacific Ocean through the North East Passage and the Bearing Strait. They had an Russian Ice breaker escort part of the way, but it was never needed. The Germans had plans to do like wise with other warships into 1943. The Russians routinely used the North East Passage during the 1930s. This indicates that there was probably less overall sea ice then than there is now, and that there was certainly less sea ice along the passage route than there is now.
KT66 August 17, 2017 at 6:36 pm
During World War Two, in 1940, the Germans passed a warship disguised as a merchant ship called Komet into the Pacific Ocean through the North East Passage and the Bearing Strait. They had an Russian Ice breaker escort part of the way, but it was never needed.
According to the captain, Robert Eyssen, he could not have achieved it without the assistance of the icebreakers.
Correct he needed icebreaker assistance for two short stretches, one east of Cape Chelyuskin from 77 30 N, 108 00 E and another short stretch in the Kolyma gulf. The first of those would require icebreaker assistance this year as well, but not the second:
http://www.aari.ru/resources/d0015/arctic/gif.ru/2017/20170815.gif
According to some narratives the ice breakers lead him through intricate channels, but not needing to break ice. At one time the ice breakers would not continue fearing the passage blocked by icebergs, but the Komet was radar equipped and the Germans pressed on anyway. The Soviets suspected that the Komet was really a warship and reported that it apparently had advanced “radio intercept equipment.” The Russians withdrew their ice breakers prior to the final legs, figuring it could not complete the passage, and told them return to Murmansk. However, the Komet pushed on without escort and found the passages open.
Well look at the Russian northern sea route this year and in the last decade.
Travel without icebreaker assistance possible – and even when part of the route blocked early in the season, longer and longer ice free stretches, earlier in the year.
Apparently the Arctic during the 40’s was much the same as now, and has been several times.
I see your point, Griff. 1940 wasn’t identical to today. Just very, very similar. Now, how is that a problem? Is Hitler back?
About time, hey. Back some small way towards the lesser sea ice levels of before the LIA.
The benefits of not needing an ice-breaker escort would be ENORMOUS, wouldn’t you agree, griff. !
The benefits of open sea for more than a few weeks would also be ENORMOUS, wouldn’t you agree, griff.
Point of history: In 1906 Amundsen successfully completed sailing the Northwest Passage, sans icebreaker, in the sloop Gjøa. Someone earlier (at 4:42 a.m.) made the statement that the Northwest Passage was “… not open for navigation in the 19th and 20th centuries.”
The fact that the arctic is melting, but the Antarctic is growing, and that CO2 is a well mixed gas, couples with the fact that solar input is next to nothing due to the angle incidence, it becomes obvious the CO2 is NOT the cause.
Winds, and warm ocean currents are the more likely culprit.
antarctic sie is not
growing. it’s near a record
low…..
Just one year shows a trend???
I think you mean Antarctic sea ice… what the hell is sie?
The antarctic sea ice is now giving it’s response to the El nino of 2016.
if you know your stuff you would know that the antarctic waters lag in response on each big el nino for about a year or two, to return normal afterwards..
if you would have followed the SST anomalies you would have noticed that the big difference between a “typical el nino” and the one of 2015 is that most of the warm waters veered…. south instead of north The antarctic sea ice is responding very naturally to that displacement. As did the record low tropical cyclone season in the southern hemisphere. That’s where the cold waters got displaced to. In a good yera or two the arctic has recovered from that. it’s already doing that.
Crackers …… seriously? I guess if you hold the Antarctica edge ways, just right against the light, you might could see some “global warming” in it, but that would be a real stretch. According to the study in GRL …. the rapid melt of the latter part of 2016 was the result of some anomalous storm activity pushing massive amounts of warmer water and air to the Antarctic. They said that southern ice being so thin, it is extremely succeptable to wind and wave. The melt was all in a 6-8 mo period with the majority happening in just a few weeks around. Look at the NIDC graph. This is all Reminiscent of the cyclonic activity in the arctic that turned the north to slush in 2012.
You are free to “believe” anything you want, but the fact remains …. the temp trend for Antarctic was down between 1979-july2016. Ice trend was up over the same period. A one time event that will recover the next 10 years is a case for alarm. …. nor does it support CAGW.
Antarctic sea ice grew from 1979 to a record high in 2014, all the while Arctic sea ice was supposedly falling. Hence, CO2 cannot possibly be the cause of Arctic decline. Don’t know where it will end up, but at the moment is not at a record low for this date.
That both Arctic and Antarctic sea ice are lower than average right after the biggest El Nino of this century (at least) should surprise no one.
gloateus – you make one
of the 3 or 4 basic mistakes:
thinking that
co2 is responsible for
everything.
it isn’t. natural variability
still exists.
ps: global sea ice extent
is
at a record low.
That’s right, and I think it will stay low for a while, but Antarctic Sea Ice has not been affected much of AGW, the switch we have seen in the last couple of years is du to a switch in the Pacific (PDO/IPO etc.)
The extent the last decades har been about the same as in the days of Amundsen and Scott a hundred years ago. But not so in the Arctic that is unprecedented for several hundred of years.
Valaker commented – >> The extent the last decades har been about the same as in the days of Amundsen and Scott a hundred years ago. <<
where's that evidence?
you should have provided it
without anyone having
to ask.
We know that Arctic sea ice is only a small amount down from its extreme in the LIA.

We know that around Iceland, one of the main areas of sea ice expansion (data ignored in scammer proxies) that the late 1970’s had levels up there with those of EXTREMES of the LIA.
AndyG55 – what is the source of data for “Holocene Sea-Ice Cover Variations”, above?
source?
We know that real , untampered temperature around the Arctic follow the AMO and were pretty much the same in the 1940’s as they are now.
I notice Svalbard isn’t in there… which showed record highs for 2016.
one place, urbanised and heated So what !!
Also an urban heat island.
Look how warm Ostrov Dikson Arctic was in the 1940s.
very diff picture
History of sea ice in the Arctic, L Polyak+, Quat Sci Rev 29 (2010) 1757–1778.
http://research.bpcrc.osu.edu/geo/publications/polyak_etal_seaice_QSR_10.pdf
More than a decade ago John [Walsh] would be giving a talk to fellow academics and show his plot with the right most point diving to Hades. “Ah Ha! The Walsh Plot!” an academic in the audience would shout! All would laugh!
Today the Main Stream Media types revel in “Walsh Plots”. Perhaps in their minds the plots show that indeed humanity along with the main stream media must be exterminated.
Just the main stream media’s cup of tea!
Ha ha
what do
the data show?
Arctic temperatures are dropping in the summer. I wouldn’t be surprised if 2017 is in the top 3 for temperature staying below for the most consecutive days.
Co2, directly, can not explain only a winter time increase in temperatures. Therefore attention should go elsewhere.
Looking at temperature constructs from 1958 to present, we can see that it wasn’t unusual for arctic temperstures to be above average in winter. The duration was short though, before going to average or below average.
I think most of this is a change in weather patterns and then, ironically, the resulting lower of sea ice, year on year, helping push temperatures higher. Maybe I’m wrong.
Maybe that is co2 driven, but that should be shown. In the mean time, putting ones faith in co2 driven models for sea ice is a fools errand.
Open water=marine climate=higher, spikier temps
I don’t rremember where I could read that whales skeletons carbondated thousands years ago were found in remote high latitudes places where these animals cannot go in our times due to permanent sea ice.
Interesting we have pre-era satellite estimates spliced with satellite era measurements.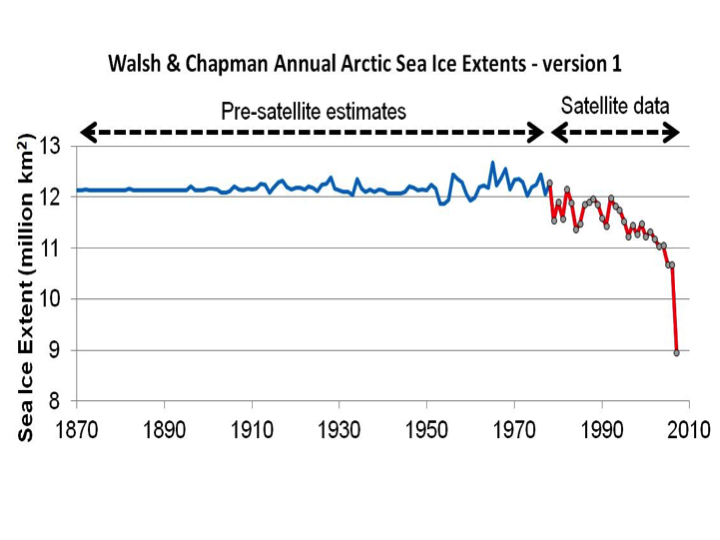
Isn’t Mann accused of doing similar?
Did Mann clearly label his instrumental data? I don’t recall seing that on the graph, though I have not seen all versions of the graph. Marcott did label his, though all sources did not show that.
Sheri, what are you talking about?
Go and read Climateaudit by Steve McIntyre. It will tell you all you need to know about Mann.
Isn’t Mann accused of doing similar?
============
outside of climate science, splicing one proxy onto another is forbidden, because it generates mathematical nonsense.
in climate science however, proxy splicing is seen as a positive boon, because it can be used to prove anything you want to prove.
The proxy data show a significant correlation between PDO/AMO 30-year warm/cool cycles and decreasing/increasing Arctic Sea Ice Extents.
Arctic Sea Ice satellite data started at the end of the 1945~1978 PDO Cool cycle when Arctic Ice Extents peaked in size. When the 30-yr PDO warm cycle started in 1978, Arctic sea ice extents started to fall, and the when the AMO entered its 30-year warm cycle in the early 1990’s, the pace of declining Arctic Sea Ice Extents increased.
The new PDO 30-yr cool cycle officially started in 2008, but its cooling effects have so far been masked by two El Nino events (2009/10 and especially the strong 2015/16 El Nino event), and the weird North Pacific “The BLOB” event (2013~15). Since both of these phenomena are over, a possible La Nina event starting at the end of 2017, the 30-year AMO cool cycle starting from around 2019, and with weakening solar cycles, It’s highly probable that we’ll start seeing a recovery of Arctic Ice Extent extent from this year and perhaps generally increasing for the next 50~100 years, depending on what effects a Grand Solar Minimum event has on our climate.
An important aspect many CAGW advocates seem to miss is that low Arctic Sea Ice extents allow more ocean heat to be blown out to space as it’s not covered by ice, although, conversely, exposed open Arctic water also allows solar radiation to be absorbed and earth’s albedo is slightly decreased from less white ice/snow in Arctic regions.
Both polar caps greatly assist the earth to maintain a relatively stable global temperature with warm tropical ocean gyres moving massive quantities of water to the poles, where the energy is eventually blasted out to space or used to melt sea ice under the 2nd Law of Thermodynamics.
The next 4~5 years should be interesting and should indicate what effects PDO/AMO 30-year cool cycles and weak solar cycles have on polar ice extents, and land-ice growth in Greenland and Antarctica…
It should be fun to watch. If this hypothesis is correct, the CAGW advocates will have an extremely hard time explaining why Arctic Ice Extents showed recovery over the next 5 years, in spite of 1/3rd of all manmade CO2 emissions since 1750 have been made over just the last 25 years…
Let the games begin.
arctic sea ice is not recovering in 2017 – currently extent is below that for 2016.
So let the games begin next year?
Griff-san:
2017’s Arctic Minimum Ice Extent will be around the 3rd or 4th lowest since 1978 and close to 700 KM^2 larger than 2012, while Arctic Ice Area will be the 5th lowest, s0, yeah, even this year’s minimums will show recovery….
A far cry from an Ice-free Arctic summer Minimum predicted by 2012 by silly Leftista….
Whoops.. meant 700K KM^2.
Are you clairvoyant?
three weeks to go and the ice is in bad shape.
but at least 3rd lowest looks likely – and in a year which has seen a cold central arctic and poor melt conditions.
Third lowest is a ‘recovery’? in such a poor melt year?
Hehe Griff, well, erm, it’s August, why would it be recovering now?
Considering its starting point, ending up either 3rd or 4th lowest is quite remarkable.
Griff, ten years of no trend, the AMO turning, the only thing doomed is your alarmism.
If it was ‘recovering’ John, then we’d expect it not to be lower than last year/all previous years but 2 at this (late season) date.
David
Really?
No trend in volume? In multi year ice?
Griff,
Arctic sea ice, contrary to your prediction that it was sure to make a new low this year, will continue the recovery trend since 2012.
Until there is indeed a new record low, Arctic sea ice is in recovery mode. Not that that is a good thing. An ice-free Arctic Ocean in summer would be way better.
As it has been, in effect, for most of the Holocene.
Nope, the RECOVERY from the extremes of the late 1970’s has levelled out.
Pity, because a lesser amount of sea ice would have been a great benefit t those people living up there.
Multi year ice?
Russian charts (you know, the guys with all the Ice-breakers), have an upward trend in multi-year sea ice.
OOPS.. griff … WRONG as always, poor little chicken-little
“Griff August 18, 2017 at 4:48 am
Are you clairvoyant?”
You claim to be as you stated the sea ice in the Arctic would be the lowest on record. So far, it isn’t, not by a long shot.
Griffikins,
You’re uncanny. On the very day you crow that Arctic sea ice extent is below 2016 for August 18, it crosses over it.
Arctic sea ice is now more extensive than for 2007, 2012 and 2016, headed for 2011 and 2015. Unless there are cyclones this month or next, you’re sure to lose your “sure thing” bet, as your betters told you would be the case back in March.
Griffypoo,
Your hopes are being cruelly dashed yet again by reality during this eclipse week.
The turn that Arctic sea ice extent made the same day you crowed about how low it was has continued.
As your betters foretold, it has now crossed over not only 2012, 2007, 2011 and 2016, but is headed for 2015.
This trend is liable to hold until or unless there is a cyclone, again as your betters told you would be the case. As August wears on, the likelihood of a storm this month lessens.
Instead of the new low which you so confidently predicted, 2017 is liable to end up as fifth, sixth or even higher low year, unless there be a freak late summer cyclone. All that open water which so excited you only served to cool the Arctic Ocean, again just as your betters told you would be the case.
Calling all Griffters!
Hope you’re enjoying the games you said could now begin. And that you’re OK, since you have mysteriously disappeared as Arctic sea ice melt has slowed so dramatically.
Looks as if this year will cross over 2015 tomorrow or Saturday.
A lot could still happen over the next month, but right now, it looks as if 2017 Arctic sea ice extent will finish in the middle of the past decade, higher than 2012, 2016, 2015, 2011 and 2007, but lower than 2009, 2013 and 2014, while 2008 and 2010 are still up for grabs. Depends upon how long the current melt rate trend lasts and whether there are storms.
Griff is still missing, nowhere to be found. I wonder why?
Yesterday, 2017 did indeed cross over 2015 extent for that date. So now this year is right in the middle of the past eleven years. From the record low of 2012 up, we have 2016, 2007, 2011, 2015 and 2017, with 2014, 2013, 2010, 2009 and 2008 higher than now.
Thus, despite steadily rising CO2 for the past decade, Arctic sea ice extent is higher now than in 2007. It was also higher in every other year since then except 2012 and 2016, which was essentially tied with 2007.
It’s increasingly likely that there will be no new record low this year, as so confidently predicted by Griff as a “sure” thing. As the loser’s betters told him was liable to be the case. As noted above, this will be the longest period in the dedicated satellite record without a new lower low.
it’s because they (=the CAGW meme groups) know nothing about the arctic.
real researchers do say this: the problem with the arctic is that it is water surrounded by land and that the main drivers are the currents. the arctic is also not the coldest place during winters, it are the surrounding landmasses (Siberia, northen canada and greenland) that gather the cold, and release it over the arctic ocean. Ocean currents there are able to counteract this cooling and then they didn’t speak about the complex variability of these currents and the weather patterns
in short it has a dynamic that is yet not fully understood. I would not be surprised to see it recover anytime in the future.
In 1944, Larsen in the St Roch negotiated the NWP passed Banks Island , without the aid of modern navigation and satellite sea ice maps. (from MODIS)
 (from latest Russia chart)
In 1969, The SS Manhattan followed the same route through the NWP..
2017.. doesn’t look like being possible
Russian charts agree that the 1944, 1969 route is pretty well impassable.
How many icebreakers on the St Roch expedition?
https://www.skepticalscience.com/StRoch.html
Would a cruise liner have been able to sail through without ice breaker constant assistance in 1944? (or at any time in the 20th century?)
and we have 3 weeks to the end of the melt season.
1944 ice breaker. roflmao
You really have to stretch reality to keep up your chicken-little Arctic sea ice farce, don’t you griff.
Even though you must know by now that it is currently above what it has been for some 90-95% of the last 10,000 years.
Its rather pathetic, wouldn’t you say. !!
And thanks for the link showing just how BENEFICIAL having a lesser sea ice extent would be.
doing well, griff. !
I have been involved in shipping for some 30 or so years, and the idea that a vessel of the design of St Roch can be compared to a modern ice classed vessel is absurd. One of the commentators on the scepticalscience blog even suggested that St Roch was akin to an ice breaker and the moderator did not point out how absurd that comment was but instead appears to have endorsed it. Talk about being objective.
If a vessel was constructed to today with the same design and specification as St Roch, it would be regarded as unseaworthy for plying an ice bound route.
Griff, I do not expect you to be a naval architect and to be familiar with vessel design, ice strengthening, propeller design, changes in material used for propellers for ice classed vessels etc, but I would expect that common sense alone would tell you that an iron clad timber vessel is nothing like a vessel of 1980s on wards design. Quite simply there can be no comparison.
But of even more significance, and this is a point completely overlooked in the scepticalscience article, is the change in navigational equipment. Modern vessels ere equipped with a vast array of modern technology providing them with almost real time ice data, satellite imaginary, extremely accurate GPS positioning (showing accurate position of the of the vessel in relation to ice), and the like. They are equipped with modern technology such as drones, or helicop[ters and/or snow scooters and can quickly see how ice conditions are changing and where ice is most broken up/open water exists. This makes navigational route planning and execution radically different to the early 20th century (for that matter prior to 1970). When a vessel like St Roch encountered ice and got stuck, they would have to either grin and bear it, or sent out a party on foot (if very lucky with a dog sleigh) to go on a 20 or 30 mile hike. Now they can get an aerial view from a drone or sent out a snow scooter to do reconnaissance. A vessel such as St Roch either had no charts of ice, or out of date charts of ice.
It is so much easier to progress through ice conditions today than it was in the past, and this point alone strongly suggests that when vessels made a successful passage long ago, it was only because the ice conditions were far less severe compared to those of today.
Yes it looks like this climate fiasco caused by western hubris is another mess that the Russians are going to have to get us out of.
AndyG55 August 18, 2017 at 3:35 am
In 1944, Larsen in the St Roch negotiated the NWP passed Banks Island , without the aid of modern navigation and satellite sea ice maps.
In 1969, The SS Manhattan followed the same route through the NWP..
In late September, 2014 so did the MV Nunavik, carrying 23,000 tons of nickel ore to China.
Meanwhile back in the world…
The Peruvian anchovies are looking strong:
https://www.undercurrentnews.com/2017/08/11/perus-exalmar-optimistic-on-anchovy-conditions-for-fall-season/
Thus so is the Peruvian upwelling, suggesting possibly an incipient La Nina.
The Arctic ice is showing an upturn in the last couple of days (WUWT Polar ice page).
Air temperatures up there are well below zero, ahead of schedule.
So the death spiral is probably going to have to wait another year…
er, no… it isn’t.
look at all the graphs here:
https://sites.google.com/site/arcticseaicegraphs/
This is what is happening now, …http://ocean.dmi.dk/arctic/meant80n.uk.php
yes gold – and despite that we have a bottom 3 record extent still dropping
@Griff…which just shows that the current sea ice melt is caused by warm ocean currents moving into the Arctic, and wind patterns. The wind patterns have just recently made a change that is certainly part of or the main cause for the cooling in the Arctic. You miss so much with your preconceived outlook. Look out the window, so to speak.
very little arctic sea ice melt is due to water temperature. the majority of “heat” in atlantic water entering the arctic is lost to the atmosphere on its way there. the low salinity ,low density cold “lid” of water over the arctic ocean means little exchange of energy upwards from the denser water below.
O yes it is.
Your own linked graphs show it.
Griff,
Your oft-repeated prediction that Arctic sea ice was “sure” to make a new record low this year is looking bad, as you were warned by your betters would be the case.
According to NOAA, Arctic sea ice extent for this date is well above 2012 and higher than 2007, although nearly tied at the moment. It’s close to 2016 and 2011.
As your betters told you, what happens to the weather this month and early next will determine the final extent. If, as in 2007, 2012 and 2016, there are cyclones, then September minimum will be lower. If not, then higher. But in any case, the odds of a new record low are exceedingly low.
That means that the now-trend remains increasing Arctic sea ice for the fifth year running.
Today, NSIDC has it above 2016 levels
Greg
First, off I wouldn’t care about Griff one way or the other except that he takes such pains to slander every scientist that he disagrees with I.E. Dr Soon, Dr Crockford and others. he doesn’t just counter their points he attacks them both personally and professionally, posting information about them that he knows is false and I have proven it multiply times.
Second, value is in the eye of the beholder and you are not the determiner of what holds value. Griff can post here for ever and spew what ever none-sense he wants that’s his right, however i have every intention of pointing out as often as I can that he is both a Slanderer and a BSer. that is my right until Anthony tells me it isn’t (it’s his site after all).
Third, i have challenged Griff to not just tell everyone else what they don’t know but to actually state what he does know and what he believes will happen, he obfuscates at every turn never making a stand or a statement to be held to, so why in gods name should anyone listen to him. It amazes me how many people post here that are just armchair quarterbacks, really great at attacking every attempt that others make to describe how the system may work but never actually making a stand and putting their name to an idea. This is what is wrong with our world today, people that want to tear down everyone and everything because they can find fault in it. Well guess what, every idea, everything and everybody has faults, it’s not those that can attack those faults but those that can generate the ideas that are contributing, like Dr Soon, Dr Crockford and all the people that post here like Willis, Middleton and Montock that Griff attacks. so forgive me if I waste a little bit of everyone’s time pointing out that Griff is a fraud.
intended as a response to Greg at 1;09
I am merely repeating what scientists in their fields say about Soon and Crockford – and that only because if they are to be cited here, all need to understand what the wider scientific community think of those researchers. If your argument, which you intend to be convincing relies on their evidence, well, you cannot expect some sections of the wider community to accept it. Just as some people here might not be swayed by something Michael Mann publishes…
but I would rather not be arguing about individuals, but the science.
What do I know?
I know what the published science is and I repeat it here. I would be pleased to debate you on the points of the science. If I am ‘BS’ ing, up to you to put the science which proves I am on the table.
the wider scientific community think of those researchers.
============
there is nothing the scientific community hates more than researchers that show the scientific community to be wrong.
in the history of science, there is almost no new idea that was not first ridiculed by the established scientific community. and the researchers that proposed the new ideas were almost universally called quacks and charlatans.
and today’s science is almost 100% composed of once ridiculed ideas. I would be more suspicious of ideas that were not first ridiculed, because they are most certainly wrong.
For example, the notion that heavy and light objects fall at the same speed. That heretical idea would probably have gotten you burned at the stake many times over the past 2000 years.
Griff,
The consensus is always wrong. Always.
Then, when a more correct consensus finally emerges after millennia, centuries or decades, which subsequently needs modification.
Griff
The wider community here knows what you are! though it is good to see you at least acknowledge that Dr Crockford is a scientist since you tried to convince everyone that she had no credentials only to have it shoved up your ***.
Griff
OK man up and take my bet, you keep saying that arctic ice is melting at an unprecedented rate and that we will soon have an ice free North Pole in the summer (per your great knowledge of the science), well give us a date when this will happen, any date you want and I will bet you it won’t. The loser never posts anything here again. Tony M took me up this year and he’s going to be gone in three weeks, but at least he had the nuts to do it, i am betting you don’t.
ferdberple August 18, 2017 at 9:12 am
Yup. Consider the history of the theory of gravity.
Aristotle’s view was the consensus for about 2000 years, ie that heavy bodies fall because they seek their proper place at the center of the earth.
Around AD 1600, Galileo showed this conclusion false, by demonstrating that objects of different mass fall at the same rate. Based upon this discovery, Hooker later in the 17th century suggested that gravity is a force acting on all masses at a distance in the inverse square law. Newton then used this relationship to derive the orbits of the moon and planets.
The Newtonian consensus reigned supreme and unchallenged until 1905, when Einstein showed it false. For Newton, space and time were absolute and gravity acted instantaneously. Einstein stood this consensus on its head, demonstrating that space and time are relative and curved, that gravity acts at around the speed of light and is in effect acceleration.
Now some are not so sure about Einstein’s conception of gravity. Some of his predictions have been confirmed, but others not so much. Science still doesn’t know what gravity is, after all these millennia.
But “climate science” is settled. It is to laugh.
Bob boder August 18, 2017 at 9:56 am
Tony M took me up this year and he’s going to be gone in three weeks, but at least he had the nuts to do it, i am betting you don’t.
What exactly was the bet?
Just because it’s published and even peer reviewed does not make it science. Mann’s hockey stick is not science for example because it was not created by the scientific method. A corner stone of that method is the ability to replicate results by others doing the same experiment or using the same data and methods to reach identical or nearly identical results. That requires total transparency. Mann has not, and will not, even under a court order, release that fundamental information needed for such replication. Thus it is not science. In fact until proven otherwise it is fiction.
Phil
An ice free geographic north pole
Griff
Is that crickets I hear?
Bob boder August 18, 2017 at 3:42 pm
Phil
An ice free geographic north pole
By what measure? It was within a few feet of that last year. The Odeon sailed to 89°N 59.995 on 8/22/2016.
Look Griff you dud
**I know what the published science is and I repeat it here. I would be pleased to debate you on the points of the science. If I am ‘BS’ ing, up to you to put the science which proves I am on the table.**
How can you debate on science when you have no knowledge of it. I asked you to answer two questions and you refuse. Show us how you measure heating by CO2 and where is the paper which shows 2 deg C is critical to runaway warming. You are BS ing. Arctic ice is not decreasing in the last 10 years – there.
***I am merely repeating what scientists in their fields say about Soon and Crockford – and that only because if they are to be cited here, all need to understand what the wider scientific community think of those researchers.***.
Only idiots and BS ers repeat lies that others said. Show me a credible scientist who has slandered Dr. Soon and Dr. Crockford like you have. They should sue you but you are not worth it.
Phil
Open water, not just able to get there.
“What do I know?”
NOTHING!
But you aren’t half good at making stuff up.
Griff
” I would be pleased to debate you on the points of the science. ”
Indeed, so would we all, but little chance as we will be cited some out of date graph from the 1980’s as best evidence.
It would be fascinating to be able to give this data to a scientist who had never heard of global warming and see the results. Without an agenda, would the person note the lack of data, use error bars and include the whole record, not just parts? I don’t think we could find such a person, unfortunately.
In the absence of that, maybe a double-blind experiment giving the same data to skeptics and advocates. I suspect the results would be very enlightening. Now that science is so tied up in politics and the apocalypse, actual objective results are harder and harder to find. I’m sure some researchers are very good. No doubt. However, confirmation bias is so engrained in both sides now, unbiased results are virtually impossible to find.
I expect the results would come out something like Berkley Earth
Nope. As soon as you look at your results to decide if the answer is correct, you have broken the experiment, because you have introduced subconscious bias into the results.
Berkley Earth, funded entirely from the AGW agenda slush pool.
Funded to push the AGW FARCE into the stratosphere . !
**I expect the results would come out something like Berkley Earth**
NO, you are both duds.
Accounts from 19th-century Canadian Arctic Explorers’ Logs Reflect Present Climate Conditions
https://seagrant.uaf.edu/nosb/2005/resources/arctic-explorers.pdf
“Berkley Earth, funded entirely from the AGW agenda slush pool.”
Entirely?
That is the first time I have seen the Koch’s described as the AGW agenda slush pool!
se1 – you’re right. berkeley
earth got, i think it was, a
quarter mill from the koch
brothers.
– why are the error bars as large in the recent satellite era as they are in the early 1900s where data comes from estimating and combining multiple days sets? The smallest error bars are in the early satellite period, which doesn’t appear reasonable – surely these century-old estimates are less certain than our modern satellite observations. Same with the early 80s observations.
– “proxy” means a stand-in, and is derived from procuracy (power of attorney), rather than “approximation”
– “it now transpires” is just wrong – our changed observations change our understanding and conclusions, but not what “transpires”
– comparing the variation new estimate of variability against the mean and median of CMIP5 model runs is not useful. Taking the mean and the median automatically smooths out variability.
“All of the research in this collaborative paper was carried
out during the authors’ free time and at their own expense.”
Thank you.
No, lads, you have it all wrong!
As i explained some time back, you have completely ignored basic scientific principles, which I shall lay out below.
The Arctic ice melts, slowly; and the very cold water enters the oceans. Everyone knows that cold things fall down, so all that cold water drops down, through gravity, towards the Antarctic, where it freezes up again. Simples!
Hmmm… are you sure the arctic is at the top?
griff, i believe you missed bob boders post above regarding your conviction on disappearing arctic sea ice . your lack of response is typical of the majority of the vocal alarmist community. i may not agree with jim hunt on many things climate related, i do however respect the man as he had no problem in accepting a £1000 charity bet on arctic sea ice .
“SWIPA estimates that the Arctic will be free of sea ice in the summer by 2040. Scientists previously suggested this would not occur until 2070.”
I seem to recall a great deal of consensus predicting Sea ice demise by 2020 or so.
getitright – given your moniker it is incumbent on you to actually get it right. There was in fact no such consensus, so perhaps you should change your moniker to “getitwrong”.
Prove me wrong if you can.
Bear in mind that consensus is not one or two quotes. A good place to start for looking for the consensus position would be the IPCC reports.
Griff, thread bombing again!
“Griff, thread bombing again!”
Even CAGW trolls have to earn a living.
Has anyone correlated the amount of particulate matter in the atmosphere to the loss of Arctic ice? Are we chasing the wrong cause by laying the blame on greenhouse gasses alone? China’s rapid industrialization has seen massive releases of particulate matter into the northern hemisphere. They lag the west in the use of scrubbers for coal fired generation plants. Major cities are almost unlivable because of particulate pollution. In the 1960s and 70s the Soviets ran tests in Siberia to see whether powdered coal spread by bombers could be used to accelerate the natural spring thaw. You can see this effect yourself by spreading sand on ice in daytime. It would explain the difference between Arctic and Antarctic ice loss.
I’m intrigued that Griff’s comments on this thread seem more substantial than those I’ve encountered in the past. He must have acquired a new set of ghost writers.
Anyway, keep up the good work. I think it will be of real use for posterity.
Hi everyone, first of all, apologies for not being available either here or on the original post at Judith Curry’s for the last week! Unfortunately, both Michael and I have been unexpectedly busy the last week and we’ve had almost no time for checking the blogs/replying to comments, etc.
However, I am glad that our post (and our recent HSJ article) has created such interest. And thanks to Charles the moderator for reposting our article here on WUWT.
I’m not sure how long this comment thread will stay open, but I will try to briefly address some of the main questions & comments now. Sorry if I don’t get to everyone’s comments, but I will also try to set aside some time tomorrow:
Bryan A at August 17, 2017 at 7:50pm asks whether the PIP-25 studies took polar ocean currents into account. It’s a good question, which we asked ourselves when we first saw the data. Yes, they include a discussion of it in their paper, and they conclude it is not a major problem for their analysis. To me, the fact that all four of the sediment cores taken from very different regions within the Arctic show similar trends is another argument in favour of their reliability.